

Reliability analysis of retrieving surface waves from ambient noise data between seismic station pairs: An example of application at broadband stations in central and eastern China
-
摘要: 利用中国大陆中东部地区以国家台网为主的100个分布均匀的宽频带地震台记录到的21个月的连续波形数据, 经过单台数据处理和互相关叠加计算后, 由时频分析法提取了研究区各台站对间瑞雷波的格林函数. 为了检验经验格林函数的可靠性和稳定性, 对沿部分路径的经验格林函数和频散曲线进行了质量评估. 检测结果表明, 自21个月叠加的台站对间背景噪声中提取的经验格林函数与实际的地震面波一致, 提取的格林函数可靠. 此外, 统计了使用从3—21个月不同长度数据叠加后, 经验格林函数信噪比大于10的频散曲线数目. 结果表明, 至少要使用12个月的数据才能提取到信噪比足够大, 数目足够多, 可用于反演面波速度结构的经验格林函数; 12个月的叠加时长, 可以保证30 s以下周期的频散曲线在时间上稳定.Abstract: We retrieved Rayleigh wave Green functions between all possible station pairs after pre-processing, cross-correlation and stacking the data, which are 21 months' continuous ambient seismic noise recorded by 100 evenly distributed broadband seismic stations mainly in the National Seismic Network in central and eastern Chinese mainland. The quality of the empirical Green functions (EGFs) and the dispersion curves along selected paths were estimated to measure the reliability and stability of the EGFs. Our results display that the EGFs are correlated with the earthquake signals, suggesting the reliability of the EGFs. In addition, we counted the number of dispersion measurements with SNR>10 retrieved from the time-series of different lengths (3—21 months). The result shows that, to obtain enough reliable EGFs for velocity tomography, at least 12 months' data should be used and 12 months’ data can make sure that dispersion curves under 30 s are temporally stable.
-
-
![]()
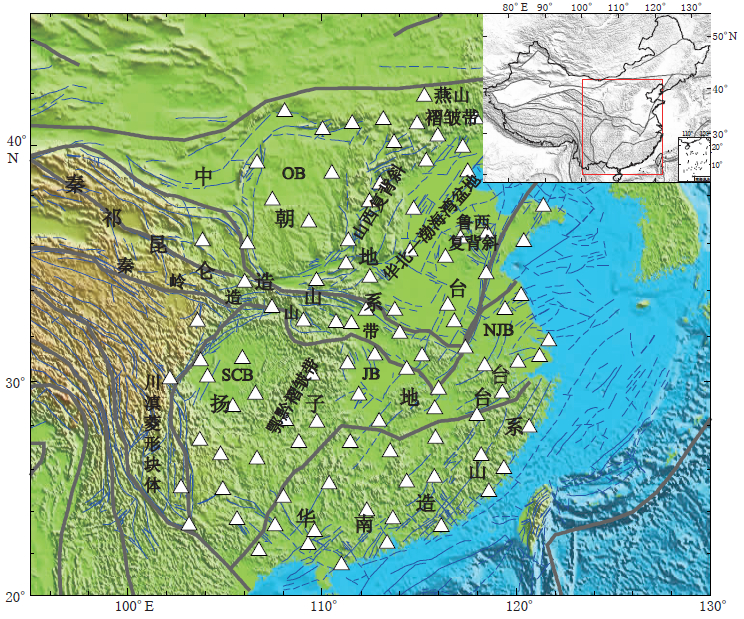
图 1 中国大陆中东部地区主要构造单元及台站分布图
灰色粗线勾勒出主要块体,蓝色细线表示主要断层,白色三角为本研究所使用的国家台网台站 和区域台网台站. OB: 鄂尔多斯盆地; SCB: 四川盆地; JB: 江汉盆地; NJB: 苏北盆地 Gray thick lines mark major blocks,blue thin lines represent major faults and white triangles represent stations of China national and regional networks. OB: Ordos Basin; SCB: Sichuan Basin; JB: Jianghan Basin; NJB: north Jiangsu Basin
Figure 1. Major geological structures and seismic stations in central and eastern China
![]()
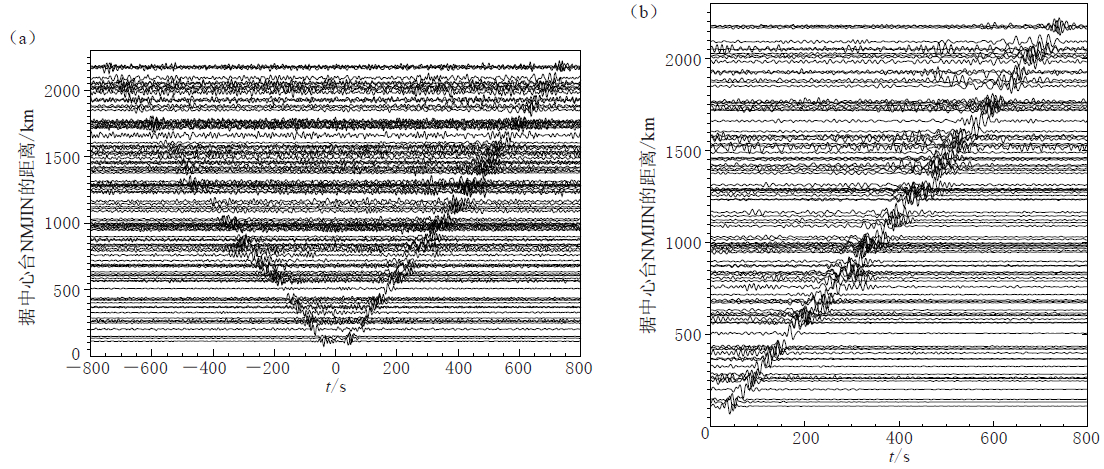
图 2 以NMJIN台为中心的互相关波形(经过10—40 s滤波)
(a) 双向传播的互相关波形; (b) 互相关波形的对称分量 (a) Positive and negative lags of the cross-correlations; (b) Symmetric component of the cross-correlations
Figure 2. Wave cross-correlations between station NMJIN and other stations (band-pass filtering 10—40 s)
![]()
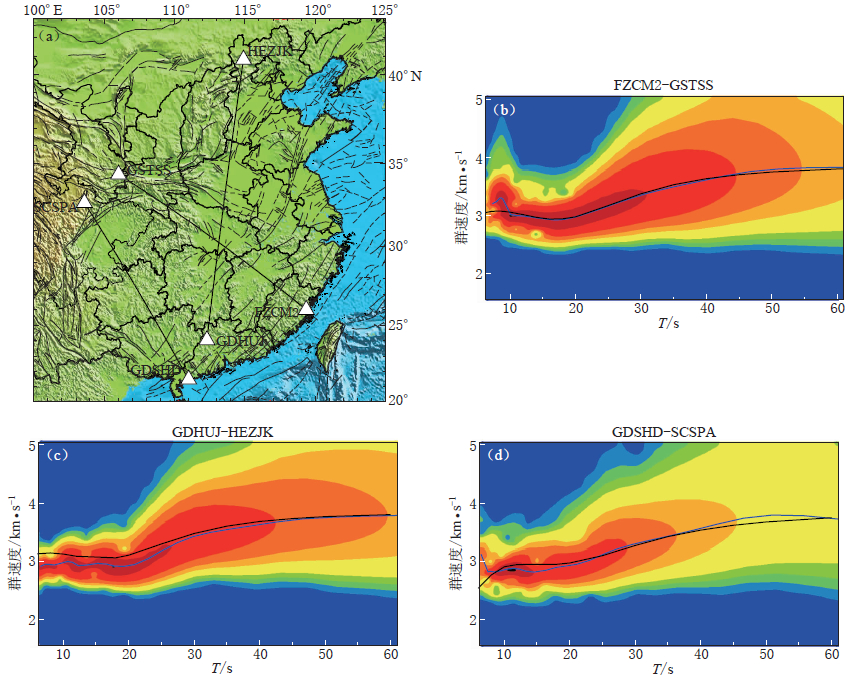
图 3 瑞雷波经验格林函数及频散曲线示意图(图3d引自郑现等,2012)
(a) 与(b),(c),(d)对应的射线路径示意图; (b),(c),(d) 为沿(a)图射线路径由时频分析法提取的瑞雷波群速度频散结果(蓝色曲线)和由全球剪切波速度模型(Shapiro,Ritzwoller,2002)计算的理论值(黑色曲线) (a) Location map for (b),(c),(d) showing the 3 selected ray paths; (b),(c),(d) Rayleigh wave dispersion measurement (blue curve) retrieved by frequency-time analysis and the prediction caculate(black curve) from the 3-D global shear velocity model(Shapiro,Ritzwoller,2002) along ray paths in (a)
Figure 3. Example of Rayleigh wave EGFs and dispersion measurements (Fig.3b is quoted from Zheng et al,2012)
![]()
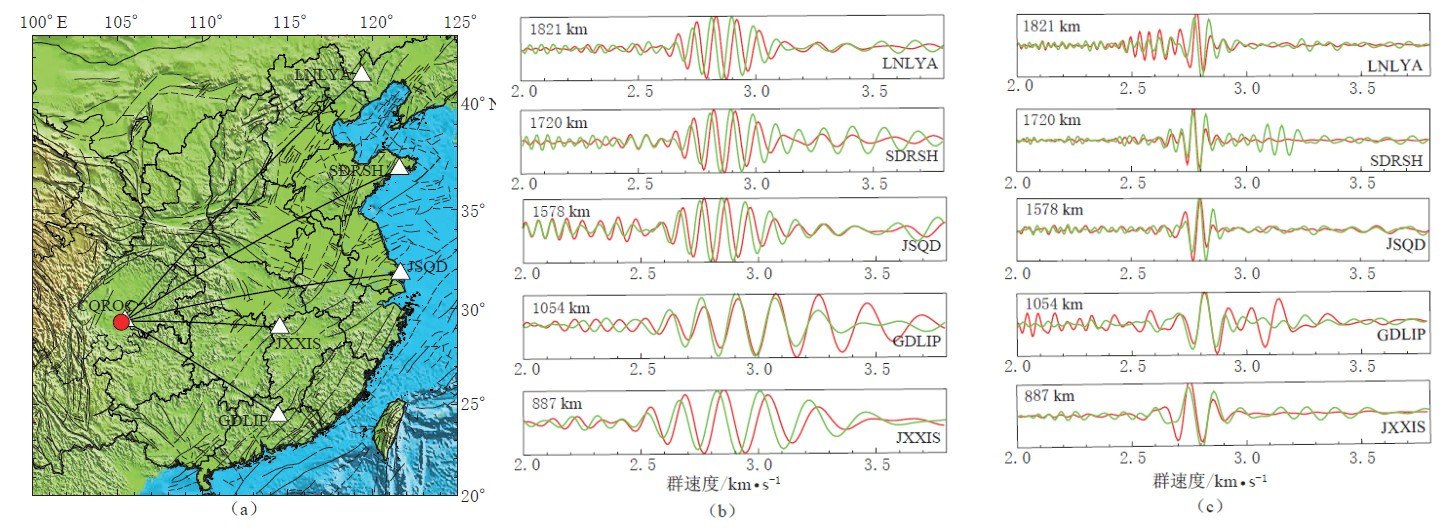
图 4 经验格林函数与地震信号对比图
(a) 荣昌地震(红色圆)和台站CQROC与其它5个台站间的射线路径; (b) 沿图(a)射线路径的经验格林函数(绿色线)与5个台站记录到的地震波形(红色线)的对比结果(以20 s为中心频率滤波),其中左侧数字为震中距,右侧字母为台站代号; (c)与(b)图类似,经过了10—25 s的带通滤波 (a) Location map showing the Rongchang earthquake (red circle) and the paths between station CQROC and five other stations; (b) Comparison between EGFs (green lines) and earthquake seismic records (red lines) along ray paths in (a)(after narrowband filtering centered at 20 s period); (c) Similar to (b),after 10—25 s band-pass filtering
Figure 4. Comparison between EGFs and earthquake seismic records
![]()
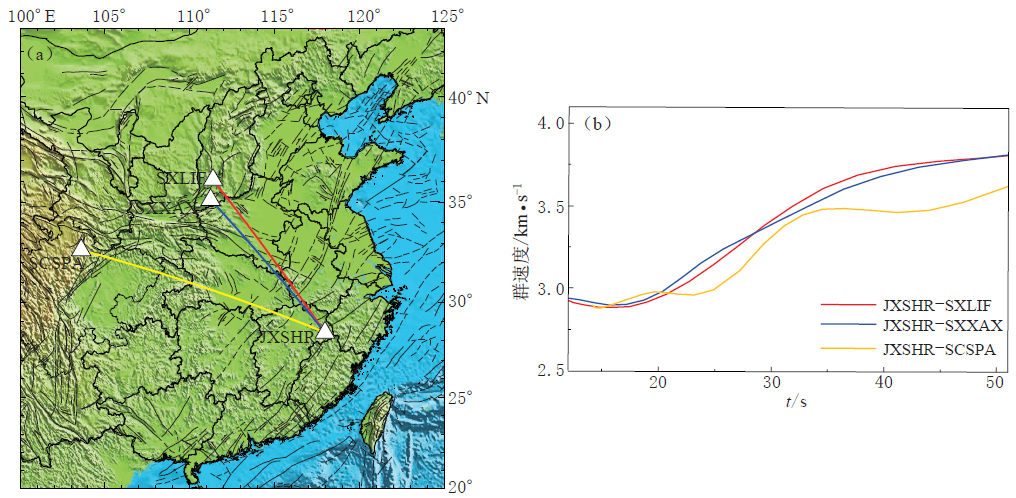
图 5 频散曲线的空间连续性实验
(a) 实验选取的3组射线路径: JXSHR-SCSPA(长度约1 400 km)、 JXSHR-SXLIF、 JXSHR-SXXAX (长度约1 000 km),其中SXLIF和SXXAX的间距为108 km;(b) 沿(a)图射线路径的频散曲线对比结果 (a) The 3 selected paths: JXSHR-SCSPA (about 1 400 km long),JXSHR-SXLIF,JXSHR-SXXAX (about 1000 km long),where the distance between SXLIF and SXXAX is about 108 km; (b) Comparison of the dispersion curves along the paths in (a)
Figure 5. Example of spatial consistency of dispersion curves
![]()
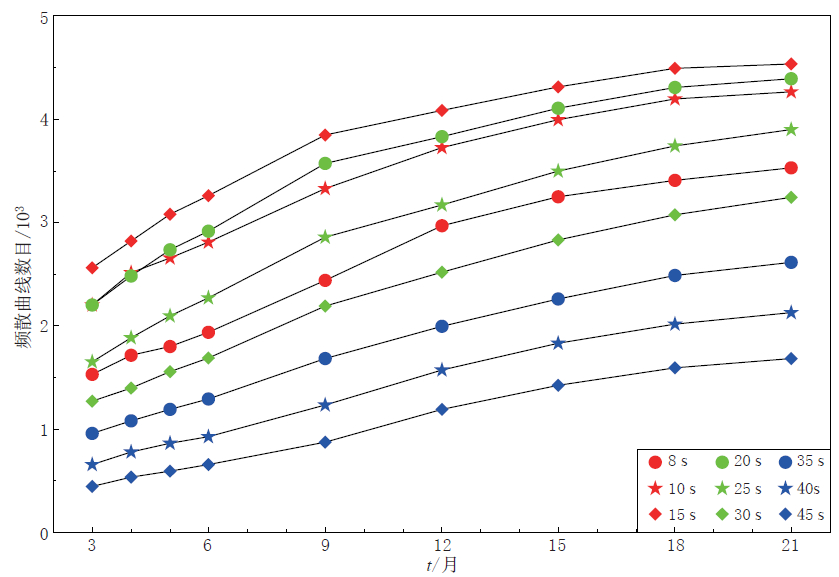
图 6 各周期所使用的频散曲线数目随时间序列长度的分布
Figure 6. Dispersion measurements’ number versus time-series length at different periods
![]()
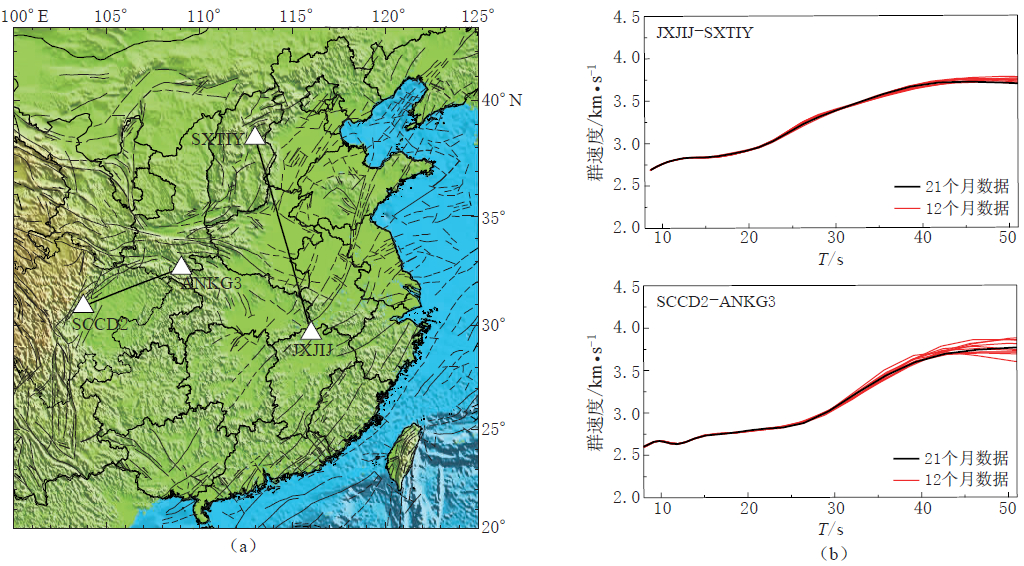
图 7 频散曲线的时间稳定性检测
(a) 实验所选取的两组路径; (b) 对每条路径分别使用10组长度为12个月的数据(红色线)、 21个月的数据(黑色线)互相关叠加计算,得到频散曲线 (a) The 2 selected paths; (b) Dispersion measurements calculated by using 12 months’ data (10 lines,all in red) and 21 months data (black) separately along the paths in (a)
Figure 7. Example of temporal consistency of dispersion curves
-
李昱, 姚华健, 刘启元, 陈九辉, van der Hilst R D, 李顺成, 黄慧, 郭飚, 王峻, 齐少华. 2010. 川西地区台阵环境噪声瑞利波相速度层析成像[J]. 地球物理学报, 53(4): 842-852. 刘志坤, 黄金莉. 2010. 利用背景噪声互相关研究汶川地震震源区地震波速度变化[J]. 地球物理学报, 53(4): 853-863. 赵盼盼. 2011. 汶川地震区地壳速度相对变化的地震环境噪声自相关研究[D]. 北京: 中国地震局地质研究所: 1-50. 郑秀芬, 欧阳飚, 张东宁, 姚志祥, 梁建宏, 郑洁. 2009. "国家数字测震台网数据备份中心"技术系统建设及其对汶川大地震研究的数据支撑[J]. 地球物理学报, 52(5): 1412-1417. 郑现, 赵翠萍, 周连庆, 郑斯华. 2012. 中国大陆中东部地区基于背景噪声的瑞利波层析成像[J]. 地球物理学报, 55(6): 1919-1928. Bensen G B, Ritzwoller M H, Barmin M P, Levshin A L, Lin F, Moschetti M P, Shapiro N M, Yang Y. 2007. Processing seismic ambient noise data to obtain reliable broad-band surface wave dispersion measurements[J]. Geophys J Int, 169(3): 1239-1260.
Bensen G B, Ritzwoller M H, Shapiro N M. 2008. Broadband ambient noise surface wave tomography across the United States[J]. J Geophys Res, 113(B5306): 1-21.
Brenguier F N, Shapiro N M, Campillo M, Ferrazzini V, Duputel Z, Coutant O, Nercessian A. 2008a. Towards forescasting volcanic eruptions using seismic noise[J]. Nat Geosci, 1(2): 126-130.
Brenguier F N, Campillo M, Hadziioannou C, Shapiro N M, Nadeau R M, Larose E. 2008b. Postseismic relaxation along the San Andreas Fault at Parkfield from continuous seismological observations[J]. Science, 321(5895): 1478.
Campillo M, Paul A. 2003. Long-range correlations in the diffuse seismic coda[J]. Science, 299(5606): 547-549.
Chen J H, Froment B, Liu Q Y, Campillo M. 2010. Distribution of seismic wave speed changes associated with the 12 May 2008 MW7.9 Wenchuan earthquake[J]. Geophys Res Lett, 37(18): L18302, doi:10.1029/2010GL044582.
Fang L H, Wu J P, Ding Z F, Panza G F. 2010. High resolution Rayleigh wave group velocity tomography in North China from ambient seismic noise[J]. Geophys J Int, 181(2): 1171-1182.
Kang T S, Shin J S. 2006. Surface-wave tomography from ambient seismic noise of accelerograph networks in southern Korea[J]. Geophys Res Lett, 33(L17303): 1-5.
Levshin A L, Ritzwoller M H. 2001. Automated detection, extraction, and measurement of regional surface waves[J]. Pure Appl Geophys, 158(8): 1531-1545.
Li H, Su W, Wang C, Huang Z. 2009. Ambient noise Rayleigh wave tomography in western Sichuan and eastern Tibet[J]. Earth Planet Sci Lett, 282(1-4): 201-211.
Lin F, Ritzwoller M H, Townend J, Bannister S, Savage M K. 2007. Ambient noise Rayleigh wave tomography of New Zealand[J]. Geophys J Int, 170(2): 649-666.
Lin F, Moschetti M P, Ritzwoller M H. 2008. Surface wave tomography of the western United States from ambient seismic noise: Rayleigh and Love wave phase velocity maps[J]. Geophys J Int, 173(1): 281-298.
Lobkis O I, Weave R L. 2001. On the emergence of the Green's function in the correlations of a diffuse field[J]. J Acoust Soc Amer, 110(6): 3011-3017.
Nishida K, Montagner J P, Hitoshi K. 2009. Global surface wave tomography using seismic hum[J]. Science, 326(5949): 112.
Shapiro N M, Ritzwoller M H. 2002. Monte-Carlo inversion for a global shear-velocity model of the crust and upper mantle[J]. Geophys J Int, 151(1): 88-105.
Shapiro N M, Campillo M. 2004. Emergence of broadband Rayleigh waves from correlations of the ambient seismic noise[J]. Geophys Res Lett, 31(7): 1-5.
Shapiro N M, Campillo M, Stehly L, Ritzwoller M H. 2005. High-resolution surface-wave tomography from ambient seismic noise[J]. Science, 305(5681): 233-236.
Sun X L, Song X D, Zheng S H, Yang Y J, Ritzwoller M H. 2010. Three dimensional shear wave velocity structure of the crust and upper mantle beneath China from ambient noise surface wave tomography[J]. Earthq Sci, 23(5): 449-463.
Weaver R L, Lobkis O I. 2001. Ultrasonics without a source Thermal fluctuation correlations at MHz frequencies[J]. Phys Rev Lett, 87(13): 134301.
Wegler U, Sens-Schonfelder C. 2007. Fault zone monitoring with passive image interferometry[J]. Geophys J Int, 168(3): 1029-1033.
Xu Z J, Song X D. 2009. Temporal changes of surface wave velocity associated with major Sumatra earthquakes from ambient noise correlation[J]. Proc Natl Acad Sci USA, 106(34): 14207-14212, doi:10.1073/pnas.0901164106.
Yang Y, Ritzwoller M H, Levshin A L, Shapiro N M. 2007. Ambient noise Rayleigh wave tomography across Europe[J]. Geophys J Int, 168(1): 259-274.
Yao H J, van der Hilst R D, de Hoop M V. 2006. Surface-wave array tomography in SE Tibet from ambient seismic noise and two-station analysis-I. Phase velocity maps[J]. Geophys J Int, 166(2): 732-744.
Zheng S, Sun X, Song X, Yang Y, Ritzwoller M H. 2008. Surface wave tomography of China from ambient seismic[J]. Geochem Geophys Geosyst, 9(5): 1525-2027.
Zheng Y, Yang Y, Ritzwoller M H, Zheng X, Xiong X, Li Z. 2010. Crustal structure of the northeastern Tibetan plateau, the Ordos block and the Sichuan basin from ambient noise tomography[J]. Earthq Sci, 23(5): 465-476.
 下载:
下载:
计量
- 文章访问数: 642
- HTML全文浏览量: 224
- PDF下载量: 22
