

Predictability test for pattern information method by two MS7.3 Yutian, Xinjiang, earthquakes
-
摘要: 以青藏构造块体为研究区域, 采用以往利用图像信息方法预测M7.0地震得到的较好的计算参数(网格尺度为1平方度, 预测时间窗口为8年), 系统计算了青藏构造块体1993年以来的“地震热点”图像, 特别研究了两次于田MS7.3地震前后的图像信息演化过程, 并通过ROC方法和R值评分方法检验, 对图像信息方法在该地区的预测效能进行评价. 结果表明: ① 2008年3月21日于田MS7.3地震和2014年2月12日于田MS7.3地震均发生在地震热点上, 且发生在平均发震概率随时间变化的峰值点年份. ② 在回溯性检验的时间段内青藏构造块体共发生9次M≥7.0地震, 其中6次地震前震中附近均有稳定的地震热点出现, 包括两次于田MS7.3地震. 1996年喀喇昆仑山口MS7.1地震及2008年汶川MS8.0地震只在个别预测时间窗内出现地震热点, 并没有出现稳定的地震热点演化过程, 而1996年丽江地震发生前震中附近则没有出现地震热点. 该结果与前人研究结果存在差异, 值得进一步研究. ③ ROC检验和R值评分结果均显示图像信息方法在本文采用的模型参数下对大地震具有较好的中长期预测效果. 本文还根据目前存在的地震热点给出了青藏高原块体2014年以后M7.0地震发生概率高的3个可能地区.
-
关键词:
- 图像信息方法 /
- 地震热点 /
- 新疆于田MS7.3地震 /
- 青藏构造块体 /
- 地震可预测性
Abstract: In this paper, the Qinghai-Tibet tectonic block was chosen to be the study region, and calculating parameters with grid of 1°×1° were employed according to the previous studies by pattern informatics (PI) method for M7.0 earthquake prediction. Hotspot diagrams of each prediction window since 1993 have been obtained, and the relationship between the hotspots and the M>7.0 earthquakes during the prediction windows were studied. The predictability of PI method was tested by verification of receiver-operating characteristic (ROC) curve and R score. The results show that: ① Both of the Yutian MS7.3 earthquakes in 2008 and in 2014 occurred in the region with the hotspots in the year with the highest average possibility. ② Nine earthquakes of M≥7.0 occurred in the retrospective studied period since 1993. Six of the nine earthquakes could be predicted by the successive obvious hotspots imagine, including the two Yutian MS7.3 earthquakes; two of the nine earthquakes might be predicted because hotspots only occurred in a single predicted window without successive evolution process, including the Karakorum Pass MS7.1 earthquake in 1996 and the Wenchuan MS8.1 earthquake in 2008; one of the nine earthquakes, i.e., Lijiang, Yunnan, MS7.0 earthquake in 1996, could not be predicted because no hotspots appeared before the earthquake. The results associated with Wenchuan MS8.0 earthquake in this paper are different from those of the previous studies, which may be caused by the differentce in selected study region and calculating parameters. ③ Test results of the predictability of PI method by ROC and R score show that positive prospect of PI method could be expected for long-term earthquake prediction. According to the calculating results based on the parameters from this study, three regions with high possibility for potential M7.0 earthquake risk in the future were given. -
-
![]()
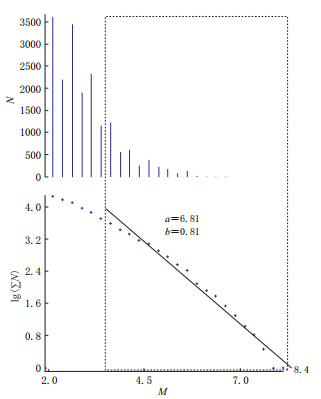
图 1 青藏高原地区地震目录G-R关系图
Figure 1. Completeness of catalogue test by G-R relation in Qinghai-Xizang(Tibet)region
![]()
图 2 不同预测时间窗口的PI地震热点演化图(a-f)小色块为计算所得热点,阈值lg(ΔP/ΔPmax)取-0.6,空心圈表示在相应预测时段内该地区发生的M>7.0地震
Figure 2. The PI anomalies in different periods(a-f)The colored boxes represent the calculated hotspots under the threshold possibility lg(ΔP/ΔPmax)is taken as -0.6. Circles represent the M>7.0 earthquakes in different prediction period
![]()
图 5 不同预测时间窗口的PI地震热点演化图(g-p)小色块为计算所得热点,阈值lg(ΔP/ΔPmax)取-0.6,空心圈表示在相应预测时段内该地区发生的M>7.0地震
Figure 5. The PI anomalies in different periods(g-p)The colored boxes represent the calculated hotspots under the threshold possibility lg(ΔP/ΔPmax)is taken as -0.6. Circles represent the M>7.0 earthquakes in different prediction period
![]()
图 6 不同预测时间窗口的PI地震热点演化图(q-v)小色块为计算所得热点,阈值lg(ΔP/ΔPmax)取-0.6,空心圈表示在相应预测时段内该地区发生的M>7.0地震
Figure 6. The PI anomalies in different periods(q-v)The colored boxes represent the calculated hotspots under the threshold possibility lg(ΔP/ΔPmax)is taken as -0.6. Circles represent the M>7.0 earthquakes in different prediction period
![]()
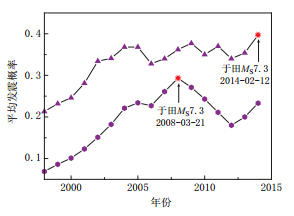
图 3 2008年于田MS7.3地震(实心圆连线)和2014年2月12日于田MS7.3地震(三角 形连线)的平均发震概率随时间的变化
Figure 3. Variation of the average seismogenic probability for the 2008 Yutian MS7.3(solid circle curve) and 2014 Yutian MS7.3(solid triangle curve)earthquakes with time
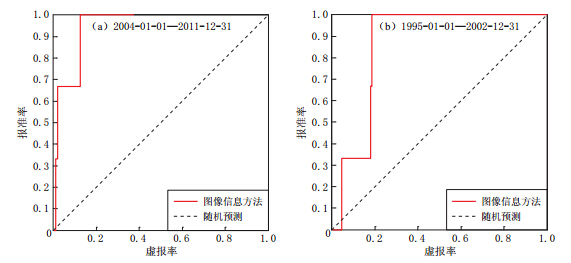
表 2 不同预测时间窗下PI方法的R值评分和Ef值
Table 2 R score and Ef values for different predict windows by PI method
序号 预测时间窗 R值评分 Ef 1 1993-01-01—2000-12-31 -0.06 0.36 2 1994-01-01—2001-12-31 0.16 0.39 3 1995-01-01—2002-12-31 0.14 0.32 4 1996-01-01—2003-12-31 0.56 0.43 5 1997-01-01—2004-12-31 0.83 0.44 6 1998-01-01—2005-12-31 0.85 0.35 7 1999-01-01—2006-12-31 0.85 0.42 8 2000-01-01—2007-12-31 0.86 0.42 9 2001-01-01—2008-12-31 0.26 0.43 10 2002-01-01—2009-12-31 0.38 0.39 11 2003-01-01—2010-12-31 0.26 0.39 12 2004-01-01—2011-12-31 0.56 0.46 13 2005-01-01—2012-12-31 0.55 0.43 14 2006-01-01—2013-12-31 0.42 0.42  下载: 导出CSV
-
张小涛. 2009. 图像信息(PI)方法在我国大陆部分地区的应用研究[D]. 北京: 中国地震局地震预测研究所: 1-64. Zhang X T. 2009. Study on Pattern Informatics Method to Apply on Some Regions of China[D]. Beijing: Institute of Earthquake Science, China Earthquake Administration: 1-64 (in Chinese).
Wolfram S. 2002. A New Kind of Science[M]. Champaign, IL: Wolfram Media, Inc, 1197pp.
Xu S X. 1989. Mark evaluation for earthquake prediction efficacy[G]//Collected Papers of Research on Practical Methods of Earthquake Prediction: Volume of Seismology. Beijing: Academic Books and Periodical Press: 586-590 (in Chinese).


计量
- 文章访问数: 571
- HTML全文浏览量: 228
- PDF下载量: 8
