

Relationship between gravity variation and seismic hazards in the western China
-
摘要: 本文基于中国大陆西部流动重力测量获得的区域重力场变化数据, 尝试对其进行多种位场变换, 在一定空间尺度约束下定义了6种区域重力场变化指标量. 在此基础上, 以中国大陆2002年、 2005年和2008年等3期数据为研究对象, 计算并统计了中国大陆西部MS≥6.0地震震中位置处震前重力场变化及各种导出参数值, 尝试初步构建以地震预报为目的的地震重力学科指标体系参数. 研究结果表明, 震前区域重力场变化与地震发生位置没有显著的统计关系, 但是重力场变化的垂直梯度和解析信号模量具有一定的地震预报意义, 适合作为地震前兆异常使用.Abstract: In this paper, based on the regional gravity field variation derived from the mobile gravity observed data in the western China, we have got the six sorts of gravity variations at each space-fixed cell by means of the potential field transform. On the basis of the six types of variations, taking the three-issue gravity data in the years 2002, 2005, 2008 as study objects, we computed and analyzed the relationships between the MS≥6.0 earthquake and the gravity variation with the derived parameters, so that we could try to establish the index system for the purpose of the earthquake forecast. Our study results show that there is no significant relationship between the gravity variation and epicentral location before earthquakes. However, the amplitude of analytic signal and vertical gradient of gravity variation are related to the location of earthquakes happened in future, which can be used for the prediction of the earthquake location as earthquake precursory anomalies.
-
Keywords:
- mobile gravity /
- gravity variation /
- earthquake forecast /
- index system /
- potential field transform
-
-
![]()
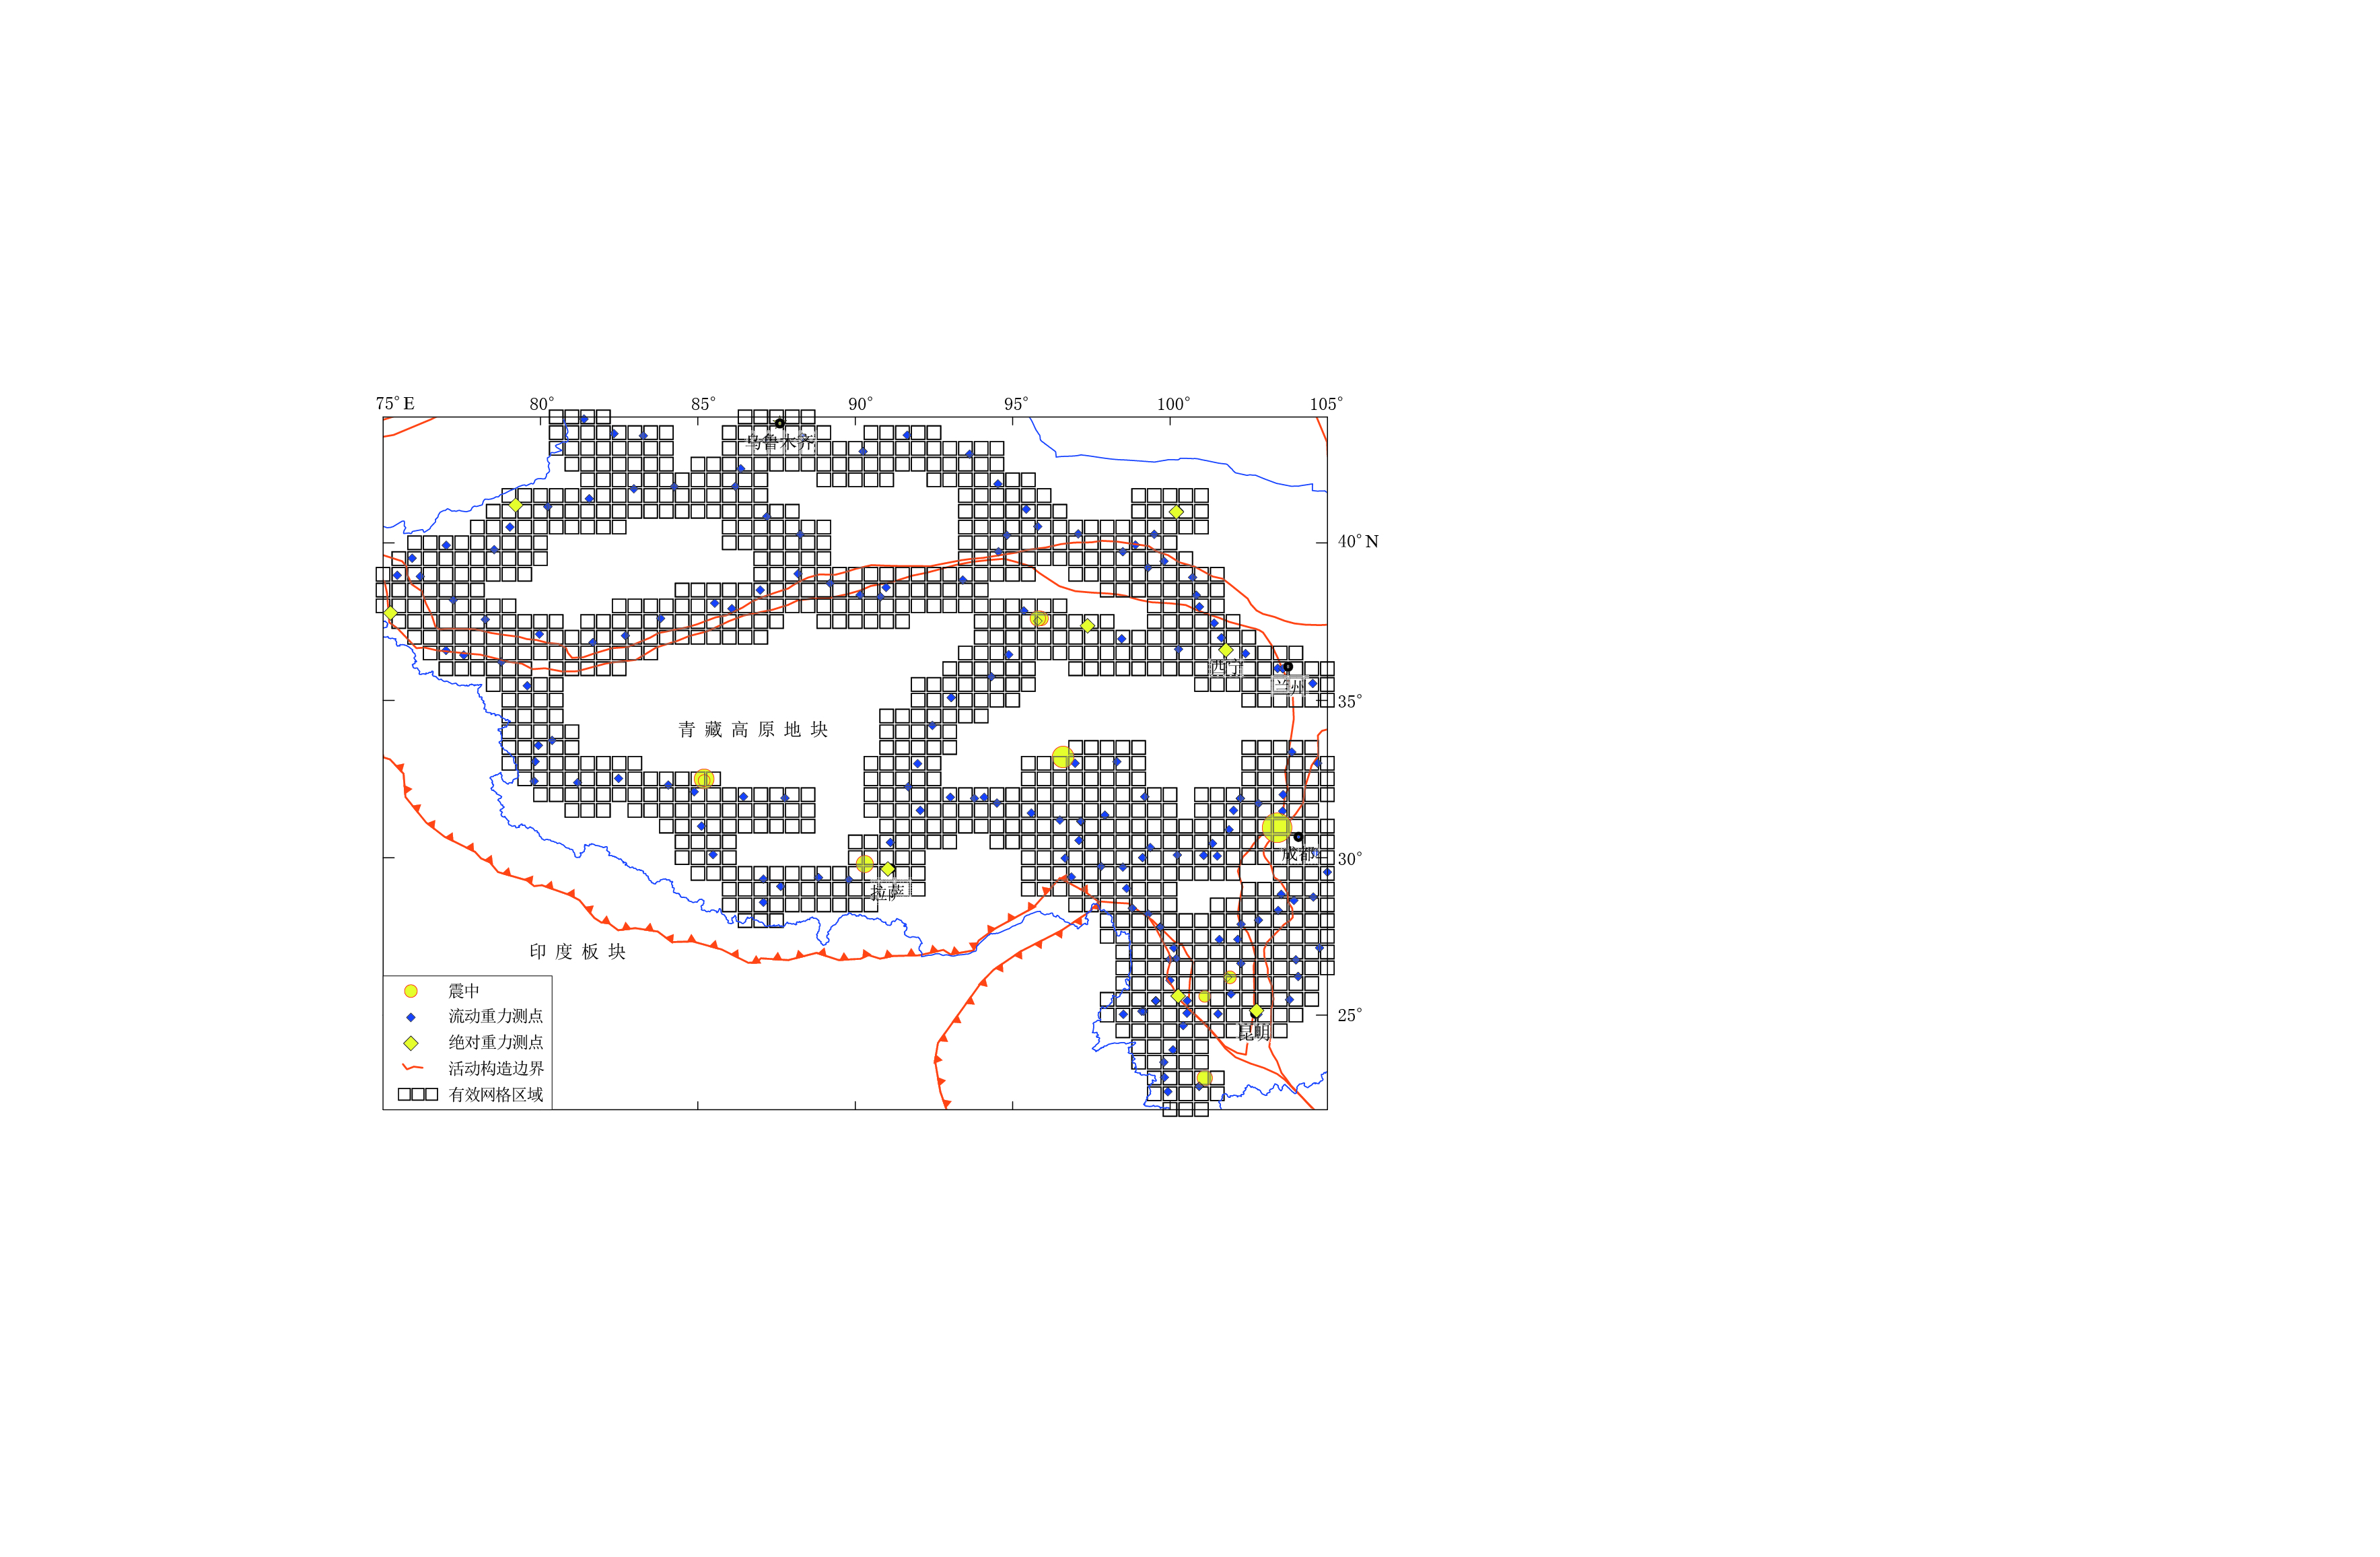
图 1 中国大陆西部构造背景和地震震中分布
图中黑色实线为活动断裂, 黄色圆圈为所研究地震事件的震中位置. 左下角图中 橙色实线为活动地块构造边界, 蓝色实线为研究区域位置; WCB表示西域 地块; TPB表示青藏高原地块; SCB表示华南地块
Figure 1. The tectonic setting and earthquakes in the western China
The black solid lines represent active faults; and the yellow circles are the epicenters of earthquakes used in this paper. In the sub-figure of lower-left corner, the orange solid lines delineate the boundaries of active blocks, and the blue solid lines mark the studied area in this paper. WCB: western China block; TPB: Tibetan Plateau block; SCB: South China block
![]()
图 2 中国大陆西部流动重力测网和研究区网格定义
The orange solid lines delineate the boundaries of active blocks. The black solid squares represent the effective cells. The blue squares represent the mobile gravity stations; the yellow squares show the absolute gravity stations; the yellow circles are the epicenters of earthquakes
Figure 2. The mobile gravity stations and effective cells in the western China
![]()
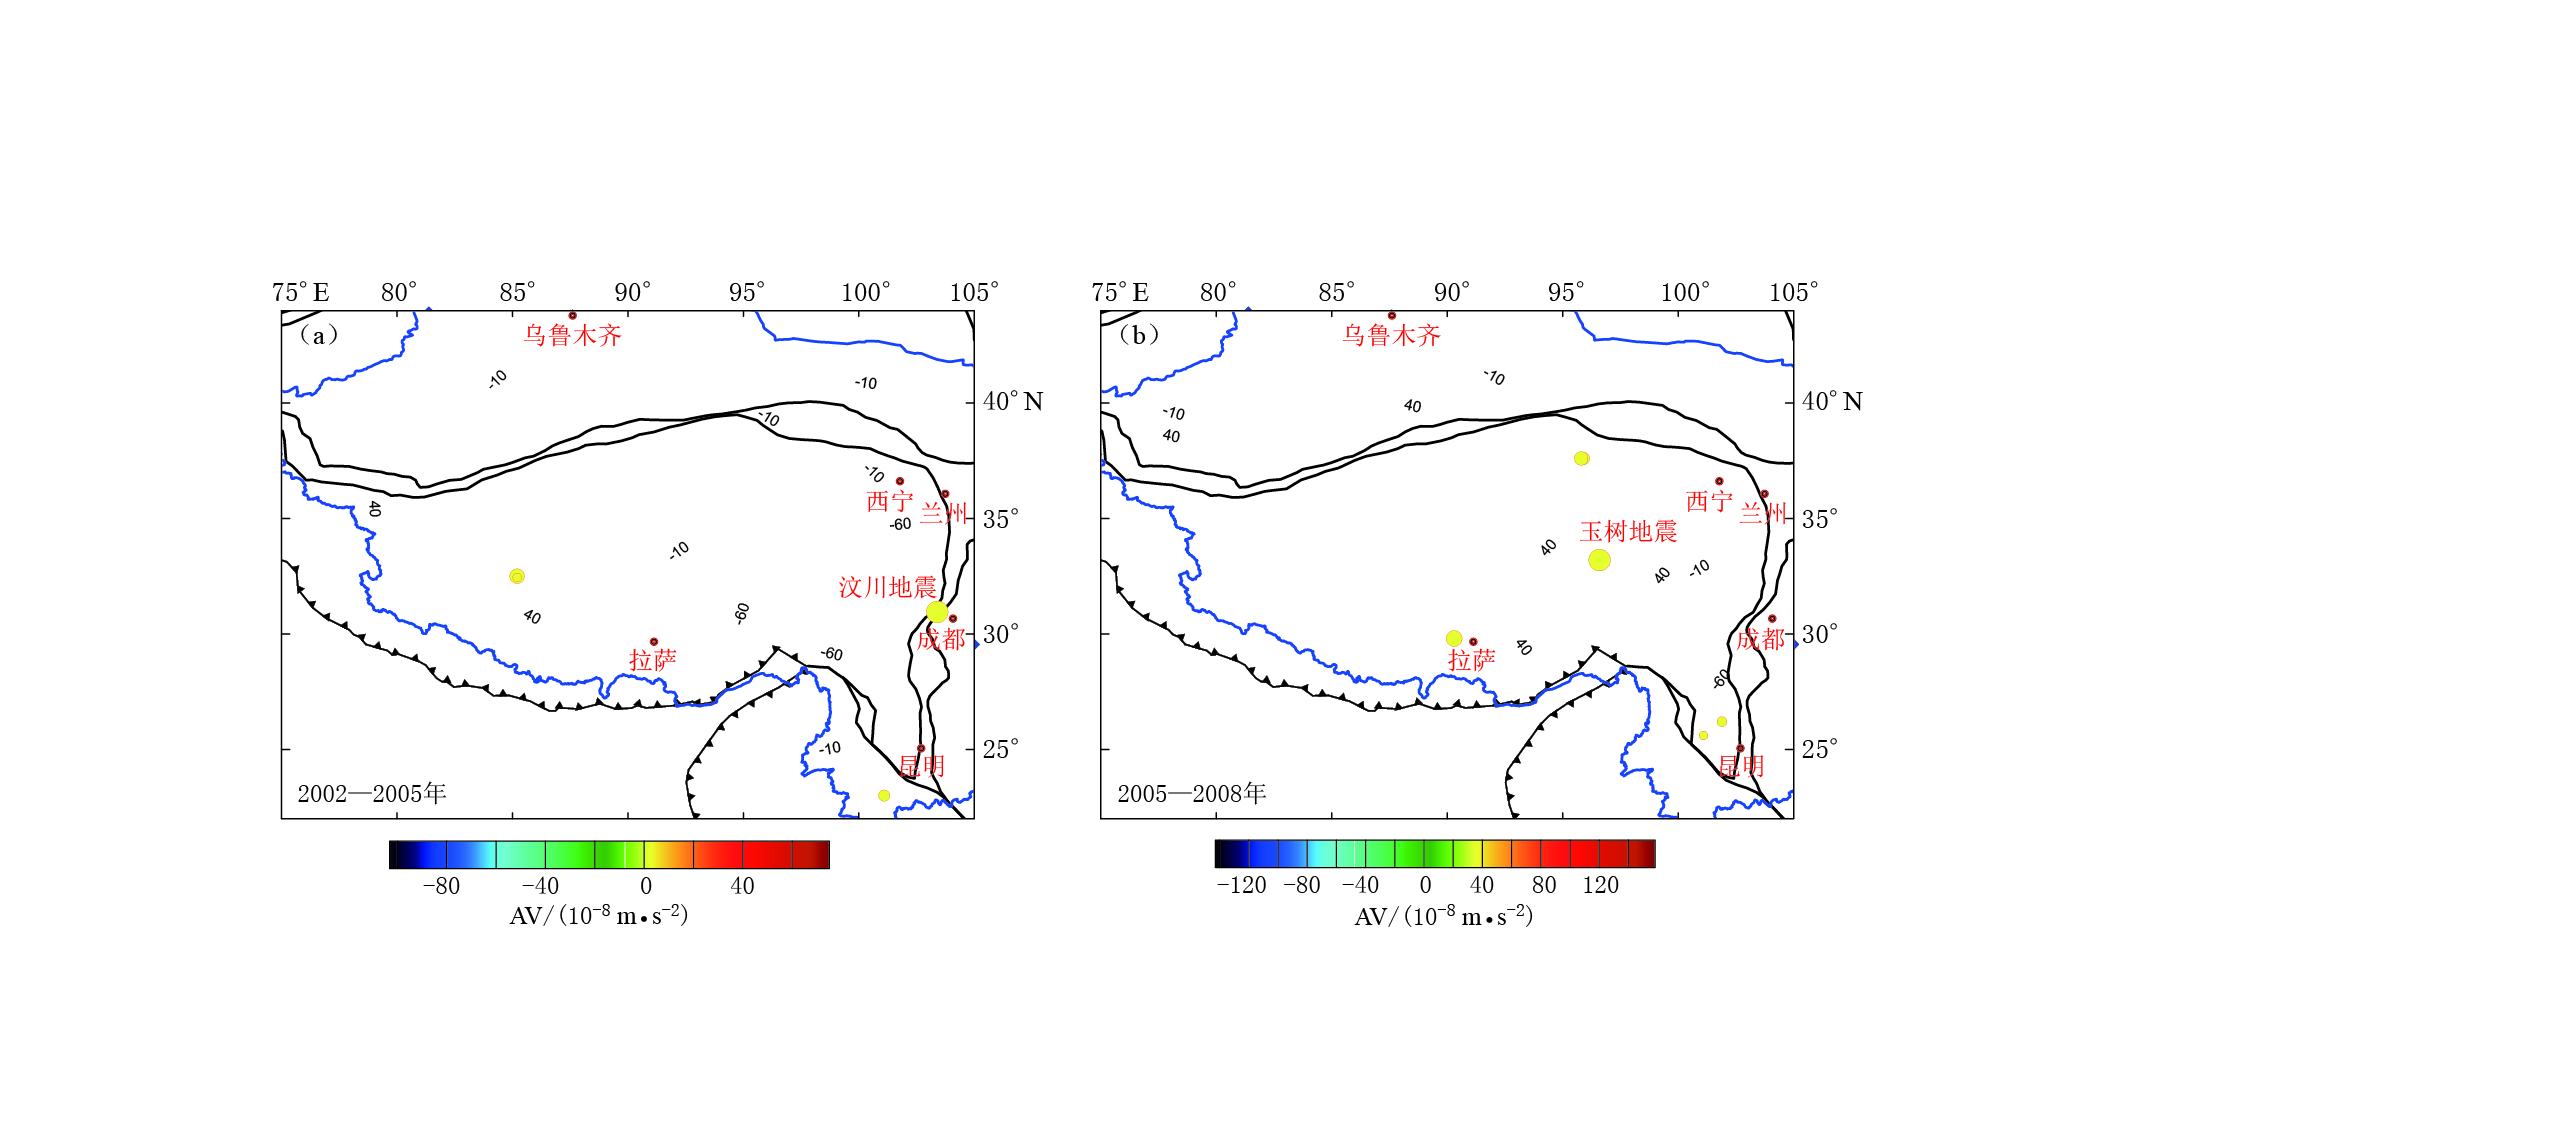
图 3 2002—2005年(a)和2005—2008年(b)中国大陆西部区域重力场变化特征
Figure 3. The gravity changes of the western China in the periods of 2002—2005 (a) and 2005—2008 (b)
![]()
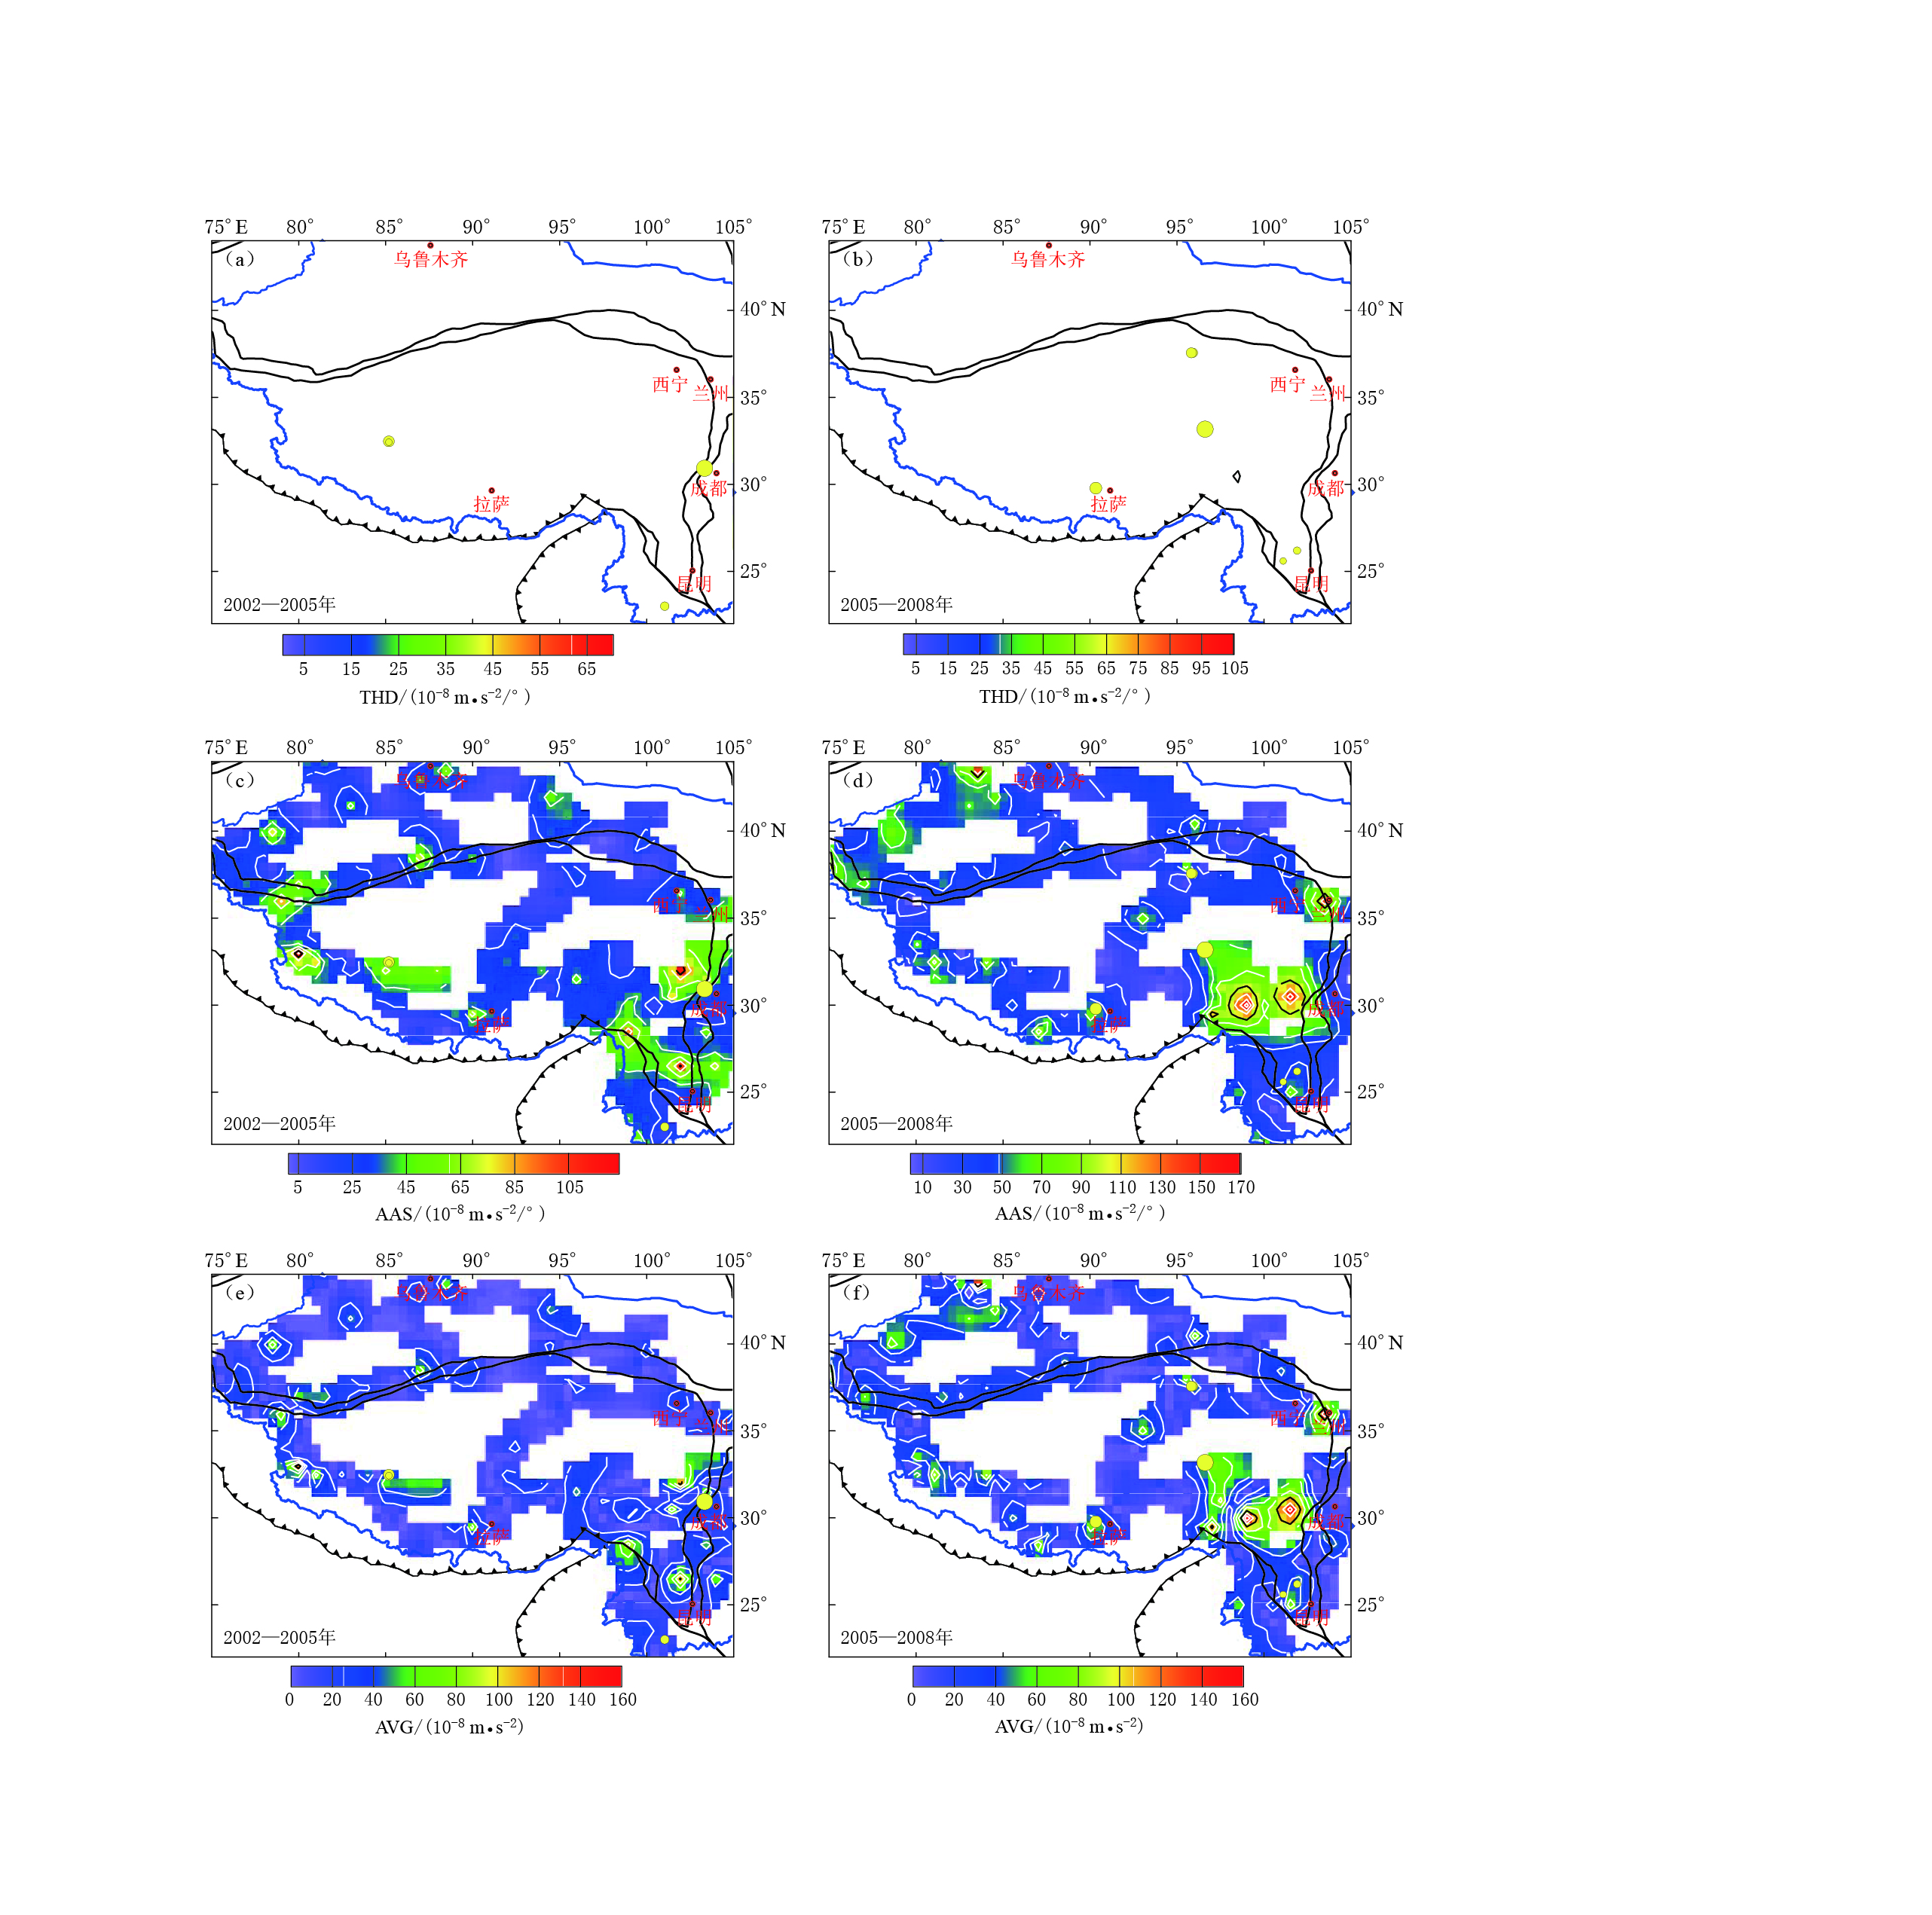
图 4 区域重力场变化的转换梯度量特征
图(a)、 (c)和(e)分别为 2002—2005年重力场变化THD图像、 AAS图像和AVG图像; 图(b)、 (d)和 (f)分别为2005—2008年重力场变化THD图像、 AAS图像和AVG图像
Figure 4. The transformed signals of regional gravity field changes
Figs. (a), (c) and (e) give the THD, AAS and AVG signals of gravity field changes from the year 2002 to 2005, respectively; Figs. (b), (d) and (f) give those from the year 2005 to 2008
![]()
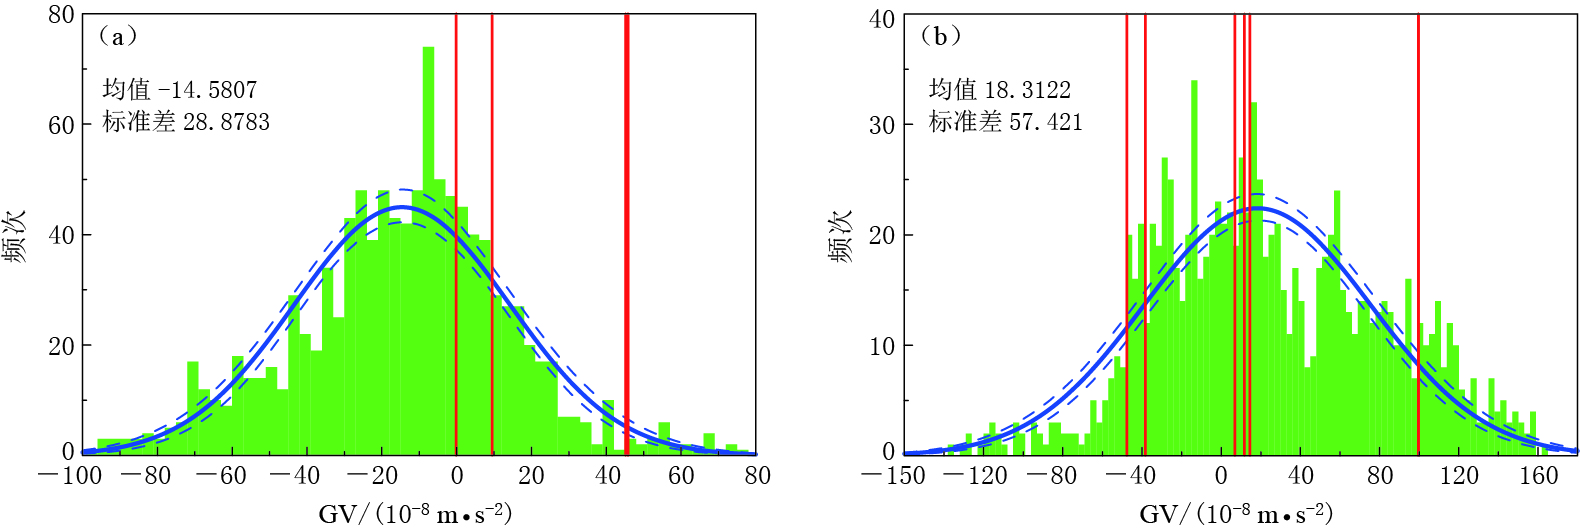
图 5 2002—2005年(a)和2005—2008年(b)区域重力场变化的统计特征
红色实线为地震震中位置的统计指标量, 蓝色实线为正态分布拟合曲线, 蓝色虚线为95%置信区间范围
Figure 5. The statistical signatures of regional gravity field changes from 2002 to 2005 (a) and from 2005 to 2008 (b)
The red solid lines are the cell values at the epicenter, the blue solid lines are the fitting results of normal distribution, and the blue dotted lines are the 95% confidence interval
![]()
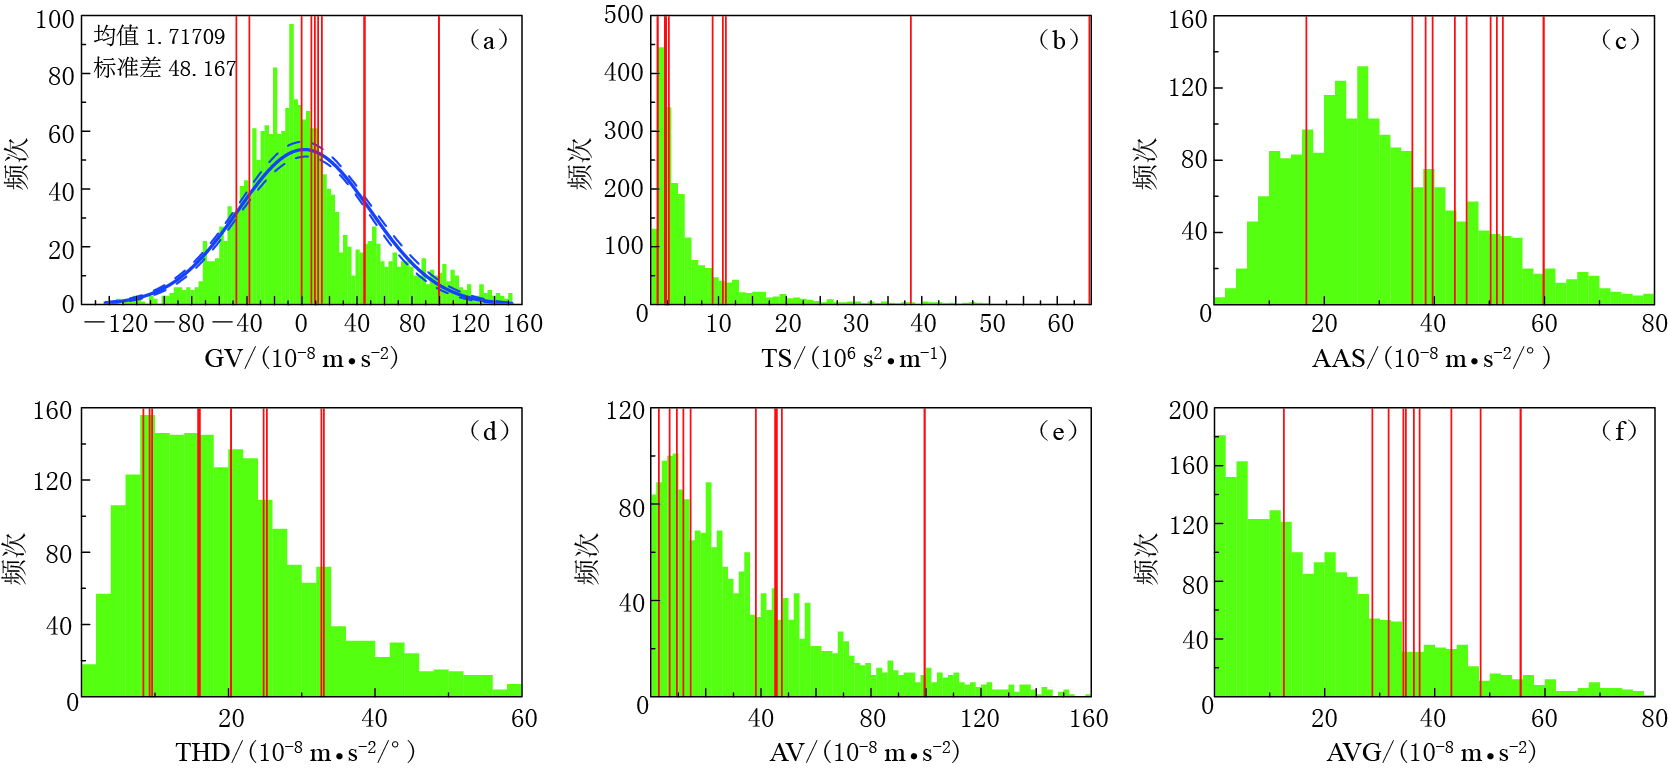
图 6 区域重力场变化转换参数的统计特征
红色实线为地震震中位置的统计指标量, 蓝色实线为正态分布拟合曲线, 蓝色虚线为95%置信区间范围 (a) 综合重力场变化(GV)统计结果; (b) 综合重力场变化绝对值倒数(TS)统计结果; (c) 综合重力场变化 解析信号模量(AAS)统计结果; (d) 综合重力场变化水平总梯度量(THD)统计结果; (e) 综合重力场变化 绝对值(AV)统计结果; (f) 综合重力场变化垂向一阶导数模(AVG)统计结果
Figure 6. The statistical signatures of transformed signals of regional gravity changes
The red solid lines are the cell values at the epicenter, the blue solid lines are the fitting result of normal distribution, and the blue dotted lines are the 95% confidence interval (a) Statistical result on the combined gravity variations (GV); (b) Statistical result on the transformed signal (TS) of combined gravity variations; (c) Statistical result on the amplitude of analytic signal (AAS) of combined gravity variations; (d) Statistical result on the total horizontal derivative (THD) of combined gravity variations; (e) Statistical result on the absolute value (AV) of combined gravity variations; (f) Statistical result on the amplitude of vertical gradient (AVG) of combined gravity variations
表 1 中国大陆西部2007-2010年MS≥6.0地震一览表
Table 1 Earthquakes with MS≥6.0 in the western China from 2007 to 2010
序号 发震时间 地点 Ms GV/(10-8m·s-2) AAS/(10-8m·s-2/° THD/(10-8m·s-2/°) 发震位置 1 2007-06-03 101.10 23.00 6.4 9.47 16.75 8.42 云南普洱 2 2008-01-09 85.20 32.50 6.9 45.19 50.25 33.02 西藏改则 3 2008-01-16 85.20 32.45 6.0 45.82 51.36 32.69 西藏改则 4 2008-05-12 103.40 30.95 8.0 -0.11 43.75 24.81 四川汶川 5 2008-08-30 101.90 26.20 6.1 -47.66 45.85 15.88 四川攀枝花 6 2008-10-06 90.30 29.80 6.6 6.86 52.47 16.11 西藏当雄 7 2008-11-10 95.90 37.60 6.3 11.79 38.42 9.60 青海海西 8 2009-07-09 101.10 25.60 6.0 -38.23 39.68 25.23 云南姚安 9 2009-08-28 95.80 37.60 6.4 14.48 36.00 9.28 青海海西 10 2010-04-14 96.60 33.20 7.1 99.53 59.85 20.36 青海玉树 11 2010-04-14 96.60 33.20 6.3 99.53 59.85 20.36 青海玉树 注: GV表示重力场变化, AAS表示重力变化解析信号模量, THD表示重力变化水平总梯度.  下载: 导出CSV
-
Cordell L, Grauch V J S. 1985. Mapping basement magnetization zones from aeromagnetic data in the San Juan Basin, New Mexico[G]//The Utility of Regional Gravity and Magnetic Anomaly Maps. Tulsa: Soc Explor Geophys: 181-197.
Phillips J D, Duval J S, Saltus R W. 2003. Geosoft Executables (GXs) Developed by the U.S. Geological Survey, version 1.0, With a Viewgraph Tutorial on GX Development[R]. U. S. Geological Survey Open-File Report 03-010: 1-21.
Reid A B. 1995. Euler deconvolution: Past, present and future, a review[C]//65th Ann Internat Mtng, Soc Expl Geophys, Expanded Abstracts. Houston: Society of Exploration Geophysicists: 272-273.
Scholz C H. 2002. The Mechanics of Earthquakes and Faulting[M]. 2nd ed. New York: Cambridge University Press: 325-327.

计量
- 文章访问数: 623
- HTML全文浏览量: 246
- PDF下载量: 37
