

Discussion on shear-wave splitting of the June 24, 2012 Ninglang-Yanyuan MS5.7 earthquake
-
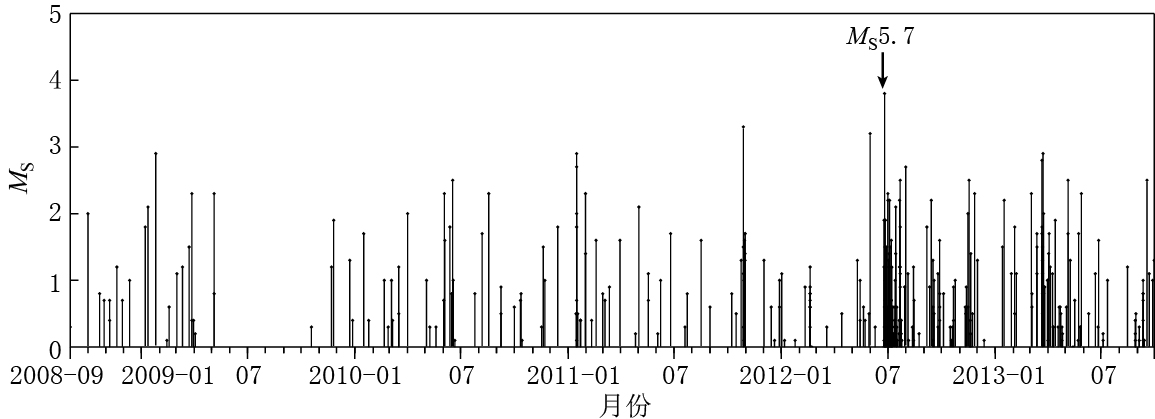
摘要: 选用2012年6月24日宁蒗-盐源MS5.7地震震源区的泸沽湖台站2008年9月—2013年9月连续5年的地震数据进行剪切波分裂计算, 从剪切波分裂参数随时间的变化初步获得了宁蒗-盐源地区的区域应力特征, 以及该地震发生前后地壳应力的特征性变化. 泸沽湖台站快波偏振方向结果显示, 该台站具有NE向和SE向两个优势取向, 与研究区域内断裂的走向相同. 该台站的慢波延迟时间表现出明显的变化, 特别是在宁蒗-盐源MS5.7地震发生前后. 在宁蒗-盐源地震发生前一年, 泸沽湖台站的慢波延迟时间缓慢地增加, 表明该地区地壳应力逐渐积累; 直到该地震发生前一个月, 泸沽湖台站的慢波延迟时间才开始急剧下降, 表明地壳应力随着地震的发生而迅速释放.Abstract: On June 24 2012, an earthquake with MS5.7 happened in the junction of Ninglang in Yunnan Province and Yanyuan in Sichuan Province. This paper chose the seismic data recorded by the station LGH from September 2008 to September 2013 to analyze shear-wave splitting of the Ninglang-Yanyuan MS5.7 earthquake. The regional stress characteristics and the stress changes before and after the earthquake are obtained preliminarily from the change of shear-wave splitting parameters with time. The polarization results of fast shear-wave at the station LGH show that there are two polarization directions, i.e., NE and SE, which are consistent with the strike of the faults in the studied area. There is a visible change in the delay time of slow shear-wave during the observational five years, especially before and after the MS5.7 earthquake. One year before the earthquake, the delay time of slow wave slowly increased, suggesting the stress accumulation. Till one month before the earthquake, the delay time of slow wave decreases rapidly, indicating the stress in the crust releases rapidly with the earthquake occurrence.
-
-
![]()
图 1 研究区域内构造背景(a)与地震分布(b)
图(a)中红色方框为本文的研究区域. F1:木里弧形断裂;F2:日古鲁—岩瓦断裂;F3:永宁断裂;F4:丽江—小金河断裂;F5: 盐源断裂
Figure 1. Tectonic settings (a) and distribution of earthquakes (b) in the studied area
The red square in Fig.1a delineates the studied area. F1: Muli curviplanar fault; F2: Rigulu-Yanwa fault; F3: Yongning fault; F4: Lijiang-Xiaojinhe fault; F5: Yanyuan fault
![]()
图 3 泸沽湖地震台站(三角形)周围地形
Figure 3. The topography around the seismic station LGH denoted by triangle
![]()
图 4 泸沽湖台站记录的20100414202138地震数据的剪切波分裂分析
(a) 地震波三分向记录, 两条竖线标出了截取的剪切波数据段;(b) 截取的剪切波质点偏振图, 其中S1为快波到时,S2为慢波到时;(c) 快(F)、 慢(S)剪切波的波形图
Figure 4. The shear-wave splitting analysis of the seismic data 20100414202138 recorded by station LGH
(a) The three-component waveform,wehere two vertical short bars mark the cut shear-wave section; (b) The trail of the shear-wave particle motion. S1 is the arrival time of fast wave,and S2 is the arrival time of slow wave; (c) The waveforms of fast (F) and slow (S) waves
![]()
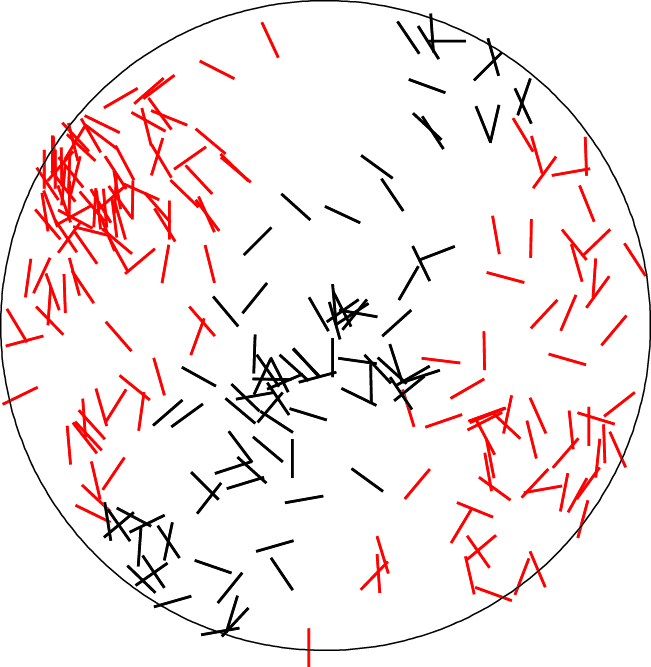
图 5 泸沽湖台站快波偏振方向等面积极射投影图
红色、 黑色短线分别为区域1和2的快波偏振方向
Figure 5. Lower hemispherical equal-area projection diagram of the fast shear-wave polarizations at the station LGH
Red bars are the polarizations of the fast shear-wave in band 1,and black bars are those in band 2
![]()
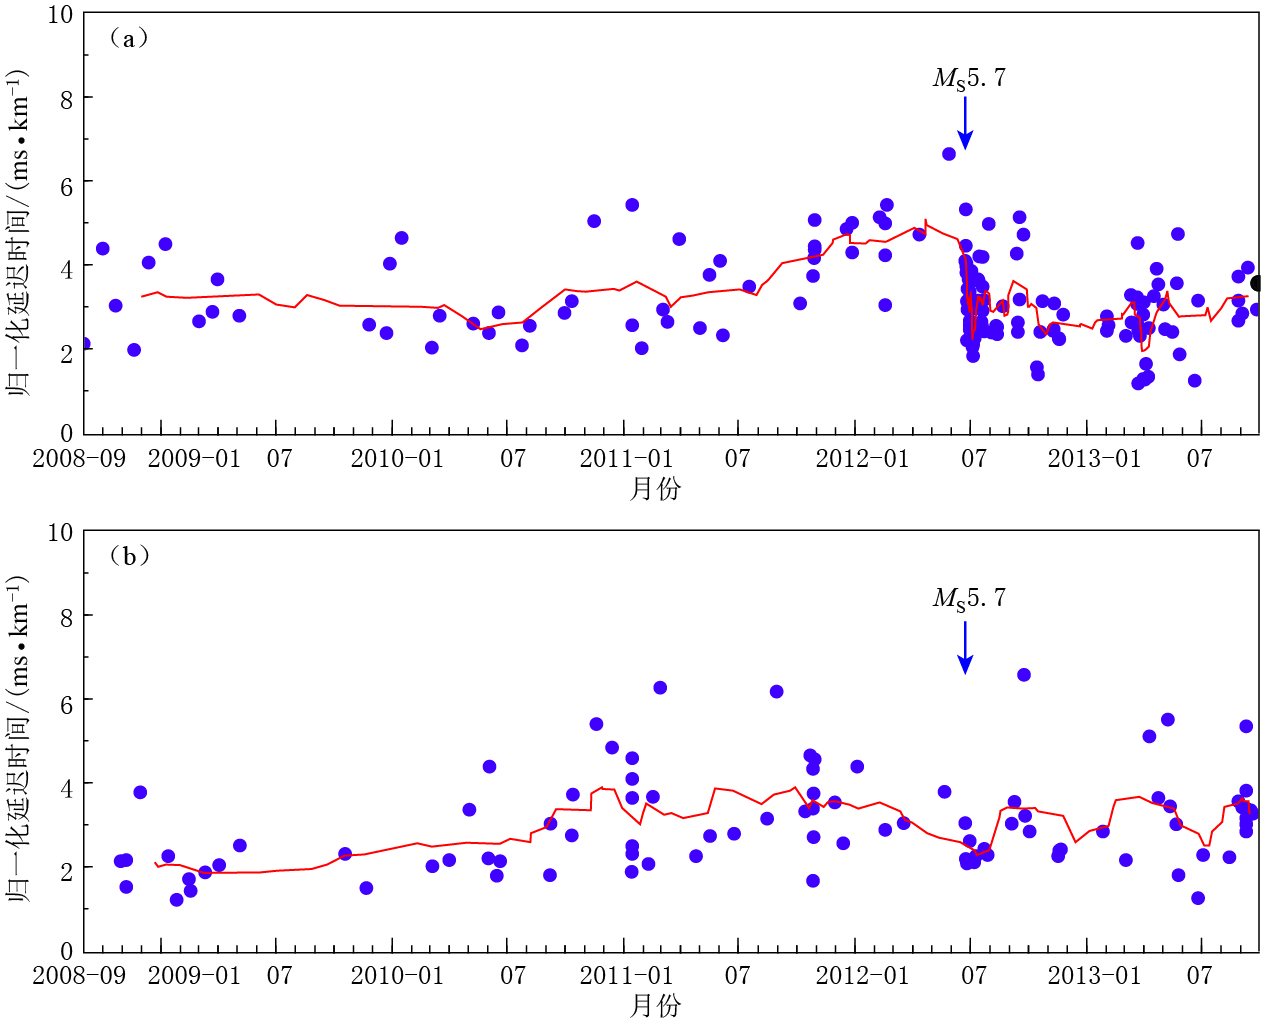
图 6 泸沽湖台站区域1(a)和区域2(b)慢波延迟时间变化图
黑点为各个地震事件所得到的归一化慢波延迟时间结果,红色实线为7点滑动 平均的计算结果,图中还给出了宁蒗-盐源MS5.7地震的发生时间
Figure 6. The change in delay time of slow shear-wave in region 1 (a) and 2 (b) at the station LGH
Black points are the normalized results of delay time of slow shear-wave from every earthquake, red solid lines are the results of 7-point moving average; the occurrence of Ninglang-Yanyuan MS5.7 earthquake is also given
-
中国地震局地球物理研究所. 2012. 2012年6月24日云南宁蒗、 四川盐源交界5.7级地震[EB/OL]. [2012-06-25]. http://www.cea-igp.ac.cn/tpxw/263396.shtml. Institute of Geophysics, China Earthquake Administration. 2012. MS5.7 earthquake on June 24, 2012, at the juncture of Ninglang in Yunnan, and Yanyuan in Sichuan[EB/OL]. [2012-06-25]. http://www.cea-igp.ac.cn/tpxw/263396.shtml (in Chinese).
Crampin S, Booth D C. 1985. Shear-wave polarizations near the North Anatolian Fault: Ⅱ. Interpretation in terms of crack-induced anisotropy[J].Geophys J Int, 83(1): 75-92.
 下载:
下载:


计量
- 文章访问数: 580
- HTML全文浏览量: 227
- PDF下载量: 23
