

Characteristics of the ML3.9 Jinzhai, Anhui, earthquake swarm sequence in 2014
-
摘要: 本文首先采用双差定位方法对2014年金寨ML3.9震群序列进行了重新定位, 然后通过Snoke方法和CAP方法计算了该震群序列中较大地震的震源机制解, 分析了震源参数的时空变化特征. 结果表明: 金寨震群序列密集分布在2 km×2 km范围内, 无明显的展布方向; 其震源深度较浅, 大部分集中在3—7 km. 此外, 金寨震群序列中较大地震的震源机制解基本一致, 两组节面的走向分别为NW向和NNE向, 倾角均较高, 表明该震群序列为近E--W向的水平挤压和近N--S向的水平拉张应力场作用下的走滑型地震活动.Abstract: This paper relocated the ML3.9 Jinzhai, Anhui, earthquake sequence in 2014 with double-difference earthquake location algorithm firstly, and then calculated the focal mechanisms of stronger earthquakes of the swarm by using Snoke and CAP methods, respectively. Finally, the spatio-temporal evolutionary characteristics of source parameters were analyzed. The results show that the Jinzhai earthquake swarm sequence was distributed in the dense scope of 2 km×2 km without predominant direction. The focal depth is very shallow, being 3-7 km. In addition, the focal mechanisms of larger earthquakes are basically consistent with each other. The strikes of two nodal planes are separately along the direction of NW and NNE, and the dips of two nodal planes are very high, suggesting the Jinzhai earthquake swarm sequence was caused by strike-slip faulting under the action of horizontally compressed nearly in E-W direction and horizontally extended nearly in N-S direction.
-
本目录中的地震参数来自“中国地震台站观测报告”(简称“月报”). 其中,国内及邻区给出M≥4.7的事件,全球给出M≥6.0的事件. “月报”由中国地震台网中心按月做出.
本目录中的发震时刻采用协调世界时(UTC); 为了方便中国读者,也给出北京时(BTC). 震中位置除给出经纬度外,还给出参考地区名,它仅用作查阅参考,不包含任何政治意义; 还给出测定震源位置的台数(n)和标准偏差(SD).
面波震级MS是用中周期宽频带SK地震仪记录,采用北京台1965年面波震级公式MS=lg(AH/T)+1.66 lg(Δ)+3.5(1°<Δ<130°)求得,AH是两水平分向最大面波位移的矢量合成位移. MS7是对763长周期地震仪记录,采用国际上推荐的面波震级公式MS7=lg(AV/T)+1.66 lg(Δ)+3.3(20°<Δ<160°)求得,AV是垂直向面波最大地动位移. mb是短周期体波震级,ML是近震震级. 为避免混乱,震级之间一律不换算.
表 1 中国及邻区地震目录(2015年11—12月, M≥4.7Table 1. Catalog of earthquakes within and near China (November December, 2015, M≥4.7编 号 发震时刻 地理坐标 深度/km 震级 标准偏差(SD) 使用台数(n) 地区 UTC BTC日 时 纬度/°N 经度/°E MS MS7 ML mb 月 日 时:分:秒 1 11 0 21:09:39.8 02 05 22.75 121.70 10 5.6 5.4 5.5 5.1 1.4 101 台湾地区 2 03 00:06:30.7 03 08 24.95 121.95 10 5.2 5.0 5.2 4.5 1.9 90 台湾岛 3 11 15:33:19.3 11 23 24.55 122.70 90 4.4 4.0 4.8 1.9 98 台湾地区 4 13 20:51:34.0 14.04 31.05 128.75 10 7.5 7.3 7.2 2.7 94 中国东海 5 13 21:19:25.9 14 05 30.83 128.72 14 4.8 4.8 2.3 38 中国东海 6 14 19:20:19.0 15 03 31.40 128.80 20 6.2 6.0 5.8 5.6 1.5 102 中国东海 7 14 20:34:27.5 15 04 31.22 128.72 10 5.3 5.0 5.4 4.7 1.5 89 中国东海 8 18 04:38:48:.9 18 12 31.21 128.81 13 5.2 4.8 4.9 4.7 2.3 83 中国东海 9 18 12:18:05.0 18 20 31.00 128.50 10 4.7 4.5 4.3 2.9 44 中国东海 10 19 14:41:50.0 19 22 31.30 128.90 28 4.7 4.4 4.7 4.3 2.7 60 中国东海 11 22 21:02:41.4 23 05 38.01 100.39 10 5.3 5.2 5.0 4.8 2.5 87 青海省 12 25 05:02:02.2 25 13 29.71 90.02 38 4.8 4.6 1.9 27 西藏自治区 -
![]()
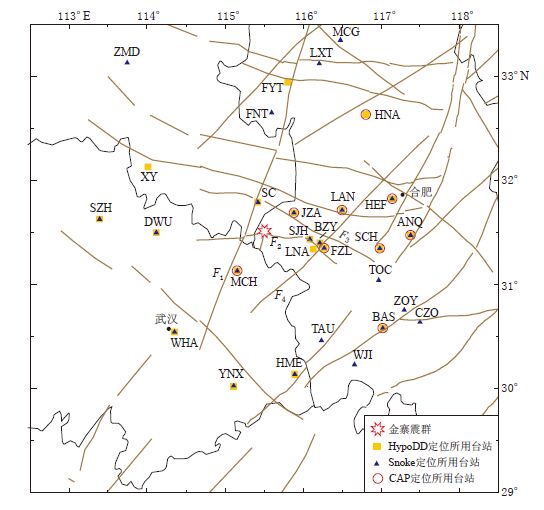
图 2 金寨震群位置及震区内断裂和台站的分布 F1: 商城—麻城断裂; F2: 青山—晓天断裂; F3: 梅山—龙河口断裂; F4: 落儿岭—土地岭断裂
Figure 2. Location of Jinzhai earthquake swarm as well as distribution of seismic stations and faults F1: Shangcheng-Macheng fault; F2: Qingshan- Xiaotian fault; F3: Meishan-Longhekou fault; F4: Luoerling-Tudiling fault
![]()
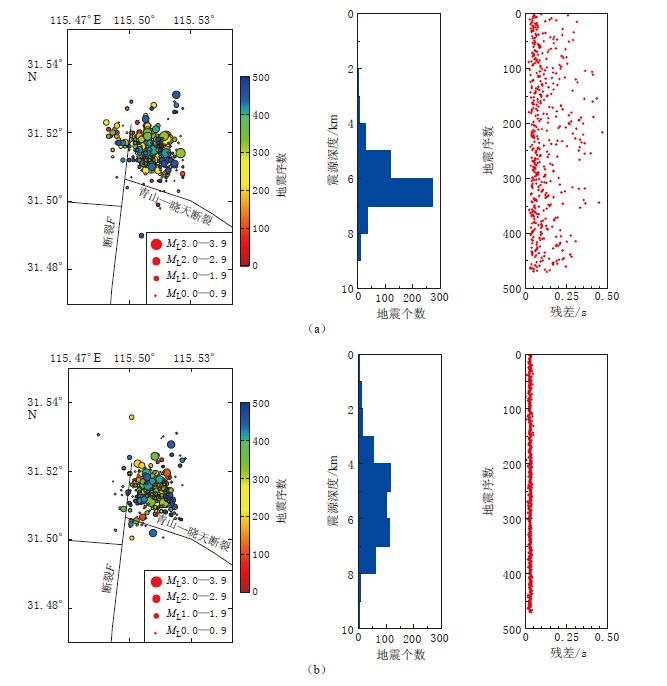
图 3 金寨震群重定位前(a)、 后(b)震中、 震源深度及定位残差分布
Figure 3. Distribution of epicenter, focal depth and location residue before(a) and after(b)relocation of Jinzhai earthquake swarm
![]()
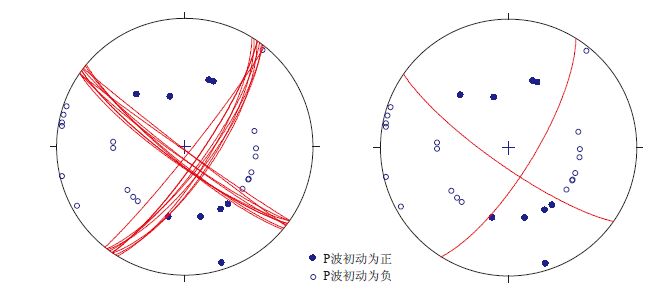
图 4 用Snoke方法计算得到的2014年10月26日ML3.9地震的震源机制解 (a)所有解;(b)最佳解
Figure 4. Focal mechanism solutions of the 26 October 2014 ML3.9 earthquake calculated by Snoke method where dots represent positive polarity of P waves, open circles represent negative polarity of P waves (a)All of solutions;(b)Optimized solution
![]()
![]()
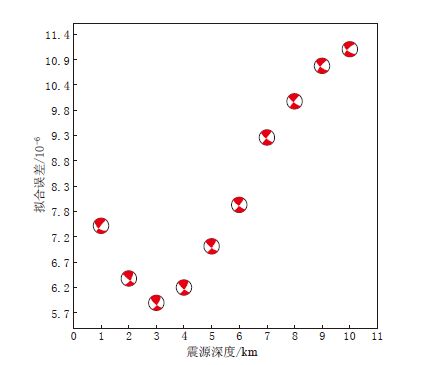
图 6 CAP方法反演2014年10月26日ML3.9地震震源机制解的误差随震源深度的变化
Figure 6. The misfit error distribution of focal mechanism solution of the 26 October 2014 ML3.9 earthquake calculated by CAP method as a function of focal depth
![]()
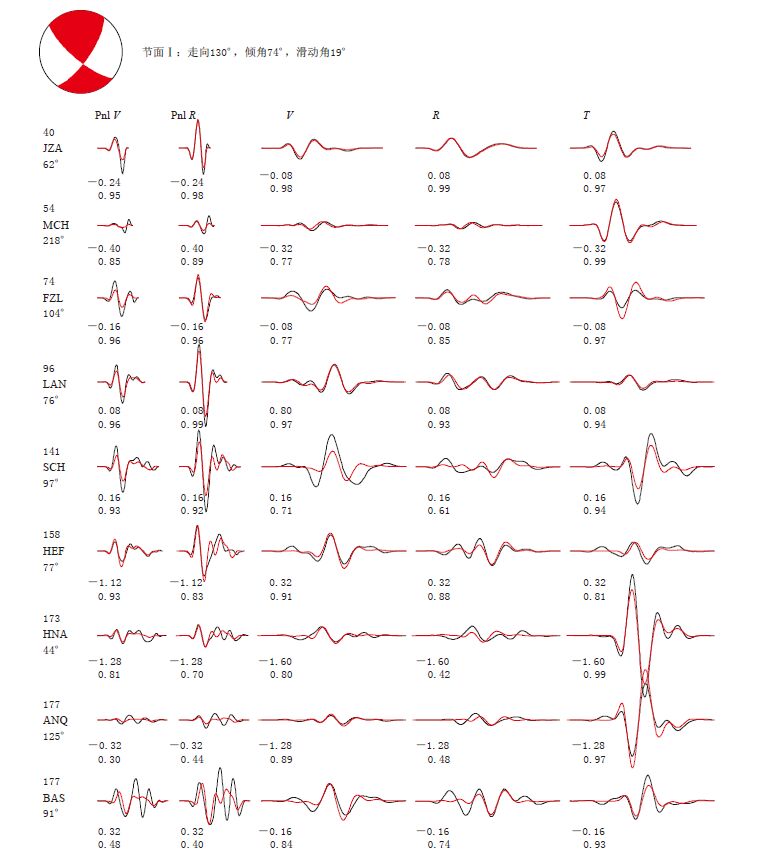
图 7 2014年10月26日ML3.9地震的理论地震波形(红色)与观测地震波形(黑色)的对比 波形左端为台站代码,其上下数字分别表示震中距(单位: km)和方位角; 波形下方第一行 数字为理论地震图相对观测地震图的时移(单位: s),第二行数字为二者的相关系数
Figure 7. Comparison between synthetic waveforms(red lines) and observed ones (black lines)of the ML3.9 earthquake on 26 October 2014 The station codes are given at the left of waveforms with epicentral distances(in unit of km)at the top and azimuths at the bottom,the numbers of the first line below the waveforms are the time shifts (in unit of s),the numbers of the second line are their correlative coefficient
表 1 金寨地区分层地壳速度模型
Table 1 Layered crustal velocity model of Jinzhai region
序号 深度/km 层厚/km vP/(km·s-1) 1 0—2 2 4.98 2 2—5 3 5.22 3 5—10 5 5.59 4 10—15 5 6.12 5 15—20 5 6.46 6 20—25 5 6.45 7 25—33 8 7.03 8 33—40 7 8.00  下载: 导出CSV
表 2 用Snoke方法计算得到的2014年10月26日ML3.9地震的震源机制解误差
Table 2 Error of focal mechanism solutions of the 26 October 2014 ML3.9 earthquake calculated by Snoke method
序号 震源机制解 矛盾个数 振幅比均方差 总均方差 走向/° 倾角/° 滑动角/° P波初动 振幅比 1 125 89 20 0 5 0.28 0.38 2 125 83 19 0 5 0.27 0.37 3 125 79 17 0 4 0.29 0.37 4 130 80 18 0 4 0.27 0.40 5 128 89 15 0 5 0.27 0.40 6 127 84 14 0 4 0.28 0.39 7 126 79 10 0 4 0.30 0.38 8 127 75 3 0 5 0.24 0.42 9 129 81 4 0 5 0.25 0.43
下载: 导出CSV
表 3 金寨震群中15次ML≥3.0地震的震源机制解
Table 3 Focal mechanism solutions of 15 ML≥3.0 earthquakes in Jinzhai earthquake swarm
序号 方法 发震时间 ML 节面Ⅰ 节面Ⅱ P轴 T轴 B轴 月-日 走向/° 倾角/° 滑动角/° 走向/° 倾角/° 滑动角/° 方位角/° 倾角/° 方位角/° 倾角/° 方位角/° 倾角/° 1 Snoke 10-22 3.0 127 83 29 33 61 172 257 14 354 26 140 60 2 Snoke 10-22 3.7 125 83 19 33 71 173 258 8 350 18 144 70 CAP 3.7 316 65 16 219 75 154 269 7 176 29 11 60 3 Snoke 10-26 3.9 125 79 17 32 74 168 258 3 349 20 158 70 CAP 3.9 130 74 19 34 72 163 262 1 353 25 169 65 4 Snoke 10-26 3.7 127 83 29 33 61 172 257 14 354 26 140 60 CAP 3.7 140 71 -9 232 83 -160 98 20 5 7 256 69 5 Snoke 10-26 3.4 121 85 30 28 61 174 251 17 349 24 130 60 6 Snoke 10-28 3.6 138 82 24 44 67 171 269 10 3 23 156 65 CAP 3.6 140 66 10 46 81 156 95 10 0 24 207 64 7 Snoke 10-29 3.1 128 76 32 30 59 164 256 11 353 33 149 55 8 Snoke 10-29 3.0 140 71 36 37 56 157 266 10 4 38 164 50 9 Snoke 11-06 3.4 126 82 24 32 67 171 257 10 351 23 144 65 10 CAP 11-06 3.4 145 60 46 28 51 140 265 5 1 53 171 34 Snoke 3.3 125 83 19 33 71 173 258 8 350 18 144 70 11 Snoke 11-11 3.6 141 85 30 48 61 174 271 17 9 24 150 60 CAP 3.6 142 80 -8 233 82 -169 98 13 7 1 271 77 12 Snoke 11-11 3.5 140 78 22 46 69 167 272 6 4 24 168 65 CAP 3.5 145 81 6 54 84 171 99 2 9 11 201 79 13 Snoke 11-11 3.1 136 70 15 41 76 159 89 4 357 24 188 65 14 Snoke 12-05 3.3 138 86 45 44 45 175 262 27 11 33 141 45 15 Snoke 12-08 3.3 137 87 40 44 50 176 264 24 8 30 141 50
下载: 导出CSV
-
期刊类型引用(2)
1. 王阅兵, 甘卫军, 张锐, 游新兆. 朝鲜2017年核爆对中国东北地区形变场的影响. 大地测量与地球动力学. 2020(01): 11-16 .  百度学术
百度学术
2. 黄辅琼, 陈宏峰, 马鸣宇, 马玉川. 2017年9月3日朝鲜核试引起中国东北地区的承压井水位变化初步报道. 国际地震动态. 2018(04): 25-30 . 百度学术
其他类型引用(0)
计量
- 文章访问数: 608
- HTML全文浏览量: 234
- PDF下载量: 10
- 被引次数: 2
