

Consistency of seismogenic stress field of preshocks to the tectonic stress field before eight earthquakes (MW≥6.0) in southern California of United States from 1981 to 2011
-
摘要: 定义了“P轴分布集中度”, 用以研究中强地震前中小地震震源机制变化. 利用美国南加州地区1981—2011年地震的震源机制解资料, 分析了该地区8次MW≥6.0地震前由小震震源机制求得的发震应力场P轴的集中情况. 结果表明, 其中7次地震前均观察到了“P轴分布集中度”值具有极小值, 即小震发震应力场P轴向区域构造应力场主压应力的集中现象, 为中强震预测提供了一种方法.Abstract: This paper defines an index called “concentration ratio of P axis distribution” used for analyzing the variation of focal mechanisms of small earthquakes before moderate-strong earthquakes. And then based on the focal mechanism solutions of earthquakes in southern California in the period of 1981—2011, this paper investigates the seismogenic stress field of small events concentrating on the local tectonic stress field before eight main shocks (MW≥6.0) in the southern California. The results show a phenomenon that the “concentration ratio of P axis distribution” has a minimum was observed before seven earthquakes, that is, the seismogenic stress field of small events concentrates on the local tectonic stress field. It provides a method for the risk prediction of moderate-strong earthquakes.
-
-
![]()
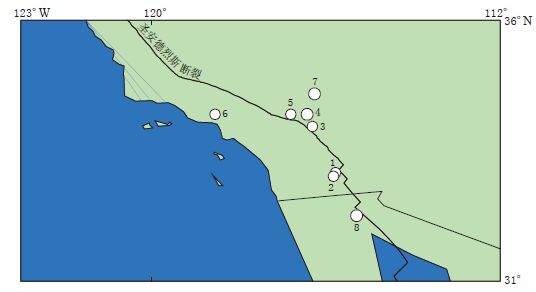
图 1 本文所选取的1981—2011年美国南加州地区MW≥6.0地震分布 (据Globle CMT,2012). 图中地震编号与表 1中编号相对应
Figure 1. Distribution of the earthquakes with MW≥6.0 from 1981 to 2011 in southern California of United States(from Globle CMT,2012)used in this paper. The numbers of earthquakes correspond to those listed in Table 1
![]()
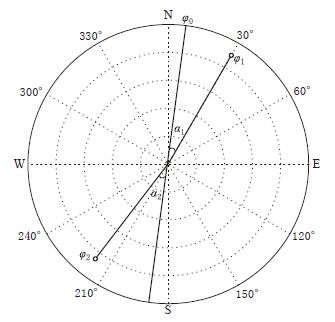
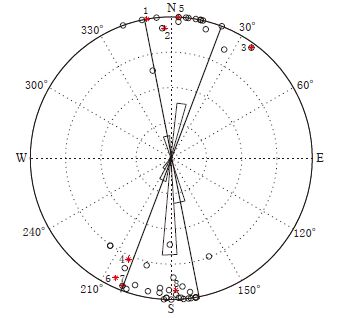
图 2 计算“P轴分布集中度”的示意图
Figure 2. The schematic diagram for calculating the concentration ratio of P axis distribution
![]()
图 3 “P轴分布集中度”ci的时间演化分析示意图
Figure 3. The schematic diagram for temporal evolution of “concentration ratio of P axis distribution” ci
![]()
![]()
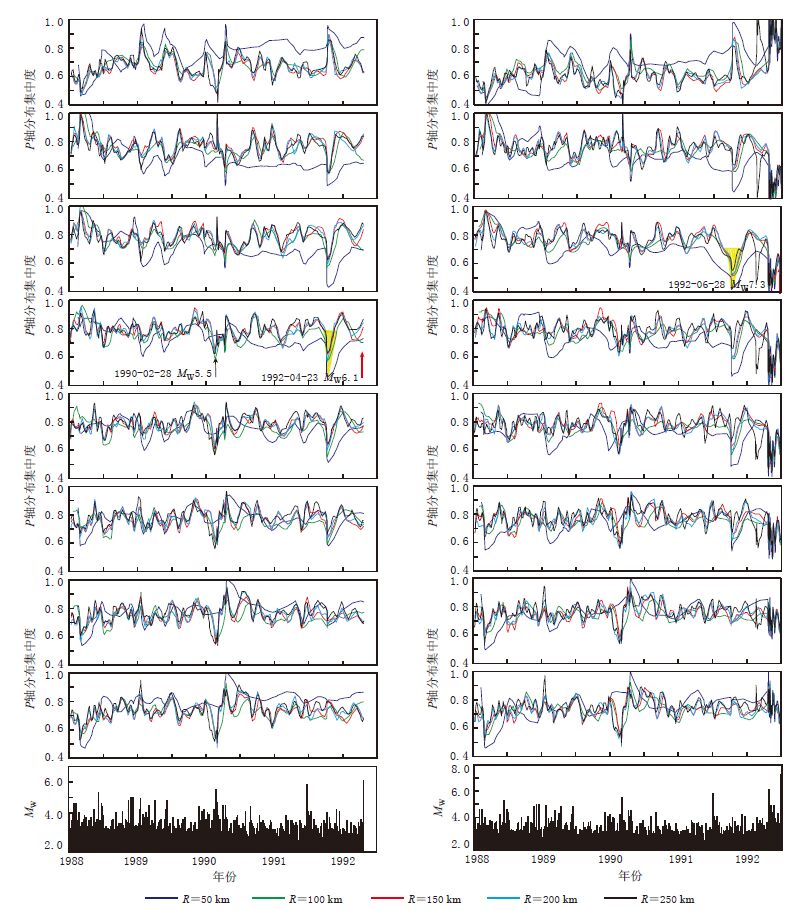
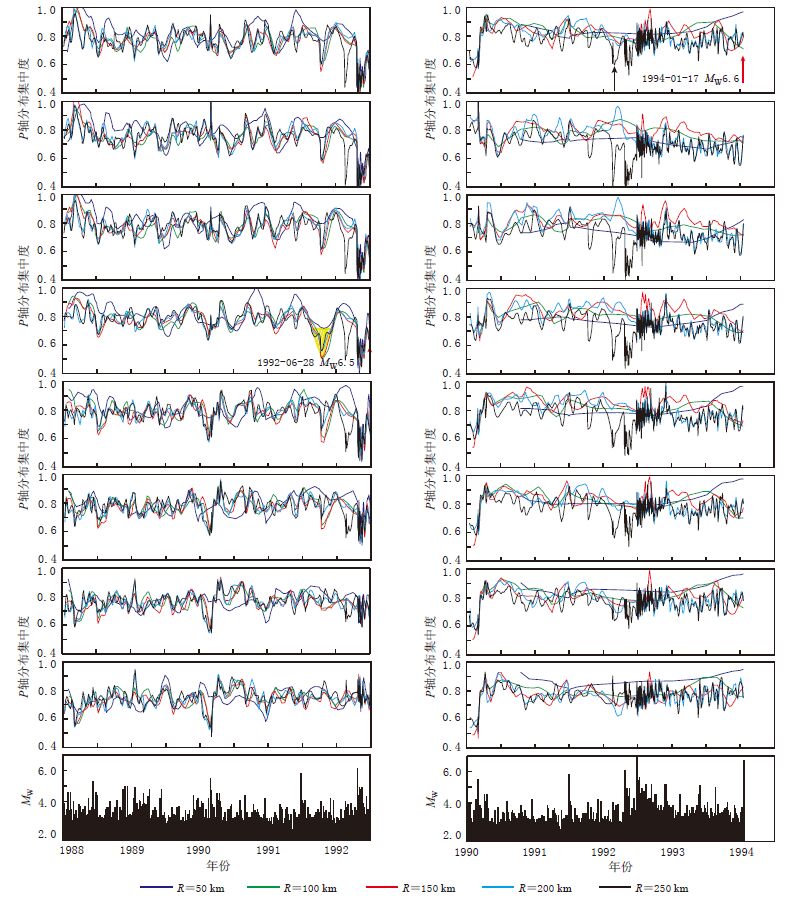
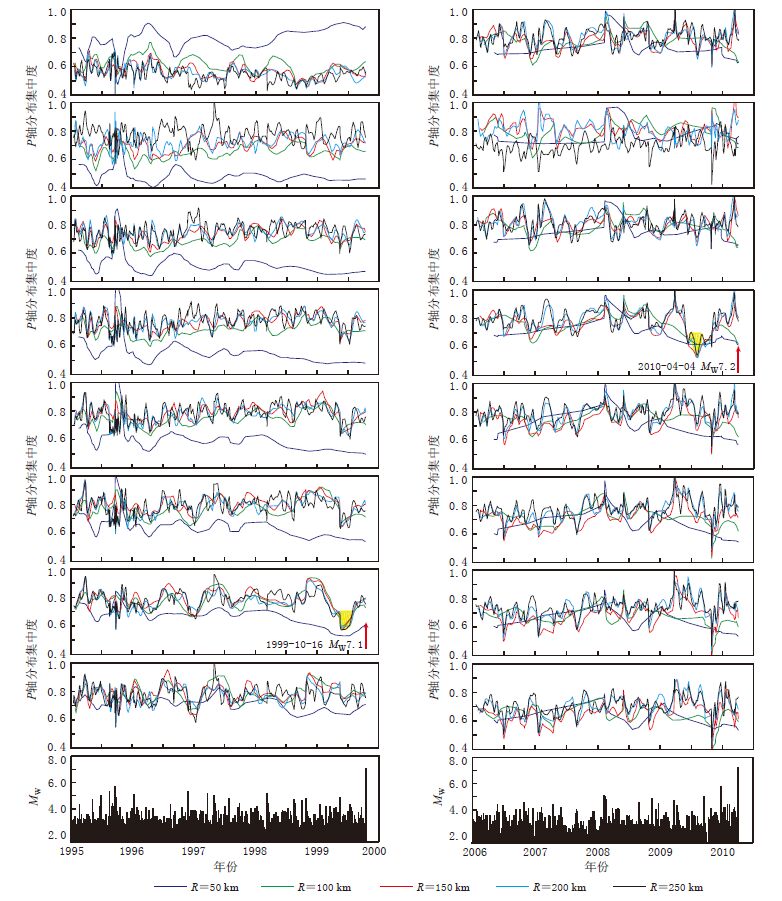
图 5 美国南加州地区1号(左)和2号(右)地震“P轴分布集中度”计算结果 对每个子图而言,最上面小图表示给定的应力场是主震的发震应力场; 第2—8个小图从上到下分别表示给定的应力场分别为NNW10°(350°),NNW5°(355°),N(0°),NNE5°,NNE10°,NNE15°和NNE20°; 最下面小图表示该主震周围半径250 km范围内MW≥1.5地震的M-t图. 不同颜色的线条表示不同的空间半径R;黄色区域表示“P轴分布集中度”减少的时间段,红色箭头表示主震发生的时间
Figure 5. Calculation results of “concentration ratio of P axis distribution” for the No.1(left) and No.2(right)earthquakes in southern California of United States For each panel,the top one shows seismogenic stress field of main shock taken as the given field,the second to the eighth subfigures show the stress field NNW10°(350°),NNW5°(355°),N(0°),NNE5°,NNE10°,NNE15° and NNE20° as the given field,respectively. The bottom one gives the M-t for the main shock(MW≥1.5)in the area with radius 250 km centered. Different lines show different radii. The yellow areas show time interval with “concentration ratio of P axis distribution” reducing. The red arrows show the occurrence time of the main shocks
![]()
![]()
![]()
表 1 本文所选取的8次MW≥6.0地震参数(引自Globle CMT,2012)
Table 1 Parameters of eight MW≥6.0 earthquakes used in this study(after Globle CMT,2012)
编 号 震中位置 发震时间(GMT) 震中位置 MW 断层面解 P轴 T轴 B轴 年-月-日 时:分:秒 北纬/° 西经/° 走向/° 倾角/° 滑动角/° 走向/° 仰角/° 走向/° 仰角/° 走向/° 仰角/° 1 Laguna Salada region 1987-11-24 01:54:20.5 33.02 115.69 6.0 305 90 180 350 0 260 0 98 90 2 Superstition Hills 1987-11-24 13:16:11.5 33.02 116.00 6.5 133 78 178 357 7 88 10 232 78 3 Joshua Tree 1992-04-23 04:50:29.5 34.07 116.52 6.1 81 87 -1 36 3 306 1 189 87 4 L and ers 1992-06-28 11:57:53.0 34.65 116.65 7.3 341 70 -172 203 20 296 8 47 69 5 Big Bear 1992-06-28 15:05:39.6 34.27 117.24 6.5 318 88 178 3 0 273 3 93 87 6 Northridge(T) 1994-01-17 12:31:03.5 34.44 118.64 6.6 278 42 65 205 6 97 73 297 16 7 Hector Mine 1999-10-16 09:46:59.2 34.71 116.27 7.1 336 80 174 201 3 292 11 98 78 8 Baja California 2010-04-04 22:41:09.2 32.31 115.39 7.2 223 84 -2 178 6 88 3 331 84 注: 震中位置参考了Freed 等(2007)结果,发震应力场数据根据断层面解计算得出.  下载: 导出CSV
表 2 “P轴分布集中度”c值减小的时间段以及c值最小值距主震发生的时间
Table 2 The duration of c-value(concentration ratio of P axis distribution)decreasing and the time internal from the minimum of c-value to the occurrence time of the main shock
地震编号 MW c值减小时间段 c值最小的时间 主震发震日期 最小c值距主震的时间/mo 1 6.0 1986-10—1987-05 1987 1987-11-24 12 2 6.5 1986-10—1987-05 1987 1987-11-24 12 3 6.1 1991-08—1991-11 1991-10 1992-04-23 7 4 7.3 1991-08—1991-11 1991-10 1992-06-28 9 5 6.5 1991-08—1991-11 1991-10 1992-06-28 9 6 6.6 1994-01-17 7 7.1 1999-04—1999-07 1999-05 1999-10-16 5.5 8 7.2 2009-05—2009-08 2009-07 2010-04-04 9
下载: 导出CSV
-
Global CMT. 2012. Global CMT catalog search[EB/OL]. [2015-05-01]. http://www.globalcmt.org/CMTsearch.html.
-
期刊类型引用(10)
1. 史哲,廖武林,姚运生,童广勤. 基于震相自动检测方法的秭归地区三维速度成像. 大地测量与地球动力学. 2024(12): 1280-1286+1311 .  百度学术
百度学术
2. 胡锦涛,谢军,危自根,金超. 三峡库区秭归段浅层速度结构和孕震环境. 地震学报. 2023(02): 223-233 . 本站查看
3. 张双喜,刘金钊,张品,陈兆辉. 联合BEMD和WMM方法实现位场多尺度边界检测. 武汉大学学报(信息科学版). 2022(04): 533-542 . 百度学术
4. 冯锐. 趣味地震学(5):诱发地震, 远非那么简单. 国际地震动态. 2019(05): 32-40 . 百度学术
5. 李伟,储日升,王烁帆. 2017年6月16日湖北秭归M_S4.3地震成因初探. 地震. 2019(03): 28-42 . 百度学术
6. 王杰,王秋良,黄颂,吴海波,赵凌云,陈俊华. 湖北巴东地区滑脱构造与地震活动特征. 大地测量与地球动力学. 2018(03): 225-232 . 百度学术
7. 张娜,赵翠萍,周连庆. 三峡水库区上地壳三维精细速度结构成像. 地震. 2018(04): 37-48 . 百度学术
8. 罗佳宏,马文涛. 三峡库区上地壳速度结构初步研究. 地震地质. 2016(02): 329-341 . 百度学术
9. 吴海波,王杰,杜承宸,申学林,陈俊华. 三峡库区上地壳S波衰减成像研究. 地震学报. 2016(02): 188-198+328 . 本站查看
10. 李小勇,朱培民,周强,彭松柏,刘江平,刘娇. 三峡库区上地壳横波速度结构. 地球科学(中国地质大学学报). 2014(12): 1842-1850 . 百度学术
其他类型引用(11)

计量
- 文章访问数: 830
- HTML全文浏览量: 490
- PDF下载量: 7
- 被引次数: 21
