

Site response of Fujian seismic monitoring stations based on Nakamura H/V spectral ratio method
-
摘要: 应用噪声谱比法, 收集了福建台网观测台站记录的地脉动噪声数据, 计算分析了85个观测台站的场地响应. 根据场地响应曲线形态将福建台网观测台站分为4类, 并简要分析了影响台站场地响应结果的因素. 计算结果表明, 福建台网观测台站台基情况普遍较好, 在台站观测频带内场地响应曲线平坦, 大部分台站均没有明显的频率放大点. 本文采用H/V谱比法与Moya方法所获得的37个台站的场地响应结果基本一致, 仅有少数台站存在较大差异. 应用场地响应分析结果, 结合计算震级时所量取的周期, 对福建台网观测台站的单台震级校正值进行了估计, 并与统计方法获得的单台震级校正值进行了比对. 结果表明, 两种方法获得的台站震级校正值存在一定的相关性, 但由于考虑的影响因素不同, 具体的台站震级校正值尚存在差别.Abstract: Based on the Nakamura H/V spectral ratio (NHVR) method, the site response of 85 seismic monitoring stations in Fujian region were analyzed by using microtremors noise data recorded by the stations of Fujian teleseismic network in this paper. Then, we divided the stations into four groups according to the shape of site response curves, and briefly analyzed the factors resulting in different site response results. As a result of good site situation of platform, most of the stations of Fujian teleseismic network has a flat site response curve without obvious frequency amplification point. In addition, the site response obtained by NHVR method in this paper is basically consistent with that of 37 seismic stations calculated by Moya method, except for a few of stations. With reference to the periods during the magnitude calculation, we obtained the magnitude correction value of each seismic station of Fujian network, and compared them with those by statistical method. The results indicate that the two kinds of specific magnitude correction values have a certain correlation, but due to different factors considered during the analysis, there are also some differences.
-
-
![]()
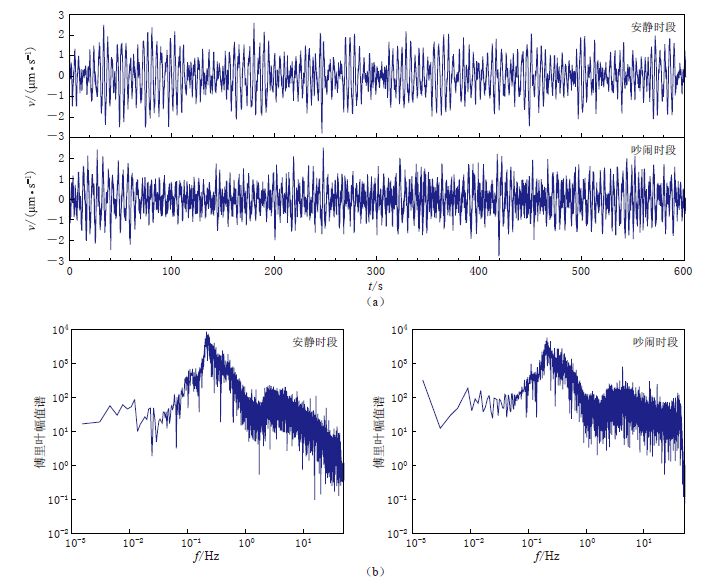
图 2 FZCM台地震动噪声记录(a)及其傅里叶幅值谱(b)
Figure 2. Noise records(a) and its Fourier amplitude spectrum(b)of station FZCM
![]()
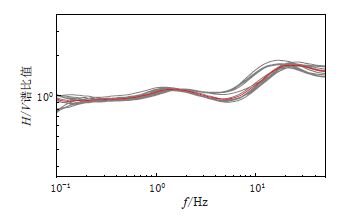
图 3 FZCM台安静时段(a)和吵闹时段(b)H/V谱比值对比
Figure 3. Comparison of H/V spectral ratio by using quiet-time data(a) and noisy-time data(b)from the station FZCM
![]()
图 4 根据全年地震动噪声记录获得的FZCM台场地响应
Figure 4. Site response of station FZCM based on a whole year noise records
![]()
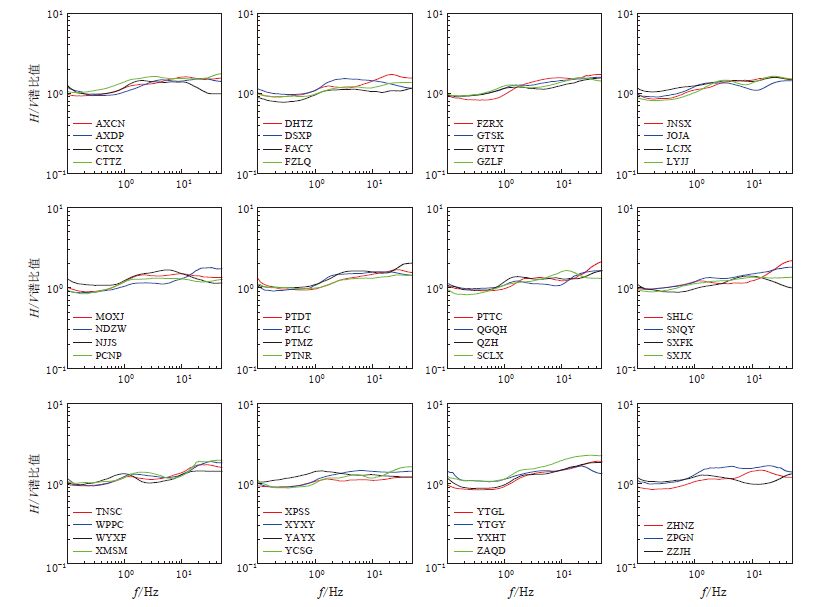
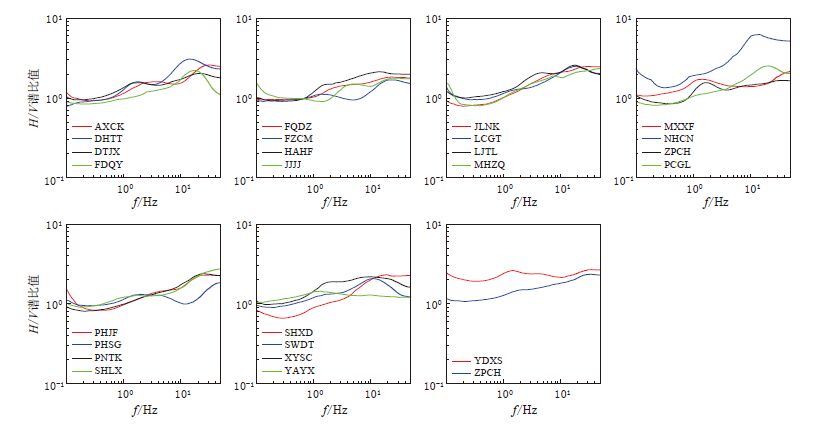
图 5 没有明显频率放大点的台站场地响应
Figure 5. Site response of the stations with unobvious frequency amplification points
![]()
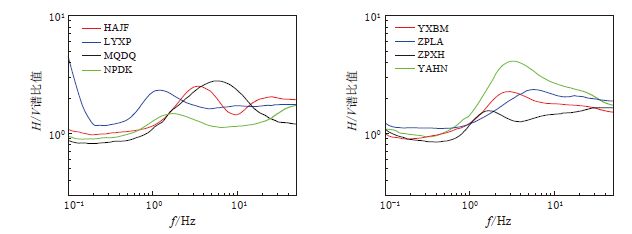
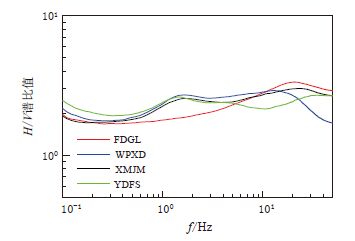
图 6 中频段有明显频率放大点的台站场地响应
Figure 6. Site response of the stations with obvious frequency amplification points in middle frequencies
![]()
图 7 高频段有明显频率放大点的台站场地响应
Figure 7. Site response of the stations with obvious frequency amplification points in high frequencies
![]()
图 8 整个频段内均有较明显频率放大点的台站场地响应
Figure 8. Site response of stations with obvious frequency amplification points in the whole frequencies
![]()
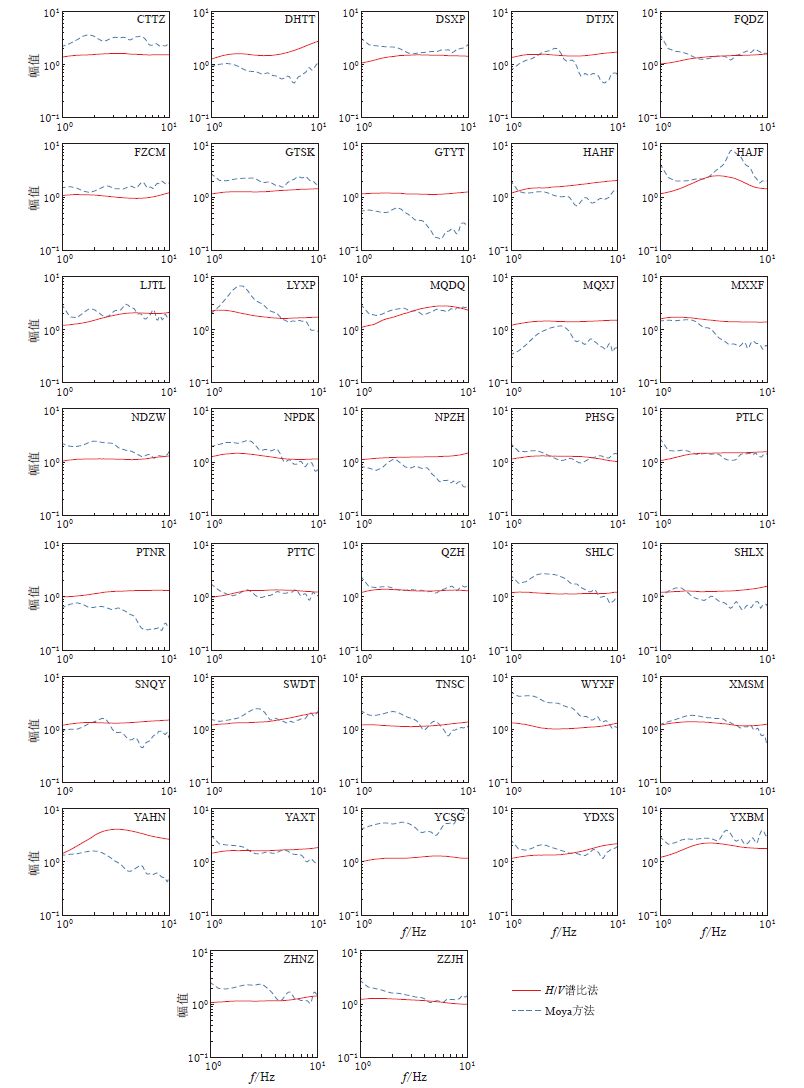
图 9 本文H/V谱比法与Moya方法得到的场地响应结果对比
Figure 9. Comparison of site response derived by H/V spectral ratio method used in this paper with that by Moya method
![]()
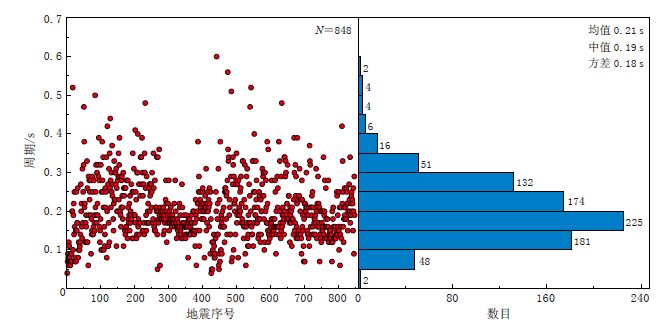
图 10 FZCM台计算震级时的周期分布统计图
Figure 10. Distribution statistics of periods used in magnitude calculation of station FZCM
![]()
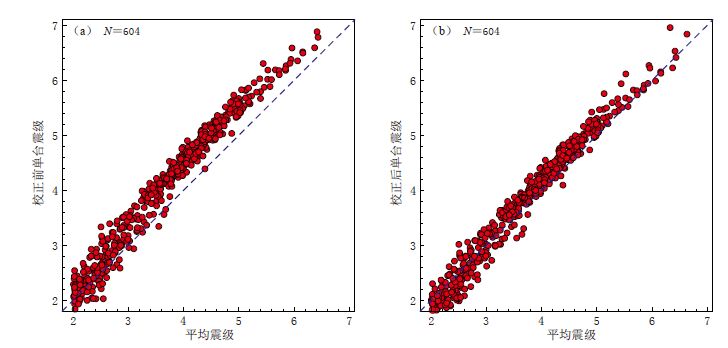
图 11 LYXP台单台震级校正前(a)、 后(b)的震级偏差分布
Figure 11. Magnitude deviation distribution before(a) and after(b)magnitude correction of station LYXP
表 1 本文方法与郭阳(2014)得到的福建地震观测台网各台站震级校正值的对比
Table 1 Comparison of magnitude adjusted values of the stations of Fujian seismic monitoring network derived by this paper with those by Guo(2014)
台站名称 震级校正值 台站名称 震级校正值 台站名称 震级校正值 本文 郭阳(2014) 本文 郭阳(2014) 本文 郭阳(2014) AXCK -0.18 0.03 LYXP -0.26 -0.19 SXJX -0.10 0.21 AXCN -0.17 -0.05 MHZQ -0.27 0.05 TNSC -0.06 0.14 AXDP -0.16 0.10 MQDQ -0.44 -0.08 WPPC -0.08 0.23 CTCX -0.14 -0.04 MQXJ -0.15 0.10 WPXD -0.43 0.02 CTTZ -0.21 0.02 MXXF -0.16 -0.02 WYXF -0.01 -0.06 DHTT -0.38 0.01 NDZW -0.05 -0.01 XMJM -0.39 0.02 DHTZ -0.09 0.05 NHCN -0.51 0.01 XMSM -0.11 0.06 DSXP -0.16 -0.10 NJJS -0.22 -0.20 XPSS -0.03 -0.10 DTJX -0.18 0.11 NPDK -0.09 0.11 XYSC -0.34 0.08 FACY -0.04 -0.15 NPZH -0.11 0.15 XYXY -0.16 -0.08 FDGL -0.30 -0.30 PCGL -0.07 0.10 YAHN -0.53 -0.59 FDQY -0.11 -0.07 PCNP -0.12 0.05 YAXT -0.23 -0.04 FQDZ -0.18 0.11 PHJF -0.17 -0.02 YAYX -0.12 -0.06 FZCM 0.02 -0.14 PHSG -0.08 0.10 YCSG -0.10 0.14 FZLQ -0.08 0.15 PNTK -0.17 0.06 YDFS -0.38 0.01 FZRX -0.18 -0.11 PTDT -0.16 -0.11 YDXS -0.32 -0.04 GTSK -0.14 0.03 PTLC -0.18 -0.08 YTGL -0.15 0.14 GTYT -0.05 0.23 PTMZ -0.21 0.06 YTGY -0.17 0.18 GZLF -0.07 -0.25 PTNR -0.11 0.15 YXBM -0.25 -0.11 HAHF -0.29 0.14 PTTC -0.12 0.07 YXHT -0.14 0.01 HAJF -0.36 -0.26 QGQH -0.04 -0.12 ZAQD -0.28 0.08 JJJJ -0.16 -0.08 QZH -0.12 0.05 ZHNZ -0.07 0.12 JLNK -0.29 -0.21 SCLX -0.11 -0.11 ZPCH -0.22 -0.08 JNSX -0.13 -0.06 SHLC -0.05 0.02 ZPGN -0.19 0.02 JOJA -0.13 0.14 SHLX -0.11 0.14 ZPLA -0.37 -0.10 LCGT -0.22 0.13 SHXD -0.22 0.07 ZPXH -0.15 0.28 LCJX -0.16 0.09 SNQY -0.13 -0.04 ZZJH -0.03 0.04 LJTL -0.31 -0.16 SWDT -0.27 -0.06 LYJJ -0.15 -0.16 SXFK -0.15 0.05  下载: 导出CSV
-
郭阳. 2014. 福建数字地震台网近震震级偏差的研究[D]. 福州: 福州大学土木工程学院: 15-39. Guo Y. 2014. The Research on Local Magnitude Deviation at Digital Seismic Network of Fujian Province[D]. Fuzhou: Civil Engineering School of Fuzhou University: 15-39 (in Chinese).
Andrews D J. 1986. Objective determination of source parameters and similarity of earthquakes of different size[C]//Earthquakes Source Mechanics. Washington D C: AGU: 259-267.
-
期刊类型引用(8)
1. 李潇,岳龙,徐清风,臧艺博,韩帮杰,王哲,李炜. 青岛地区钻孔倾斜仪地铁干扰定量分析. 地震工程学报. 2025(02): 383-392 .  百度学术
百度学术
2. 张山元,曾庆堂,段胜朝,番绍辉,李圣. 腾冲台YRY-4分量钻孔应变仪资料可靠性及同震响应特征浅析. 防灾减灾学报. 2024(02): 51-56+68 . 百度学术
3. 李晨阳,池成全. 机器学习在地震观测异常数据提取中的应用. 海南师范大学学报(自然科学版). 2024(03): 348-356 . 百度学术
4. 孙刚,王运生,余正良,赵方彬,唐涛,吴昊宸. 石棉M_S4.5级地震斜坡动力响应规律. 科学技术与工程. 2023(29): 12399-12405 . 百度学术
5. 冯凯宇,窦立婷,李晨,任力伟,成诚,丁学文. 四分量钻孔应变干扰特征时频域研究. 山西地震. 2022(01): 21-27 . 百度学术
6. 杨志鹏,陈秀清,张御阳,颜欢,陈碧洪,阮祥. 基于MATLAB的定点形变观测数据时频分析软件设计及应用研究. 震灾防御技术. 2022(01): 172-180 . 百度学术
7. 杨志鹏,陈秀清,余洋洋,张御阳,巫萌飞,徐建明,赵晶,张正伟. 基于小波分解与同步挤压变换的西昌小庙台形变典型干扰的时频响应特征研究. 地震工程学报. 2022(05): 1192-1206 . 百度学术
8. 金刚,王运生,何先龙,史丙新,周宇航. 基于连续小波变换的斜坡动力响应特征分析——以四川长宁M_s6.0级地震为例. 中国地质灾害与防治学报. 2021(02): 1-8 . 百度学术
其他类型引用(4)

计量
- 文章访问数: 659
- HTML全文浏览量: 280
- PDF下载量: 26
- 被引次数: 12
