

Cross-correlation analysis of three-component seismic recordings
-
摘要: 地震波场本质上是三维矢量波场, 单分量记录实际上是三维矢量震动在某一方向上的部分投影. 本文基于单分量地震记录互相关公式, 提出了一种新的适合三分量地震波形记录多元互相关运算的简易方法, 并以2008年汶川MS8.0地震余震序列波形为例, 对其进行了效果验证. 结果表明, 相对单分量互相关, 该方法可以得到更为合理的全局最优结果, 解决波形识别匹配工作中不同分量间的差异问题. 该方法还可以利用不同分量间的“同源”信息, 有效压制随机噪声, 并从理论上说明其合理性. 其原理及计算过程均较为简单, 整体运算量较小, 适用于目前“大数据”时代的地震数据处理.Abstract: Seismic wave is a three dimensional vector wavefield, the single component recordings are actually the projection of particle motion along certain directions. Based on the single component seismogram cross-correlation formula, this paper presents a novel simple solution which is suitable for the calculation of three-component seismogram cross-correlation, and the effectiveness of this new approach is verified via a practical case from the aftershock sequence of 2008 Wenchuan MS8.0 earthquake. Compared with single component seismogram cross-correlation, the new approach can obtain a global optimized result more reasonably and erase the discrepancy between different components in the work of template waveform matching. Also this new formula can take advantage of the congenerous between different components, suppress the ambient seismic noise effectively, and its rationality was demonstrated in theory. This new approach requires rather small computations as its simplicity in principles and procedures, which is suitable for the seismic data processing in the current era of “big data”.
-
-
![]()
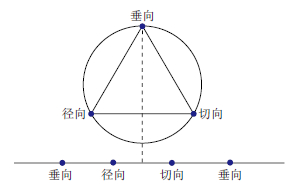
图 1 三分量地震记录投影到直线上的示意图
Figure 1. The diagram of three-component recordings projected onto a line
![]()
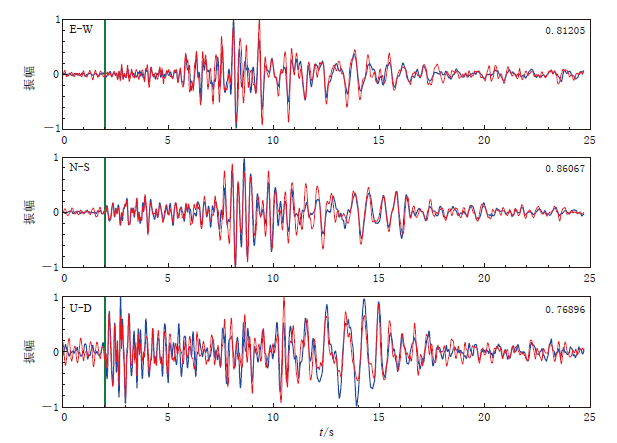
图 2 成都(CD2)台记录到的2009-07-08(红色)与2010-09-12(蓝色)两次地震滤波后的归一化三分量波形对比图及其互相关系数, 图中绿色竖线表示P波到达时间
Figure 2. Comparison of normalized three-component seismogram of two seismic events occurred on 8 July 2009 (red lines) and 12 September 2010 (blue lines) recorded at the station CD2 The cross correlation coefficient is presented on the top-right for each component, and the green lines represent the arrivals of P wave
![]()
图 3 成都(CD2)台不同分量互相关系数随时间的变化曲线
Figure 3. The cross-correlation coefficient of different components versus time at the station CD2 (the top-down order as follows: three-component as a whole, E--W component, N--S component, U--D component)
![]()
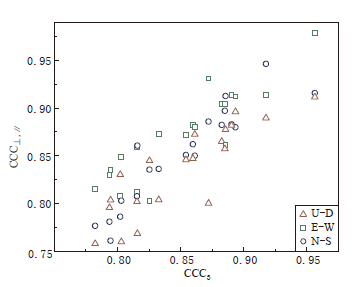
图 4 不同分量计算得到的互相关系数与三分量综合后的互相关系数之间的关系 横、 纵坐标分别表示某一地震事件三分量综合后和水平(或垂直)分量的归一化互相关系数
Figure 4. Relationship of cross-correlation coefficient between single component and three components The abscissa is the normalized cross-correlation coefficient of the three components for a given event, the ordinat is the normalized cross-correlation coefficients of single horizontal or vertical component for this event
-
李宇彤.2012."重复地震"的若干地震学问题[D].北京: 中国地震局地球物理研究所: 36-40. Li Y T.2012.The Seismology of 'Repeating Earthquakes'[D].Beijing: Institute of Geophysics, China Earthquake Administration: 36-40 (in Chinese).
doi: 10.1029/2007GL031594 doi: 10.1029/2011JB008406 doi: 10.1126/science.1070378 doi: 10.1029/2010JB007895 doi: 10.1785/0120090257
 下载:
下载:

计量
- 文章访问数: 758
- HTML全文浏览量: 252
- PDF下载量: 43
