

Variation of the geomagnetic harmonic wave amplitude ratio before the MS5.5 Eryuan earthquake in 2013
-
摘要: 本文首先使用滇西北地磁台阵8个测点2012年6月1日—2013年5月31日记录的短周期地磁数据, 计算得到各测点的谐波振幅比时间序列变化曲线. 该曲线显示: 各测点的谐波振幅比YZHy和YHD在2013年3月3日普洱MS5.5地震前均呈显著高值, 发震前则刚好是由高转低再上升的一个转折点; 而谐波振幅比YZHx没有出现类似的异常变化. 其次通过对台阵区地下电导率结构的定性分析, 对该计算结果予以解释. 对于地磁短周期垂直分量反相现象和威斯矢量分布的分析结果表明, 地下存在着近似南北走向的电导率异常带. 由于台阵区域YZHy和YHD的异常变化代表南北向地下电导率变化和地下电导率不均匀, 因此谐波振幅比的变化与电导率异常带的分布一致, 表明谐波振幅比的变化与地下电性结构密切相关.Abstract: Based on the 1 second sampling geomagnetic data derived from the eight stations of geomagnetic array in Yunnan Province from June 1, 2012 to May 31, 2013, the temporal variations of the geomagnetic harmonic wave amplitude ratios were analyzed. It was found that both the geomagnetic harmonic wave amplitude ratios YZHy and YHD were enhanced just before the MS5.5 Eryuan earthquake on 3 March 2013, but no similar variation appeared for the ratio YZHx. In order to explain the result, both the temporal evolution of original vertical components (Z) and the distribution of Weiss vectors were analyzed, and it was found that there was an NS-oriented high conductivity layer on the underground. Considering that the ratios YZHy, YHD and YZHx are related with the variation of NS-oriented conductivity, the heterogeneity of underground electrical structure and the variation of EW-oriented conductivity, respec-tively, it was deduced that the variation of the geomagnetic harmonic wave amplitude ratios was closely related to the underground electrical structure.
-
-
![]()
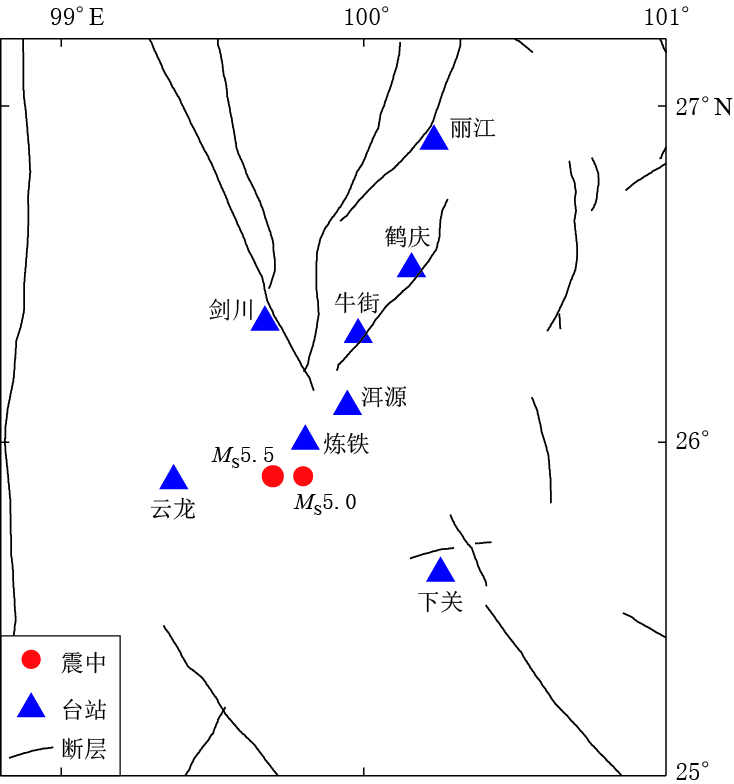
图 1 滇西北地磁台阵测点和两次洱源地震震中分布图
Figure 1. Locations of eight stations of north-western Yunnan geomagnetic array and the epicenters of two Eryuan earthquakes in 2013
![]()
图 2 云龙测点不同周期T内YZHx, YZHy和YHD变化曲线, 图中红线为均值加1倍方差
Figure 2. Temporal evolution of YZHx, YZHy and YHD for different periods T observed by the station Yunlong where the horizontal red line is the average value plus the standard deviation
![]()
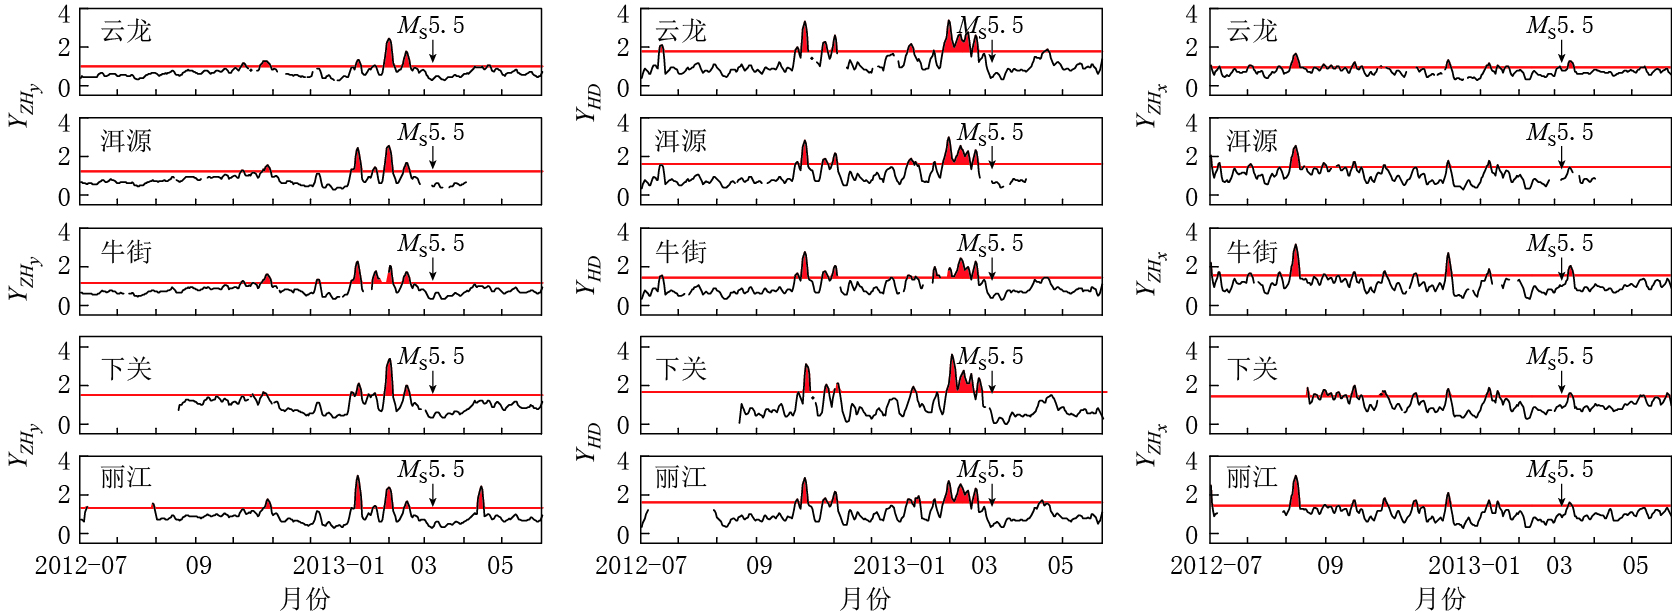
图 3 各测点周期为10分钟的YZHx, YZHy和YHD变化曲线, 图中红线为均值加1倍方差
Figure 3. Temporal evolution of YZHx, YZHy and YHD at the period of 10 minutes for five geomagnetic stations (Yunlong, Eryuan, Niujie, Xiaguan, Lijiang from the top down), where the horizontal red line is the average value plus the standard deviation
![]()
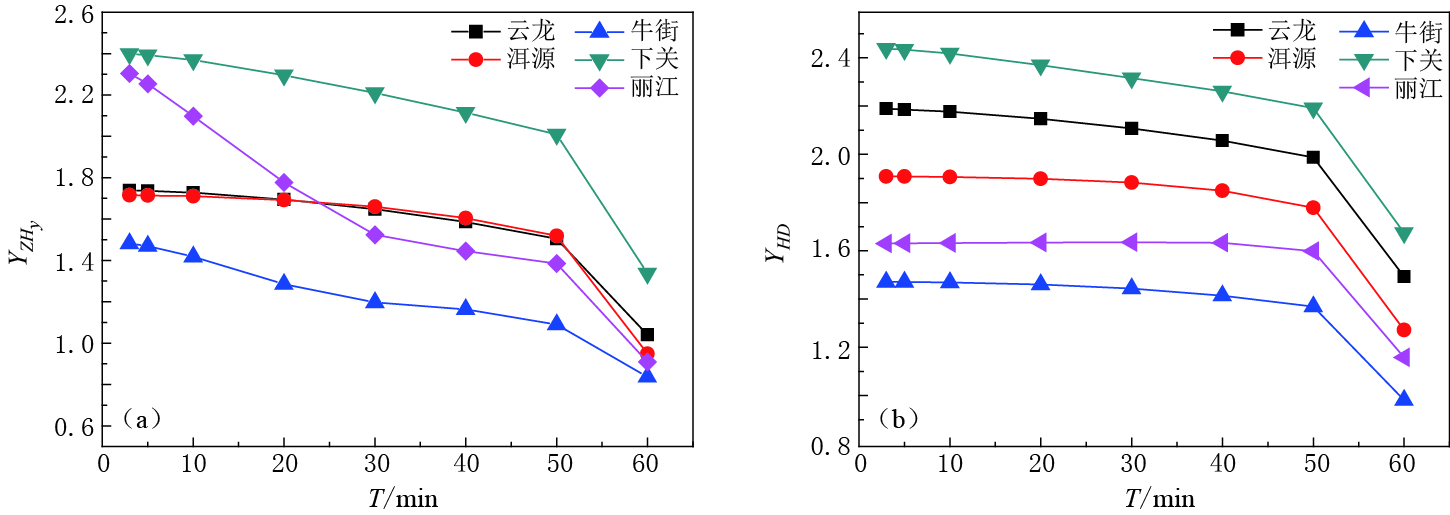
图 4 洱源MS5.5地震前各测点的YZHy(a)和YHD(b)异常最高幅度随周期T的变化
Figure 4. Maximum amplitude of geomagnetic harmonic wave amplitude ratios YZHy (a) and YHD (b) for five geomagnetic stations versus the period T before Eryuan MS5.5 earthquake
![]()
图 5 2012年9月3日滇西北地磁台阵三分量的原始数据曲线(阴影区表示Z分量反向变化的时段)
Figure 5. Temporal evolution of the original data recorded by the stations of northwestern Yunnan geomagnetic array on September 3, 2012 The shadow zone shows the period when Z component varied in opposite direction
![]()
图 6 周期为10分钟的实威斯矢量分布图
Figure 6. Distribution of Weiss vectors for the period of 10 minutes
表 1 滇西北地磁台阵各测点与两次洱源地震震中的距离
Table 1 The distance between the epicenters of two earthquakes in Eryuan region and the geomagnetic station of norrthwestern Yunnan geomagnetic array
测点名称 距离MS5.5地震震中距/km 距离MS5.0地震震中距/km 丽江 122.66 118.71 云龙 32.86 42.85 下关 64.30 55.88 剑川 51.08 52.55 洱源 33.80 27.38 炼铁 15.73 11.52 牛街 54.69 50.29 鹤庆 82.41 77.34  下载: 导出CSV
-
-
期刊类型引用(25)
1. 孙喜文,鲁铁定,贺小星,黄佳慧. 顾及RMLE的GNSS时序噪声特性及环境负载修正. 导航定位学报. 2024(01): 21-27+42 .  百度学术
百度学术
2. 余思,李辰风,唐婷婷,陈江贻. 顾及环境负荷的GNSS速度场分析. 大地测量与地球动力学. 2024(07): 732-736 . 百度学术
3. 余思,李辰风,唐婷婷. 赣鄂皖交界地区三维地壳运动特征分析. 地震地磁观测与研究. 2023(01): 44-50 . 百度学术
4. 金波文,王慧,刘玉龙,邓丽静,吕江华. 中国沿海海洋站GNSS坐标时间序列噪声模型的建立与分析(英文). Marine Science Bulletin. 2023(02): 63-74 . 百度学术
5. 任安康,徐克科,邵振华. GEONET网络GPS坐标时间序列噪声模型建立与分析. 导航定位学报. 2022(02): 141-151 . 百度学术
6. 郑博文,杜向峰,詹松辉,吴希文,王华. 中国大陆GPS连续站时间序列噪声分析. 广东工业大学学报. 2022(03): 70-76+82 . 百度学术
7. 王力斌,潘鹏飞,薛蛟. 武汉市CORS坐标时间序列中共模误差分析. 地理空间信息. 2022(06): 96-98 . 百度学术
8. 高启平. 基于速率的Allan方差的GPS坐标时间序列噪声特性分析. 科学技术创新. 2021(02): 117-118 . 百度学术
9. 霍景焕,马进全,张睿. GPS时间序列分析尼泊尔地震震后位移. 测绘地理信息. 2020(01): 40-43 . 百度学术
10. 金波文,王慧,刘玉龙,邓丽静,吕江华. 中国沿海海洋站GNSS坐标时间序列噪声模型的建立与分析. 大地测量与地球动力学. 2020(05): 476-481 . 百度学术
11. 薛天云. 藏南地区GPS时间序列分析. 地理空间信息. 2020(09): 66-69+7 . 百度学术
12. 刘志平,朱丹彤,余航,张克非. 等价条件平差模型的方差-协方差分量最小二乘估计方法. 测绘学报. 2019(09): 1088-1095 . 百度学术
13. 常金龙,甘卫军,梁诗明,张克亮. 大华北地区GPS时间序列共模误差的确定与分析. 地震研究. 2018(03): 430-437+489 . 百度学术
14. 蔡琅,肖根如,王建强,田莎莎. 国产接收机在形变监测应用中的可靠性分析——以新丰江水库为例. 测绘与空间地理信息. 2018(11): 49-54 . 百度学术
15. 宋爱虎,马超,周宁. 有色噪声对东南极区域GPS测站三维速度估计的影响. 测绘通报. 2017(10): 18-21 . 百度学术
16. 张风霜,畅柳. 基于有色噪声模型的GPS速度场精度与时间序列长度相关性研究. 地震. 2017(01): 92-102 . 百度学术
17. 贺小星,花向红,鲁铁定,余科根,宣伟. 时间跨度对GPS坐标序列噪声模型及速度估计影响分析. 国防科技大学学报. 2017(06): 12-18 . 百度学术
18. 张风霜. 有色噪声模型下云南地区GPS基准站速度与周期估计. 地震研究. 2016(03): 410-420 . 百度学术
19. 丁开华,丁剑,李志才,王兰立. 川滇地区陆态网络基准站运动噪声模型分析. 测绘科学. 2014(12): 56-60+50 . 百度学术
20. 许颖,岳东杰,袁豹. 基于最大熵谱估计的GPS坐标时间序列噪声分析. 大地测量与地球动力学. 2014(02): 60-63 . 百度学术
21. 芦琪,张小红. 中国境内IGS跟踪站精密单点定位坐标时间序列频谱分析. 大地测量与地球动力学. 2014(05): 64-69+74 . 百度学术
22. 谢树明,潘鹏飞,周晓慧. GPS坐标时间序列共模误差空间特性分析. 地理空间信息. 2014(04): 44-45+54+9 . 百度学术
23. 谢树明,潘鹏飞,周晓慧. 大空间尺度GPS网共模误差提取方法研究. 武汉大学学报(信息科学版). 2014(10): 1168-1173 . 百度学术
24. 王解先,连丽珍,沈云中. 奇异谱分析在GPS站坐标监测序列分析中的应用. 同济大学学报(自然科学版). 2013(02): 282-288 . 百度学术
25. 潘正洋,何建坤,卢双疆. 帕米尔高原现代地壳运动首期GPS观测及处理. 地球科学与环境学报. 2013(01): 103-110 . 百度学术
其他类型引用(17)


计量
- 文章访问数: 573
- HTML全文浏览量: 234
- PDF下载量: 25
- 被引次数: 42
