

Spatio-temporal evolution of electromagnetic field pre- and post-earthquakes
-
摘要: 本文利用DEMETER卫星观测到的电磁场数据, 统计分析了2005—2009年全球MS≥7.0强震前后空间电磁场的时空演化特征. 在震中上空±10°范围内, 使用震前90天至震后30天的5年同期观测到的电磁场极低频/甚低频(370—897 Hz)功率谱密度数据构建了稳定的背景场观测模型, 提取了震中上空的空间电磁场相对于背景场的扰度幅度, 并统计分析了强震前后空间电磁场的时空演化特征. 统计结果显示: 45次MS≥7.0强震中, 35次强震在地震发生前后磁场最大扰动幅度超过2.2倍标准差, 39次强震的电场最大扰动幅度超过2倍标准差; 最大的电磁扰动主要出现在震中±4°—±10°范围内. 另外, 震中上空的电磁场扰动幅度时序变化表现为3种不同类型的扰动特征, 且震前出现电磁异常的强震震中位置的分布特征与纬度存在一定关系; 而随机选择的非震区上空空间电磁场的扰动幅度则比较小, 未呈现出明显的特征.Abstract: Utilizing the electromagnetic field observations of DEMETER satellite, we statistically analyze the spatio-temporal evolution of electromagnetic field during the strong earthquakes with magnitude over than 7.0 occurred from 2005 to 2009. For each earthquake, using the power spectral density data of electromagnetic field in the ELF/VLF frequency band (370—897 Hz) from 90 days before the earthquake to 30 days after the earthquake, in the area within ±10° in latitude and in longitude from the epicenter, the background model is built up with the same period. A formula is applied to extract the perturbation amplitude of the electromagnetic field relative to the background field observation model during the earthquake time, and the perturbation amplitude is used to statistically study the spatio-temporal variations of electro-magnetic field for the 45 earthquakes, which had been chosen in this paper. Statistical analyses on the perturbation amplitude of magnetic field shows that 35 earthquakes exhibit anomaly that the maximum of perturbation amplitude exceeds 2.2 times standard deviation, while the result of the electric field shows that 39 strong earthquakes exhibit anomalies with the maximum perturbation higher than twice standard deviation, and the maximum electromagnetic perturbations mainly appear in the places within ±4° to ±10° in latitude and in longitude from the epicenter. The temporal variation of the perturbation amplitude shows there are three types of variation patterns. The abnormal electromagnetic perturbation that occurs before earthquakes displays that the distribution of epicenters is related to latitude. However, the perturbation amplitude of electromagnetic field over the random non-earthquake region is weak, without displaying prominent characteristic of anomalous variation.
-
-
![]()
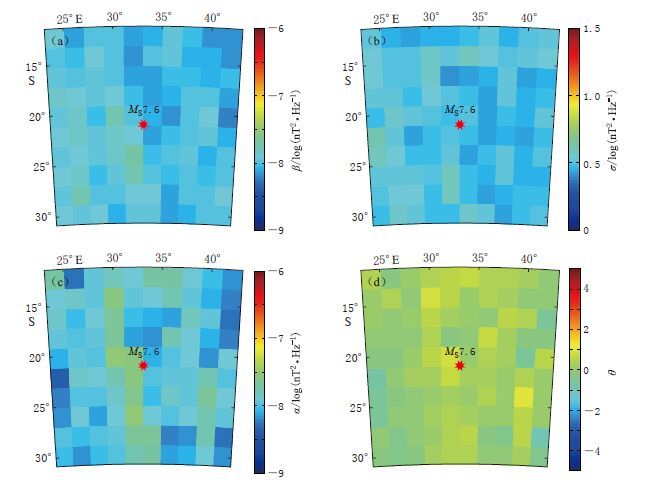
图 1 莫桑比克MS7.6地震震中±10°范围内磁场扰动幅度矩阵θ的构建过程 (a)利用5年(2005-2009年)同期(11月24日-3月24日)震前90天至震后30天的变化磁场功率谱 密度数据构建的背景场中值矩阵β;(b)由5年(2005-2009年)同期震前90天至震后30天的 变化磁场功率谱密度数据构建的背景场标准方差矩阵σ;(c)由2005年11月24日-12月 24日的磁场功率谱密度数据构建的中值矩阵α;(d)根据式(2)计算所得的矩阵θ
Figure 1. Constructing process of the magnetic perturbation amplitude matrix θ in the studied area (a)Background median matrix β calculated by magnetic power spectral density(PSD)data during the same period(November 24 to March 24 of the next year)within five years(from 2005 to 2009); (b)Background standard deviation matrix σ computed by magnetic PSD data during the same period(November 24 to March 24 of tne next year)within five years(from 2005 to 2009); (c)Median matrix α obtained with magnetic PSD data from November 24 to December 24, 2005;(d)Magnetic field perturbation amplitude matrix θ obtamed by formula(2)
![]()
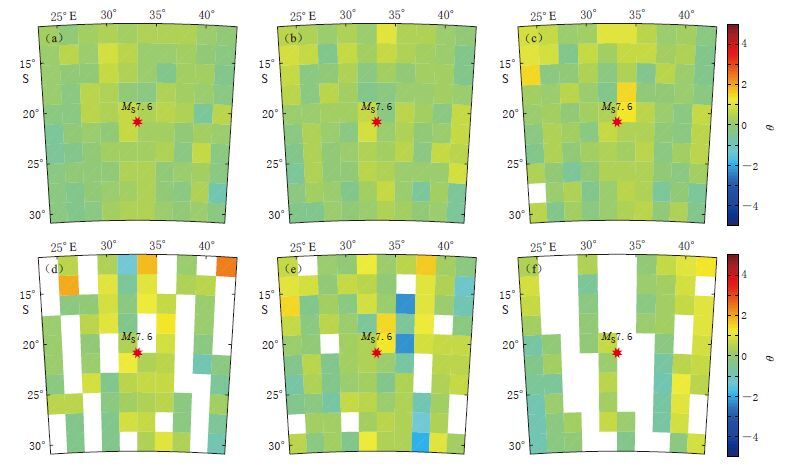
图 2 2006年莫桑比克MS7.6地震前后极低频/甚低频(370-897Hz)磁场(θ矩阵)时空演化特征 (a)2005-11-24-2005-12-24;(b)2005-12-24-2006-01-23;(c)2006-01-23-2006-02-07; (d)2006-02-07-2006-02-22;(e)2006-02-22-2006-03-09;(f)2006-03-09-2006-03-24
Figure 2. Spatio-temporal evolution of the magnetic field(matrix θ)at frequency band of ELF/VLF (370-897 Hz)during the Mozambique MS7.6 earthquake in 2006 (a)From November 24 to December 24,2005;(b)From December 24,2005 to January 23,2006;(c)From January 23 to February 7,2006;(d)From February 7 to 22,2006; (e)From February 22 to March 9,2006;(f)From March 9 to 24,2006
![]()
图 3 2006年莫桑比克地震前后空间电场(θ矩阵)的时空演化特征 (a)2005-11-24-2005-12-24;(b)2005-12-24-2006-01-23;(c)2006-01-23-2006-02-07; (d)2006-02-07-2006-02-22;(e)2006-02-22-2006-03-09;(f)2006-03-09-2006-03-24
Figure 3. Spatio-temporal evolution of electric field(matrix θ)during the Mozambique earthquake (a)From November 24 to December 24,2005;(b)From December 24,2005 to January 23,2006; (c)From January 23 to February 7,2006;(d)From February 7 to 22,2006; (e)From February 22 to March 9,2006;(f)From March 9 to 24,2006
![]()
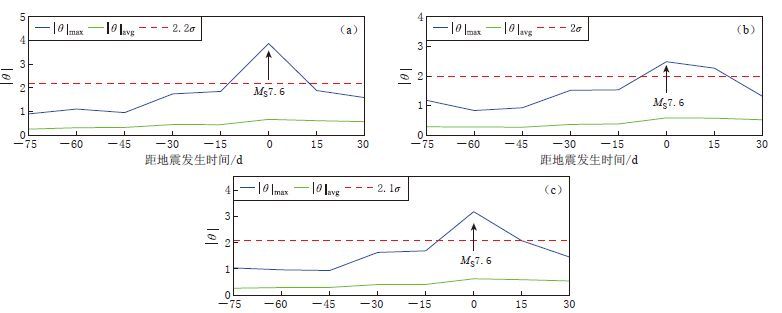
图 4 2005年11月24日-2006年3月24日最大扰动幅度|θ|max与平均扰动幅度|θ|avg的时序变化特征.(a)磁场扰动;(b)电场扰动;(c)电磁场扰动
Figure 4. The temporal variation of the perturbation amplitude value of |θ| from November 24,2005 to March 24,2006(a)Perturbation amplitude |θ| at magnetic field;(b)Perturbation amplitude |θ| at electric field; (c)Perturbation amplitude |θ| at electromagnetic field. |θ|max represents maximum of |θ|,|θ|avg represents the mean of |θ|,σ denotes standard deviation
![]()
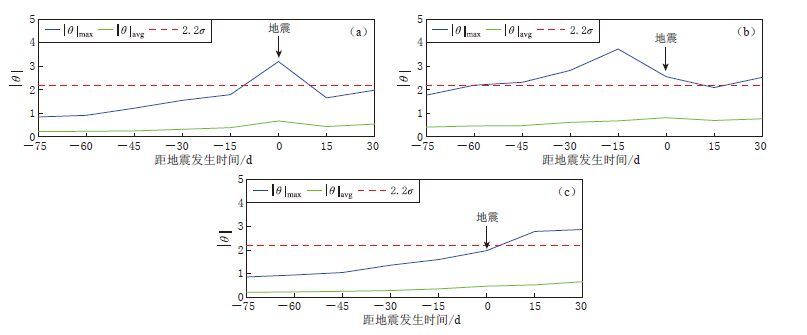
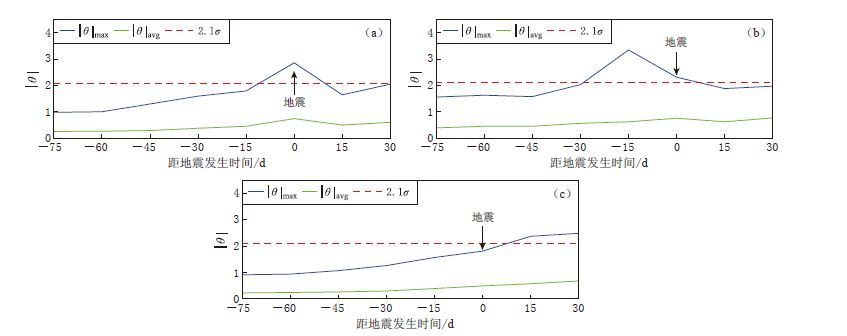
图 5 强震前后变化磁场相对于背景场的最大扰动幅度|θ|max和平均扰动幅度|θ|avg的时序变化类型 (a)第一类扰动;(b)第二类扰动;(c)第三类扰动
Figure 5. The temporal variation of the maximum perturbation amplitude |θ|max and average perturbation amplitude |θ|avg of the magnetic field during the strong earthquakes (a)The first type;(b)The second type;(c)The third type
![]()
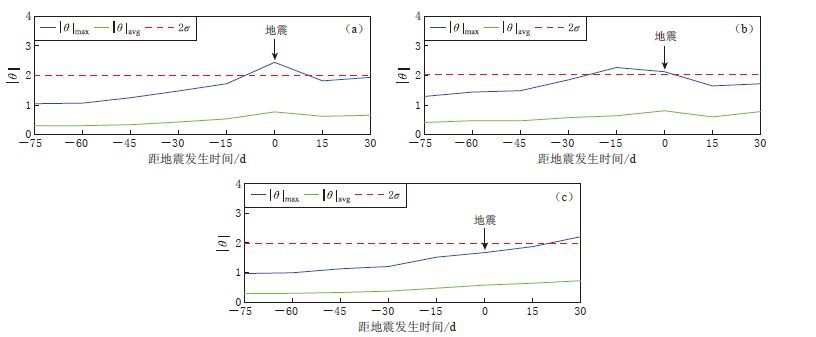
图 6 强震前后电场相对于背景场的最大扰动幅度|θ|max和平均扰动幅度|θ|avg的时序变化类型 (a)第一类扰动;(b)第二类扰动;(c)第三类扰动
Figure 6. The temporal variation of the maximum perturbation amplitude |θ|max and average perturbation amplitude |θ|avg for the electric field during the strong earthquakes (a)The first type;(b)The second type;(c)The third type
![]()
图 7 强震前后空间电磁场相对于背景场的最大扰动幅度|θ|max和平均扰动幅度|θ|avg的时序变化 (a)第一类;(b)第二类;(c)第三类
Figure 7. The temporal variation of maximum perturbation amplitude |θ|max and average perturbation amplitude |θ|avg of spatial electromagnetic field (a)The first type;(b)The second type;(c)The third type
![]()
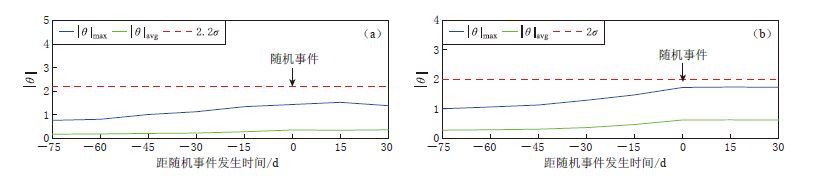
图 8 随机非震区上空电磁场相对于背景场的扰动幅度时序变化 (a)变化磁场扰动幅度;(b)电场扰动幅度
Figure 8. The temporal variation of the perturbation amplitude over the random non-earthquake region (a)Perturbation amplitude of magnetic field;(b)Perturbation amplitude of electric field
![]()
图 9 磁场观测(a)和电场观测(b)所获得的具有不同扰动类型的地震震中分布
Figure 9. Distribution of epicenters for three perturbation types revealed by the magnetic observations(a)and electric measurements(b)The red solid circles represent the first type,the green triangles represent the second type,and the blue squares indicate the third type
-
国家地震科学数据共享中心.2015.中国地震台网统一地震目录[EB/OL].[2015-09-18].http://data.earthquake.cn/data/index.jsp. China Earthquake Data Center.2015.Uniform earthquake catalog of China Earthquake Networks Center[EB/OL].[2015-09-18].http://data.earthquake.cn/data/index.jsp.
 下载:
下载:


计量
- 文章访问数: 580
- HTML全文浏览量: 255
- PDF下载量: 25
