

Characteristics of source parameters of the Shanxi Reservoir earthquakes in Zhejiang region
-
摘要: 利用2014年1月-2015年12月浙江省区域数字地震台网记录的1 360次珊溪水库ML0.5-4.4地震资料,采用Brune模式,将台站获取的速度记录进行几何扩散校正、介质衰减校正及仪器校正后得到速度谱,对速度谱在频率域进行傅里叶积分得到震源位移谱,之后使用遗传算法计算得到拐角频率和震源位移谱零频极限值,进而计算出该区的地震矩为1010-1014 N·m,震源破裂半径为33-550 m,拐角频率为2.4-39.7 Hz,地震应力降为0.04-6.74 MPa,视应力为0-2.75 MPa.在此基础上,对各参数特征及其关系进行系统性分析,结果表明:各震源参数之间表现出一定的对数线性或半对数线性关系;空间上,应力降和拐角频率在库区西北段较高,东南段较低;应力降与地震矩在空间上呈反向关系,拐角频率与破裂半径在空间上呈负相关.Abstract: According to the seismic data of 1 360 earthquakes with ML0.5-4.4 occurred in Shanxi Reservoir from January of 2014 to December of 2015, which were recorded by the Regional Digital Seismic Network of Zhejiang Province, this paper obtains the source displacement spectra by using Fourier integration of velocity spectrum in the frequency field based on the Brune's model, after the geometrical diffusion correction, medium attenuation correction and instrument correction of the velocity records from the stations, and then the corner frequency and the source displacement spectra at the zero frequency are acquired with the genetic algorithm. And then the radius of the epicenter, the seismic moments and other small local earthquake source parameters are calculated. Furthermore, this paper systematically analyzes the characteristics of the source parameters and the relationship among the parameters. The results show that: seismic moment ranges 1010-1014 N·m, the range of source radius is 33-550 m, the corner frequency ranges 2.4-39.7 Hz, seismic stress drop is in the range of 0.04-6.74 MPa, and apparent stress is in the range of 0-2.75 MPa. The result also show that there is some log-linear or semi-logarithmic linear relationships among the seismic moment, corner frequency, Richter magnitude, moment magnitude and other source parameters. In the space domain, the stress drop and the corner frequency are higher at northwest section of Shanxi Reservoir area and lower at southeast section. In addition, there is opposite relationship between the stress drop and the seismic moment in space, meanwhile the corner frequency is negatively correlated to the source radius in space.
-
本目录中的地震参数来自“中国地震台站观测报告”(简称“月报”). 其中, 国内及邻区给出M≥4.7的事件, 全球给出M≥6.0的事件. “月报”由中国地震台网中心按月做出.
本目录中的发震时刻采用协调世界时(UTC); 为了方便中国读者, 也给出北京时(BTC). 震中位置除给出经纬度外, 还给出参考地区名, 它仅用作查阅参考, 不包含任何政治意义; 还给出测定震源位置的台数(n)和标准偏差(SD).
面波震级MS是用中周期宽频带SK地震仪记录, 采用北京台1965年面波震级公式MS=lg(AH/T)+1.66 lg(Δ)+3.5 (1°<Δ<130°)求得, AH是两水平分向最大面波位移的矢量合成位移; MS7是对763长周期地震仪记录, 采用国际上推荐的面波震级公式MS7=lg(AV/T)+1.66 lg(Δ)+3.3 (20°<Δ<160°)求得; AV是垂直向面波最大地动位移; mb是短周期体波震级; ML是近震震级. 为避免混乱, 震级之间一律不换算.
表 1 中国及邻区地震目录(2016年1—2月, M≥4.7)Table 1. Catalog of earthquakes within and near China (January--February, 2016, M≥4.7)编号 发 震 时 刻 地 理 坐 标 深
度
/km震级 标准
偏差(SD)使用
台数
(n)地 区 UTC BTC
日-时纬度
/°N经度
/°EMS MS7 ML mb 月-日 时:分:秒 1 01-02 04:22:19.6 02-12 44.81 129.95 580 6.1 1.5 85 中国东北部 2 04 10:27:01.9 04-18 43.58 82.97 7 4.3 4.1 4.9 4.6 2.3 67 新疆自治区北部 3 13 20:34:56.8 14-04 32.62 91.67 10 5.5 5.3 5.2 4.8 2.2 76 西藏自治区 4 13 21:18:14.1 14-05 42.19 84.12 8 5.1 5.0 5.6 5.2 3.1 73 新疆自治区南部 5 13 21:37:37.5 14-05 38.68 73.17 37 4.6 4.4 5.1 4.9 1.5 75 塔吉克斯坦 6 19 02:13:25.4 19-10 22.88 121.45 30 5.6 5.2 5.6 5.0 1.6 100 台湾岛 7 20 17:13:12.0 21-01 37.66 101.65 10 6.6 6.4 6.0 5.7 2.3 94 青海省 8 21 19:22:39.4 22-03 27.81 84.80 22 4.8 4.7 4.4 2.2 49 尼泊尔—印度边境地区 9 02-02 07:00:57.9 02-15 40.04 77.72 8 4.2 4.1 4.9 4.5 2.1 52 新疆自治区南部 10 02 14:19:21.2 02-22 25.35 123.43 200 5.8 1.6 104 台湾地区 11 05 16:20:09.5 06-00 28.17 85.62 7 4.4 4.2 4.7 1.5 82 尼泊尔 12 05 19:57:25.7 06-03 22.94 120.54 15 6.7 6.7 6.6 5.7 1.9 93 台湾岛 13 09 00:47:00.5 09-08 24.06 121.79 10 5.3 5.2 5.2 4.6 1.7 93 台湾岛 14 11 13:10:57.4 11-21 43.60 82.59 10 4.4 4.0 5.0 4.7 3.4 76 新疆自治区北部 15 18 01:09:39.5 18-09 23.06 120.89 10 5.0 4.8 5.1 4.5 1.6 98 台湾岛 16 18 01:18:32.4 18-09 23.01 120.91 11 4.7 4.5 4.7 4.4 1.8 70 台湾岛 17 21 18:09:59.9 22-02 28.13 84.88 13 4.3 4.1 4.7 1.6 73 尼泊尔—印度边境地区 18 23 00:33:35.4 23-08 31.90 95.03 9 4.7 4.6 4.4 4.6 2.2 79 西藏自治区 19 29 19:47:34.8 01-03 23.72 123.65 31 5.0 4.9 5.0 4.7 1.4 88 琉球群岛西南部 表 2 全球地震目录(2016年1—2月, M≥6.0)Table 2. Catalog of earthquakes all over the world (January--February, 2016, M≥6.0)编号 发 震 时 刻 地 理 坐 标 深
度
/km震级 标准
偏差(SD)使用
台数
(n)地 区 UTC BTC
日-时纬度
/°经度
/°MS MS7 mb 月-日 时:分:秒 1 01-01 02:00:39.0 01-10 50.60S 139.40E 10 6.2 6.1 5.6 2.1 83 澳大利亚以南地区 2 02 04:22:19.6 02-12 44.81N 129.95E 580 6.1 1.5 85 中国东北部 3 03 23:05:18.8 04-07 24.79N 93.58E 60 6.4 6.4 6.1 1.9 98 缅甸—印度边境地区 4 11 16:38:03.2 12-00 3.83N 126.85E 10 6.7 6.5 5.9 0.9 99 塔劳群岛 5 14 03:25:30.0 14-11 42.04N 142.86E 55 6.7 6.5 6.5 1.6 97 北海道地区 6 20 17:13:12.0 21-01 37.66N 101.65E 10 6.6 6.4 5.7 2.3 94 青海省 7 21 18:06:57.3 22-02 18.79N 106.95W 10 6.8 6.6 5.5 2.5 73 墨西哥哈利斯科海岸
近海8 24 10:30:26.5 24-18 59.71N 153.51W 120 6.4 0.9 96 阿拉斯加州南部 9 25 04:22:01.1 25-12 35.67N 3.65W 10 6.9 6.9 5.6 1.7 97 直布罗陀海峡 10 26 03:10:19.0 26-11 5.33S 153.19E 20 6.0 5.8 5.7 1.7 101 新不列颠地区 11 30 03:25:08.3 30-11 54.00N 158.60E 160 6.2 1.7 95 堪察加东海岸近海 12 02-05 19:57:25.7 06-03 22.94N 120.54E 15 6.7 6.7 5.7 1.9 93 台湾岛 13 08 16:19:12.3 09-00 6.58S 154.78E 30 6.4 6.2 6.2 2.5 101 所罗门群岛 14 10 00:33:05.0 10-08 30.44S 71.49W 30 6.5 6.5 1.3 101 中智利海岸近海 15 12 10:02:22.8 12-18 9.58S 119.27E 30 6.0 5.9 6.4 1.6 104 松巴哇以南地区 16 17 17:25:57.7 18-01 0.43N 129.50E 27 6.0 5.9 5.3 0.9 101 查伊洛洛贾洛洛(哈马黑拉)岛 17 22 06:37:03.0 22-14 30.40S 71.90W 10 6.1 6.0 2.0 74 中智利海岸近海 -
![]()
图 1 2014年10月25日珊溪水库ML4.4地震的位移谱计算过程实例
(a)单台(泰顺台)震源谱与噪声谱比较;(b)多台站震源谱及其平均值和多台数据拟合结果
Figure 1. An example for calculating the seismic displacement spectra of the ML4.4 earthquake occurred in Shanxi Reservoir on 25 October 2014
(a) Comparison of the source spectrum recorded by Taishun station with noise spectrum. Blue line represents north-south and east-west observation spectra in NS and EW direction; red line represents the average observation spectra, black dotted line indicates the noise spectrum. (b) Source spectra (blue lines) and their average spectrum (green line) as well as data fitting of spectra of a series of stations by using the ω2 model (red line)
![]()
图 2 珊溪水库库区地震震中与台站的分布,图(b)为图(a)中方框的放大图
Figure 2. Distribution of earthquake epicenters (dots) and stations (triangles) in Shanxi Reservoir Fig.(b) is amplification of the square in Fig.(a)
![]()
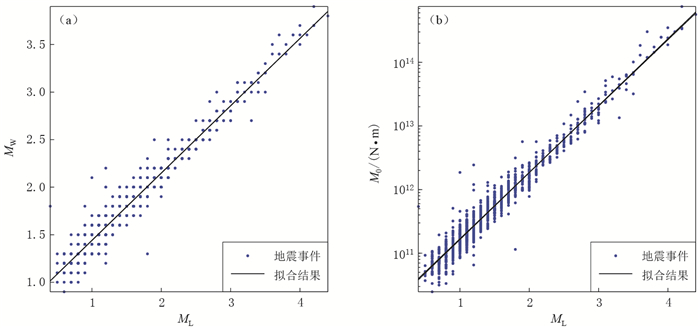
图 3 (a) MW与ML拟合的定标关系;(b) M0与ML拟合的定标关系
Figure 3. (a) Scaling relation between MW and ML; (b) Scaling relation between M0 and ML
![]()
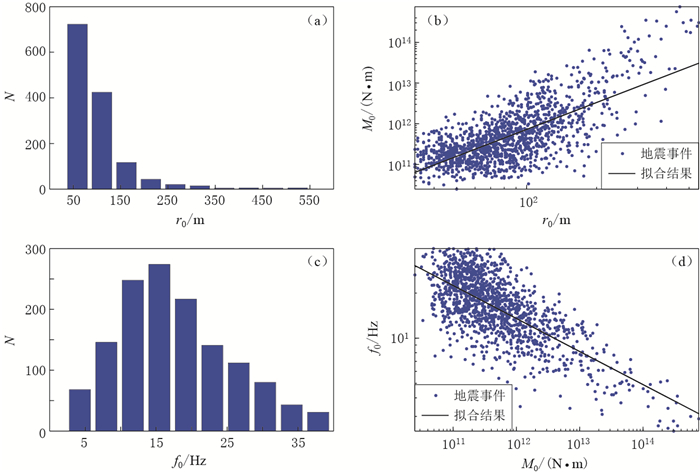
图 4 破裂半径r0,拐角频率f0的分布直方图以及地震矩M0与r0和f0的定标关系
(a) r0分布直方图;(b) M0与r0拟合的定标关系;(c) f0分布直方图;(d) f0与M0拟合的定标关系
Figure 4. Histograms of source radius r0 and corner frequency f0 as well as scaling relation between M0, r0 and f0
(a) Histogram of r0; (b) Scaling relation between M0 and r0; (c) Histogram of f0; (d) Scaling relation between f0 and M0
![]()
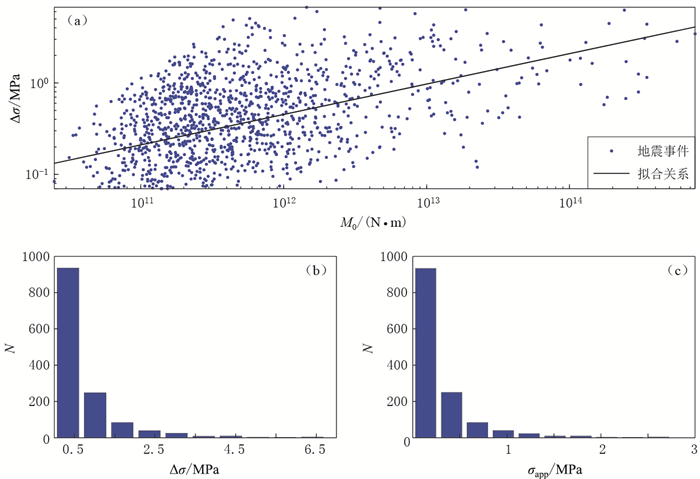
图 5 应力降Δσ与地震矩M0的定标关系及Δσ和σapp分布直方图
(a) Δσ与M0拟合的定标关系;(b) Δσ分布直方图;(c) σapp分布直方图
Figure 5. Distribution of stress drop Δσ, seismic moment M0 and apparent stress σapp
(a) Scaling relation between Δσ and M0; (b) Histogram of Δσ; (c) Histogram of σapp
![]()
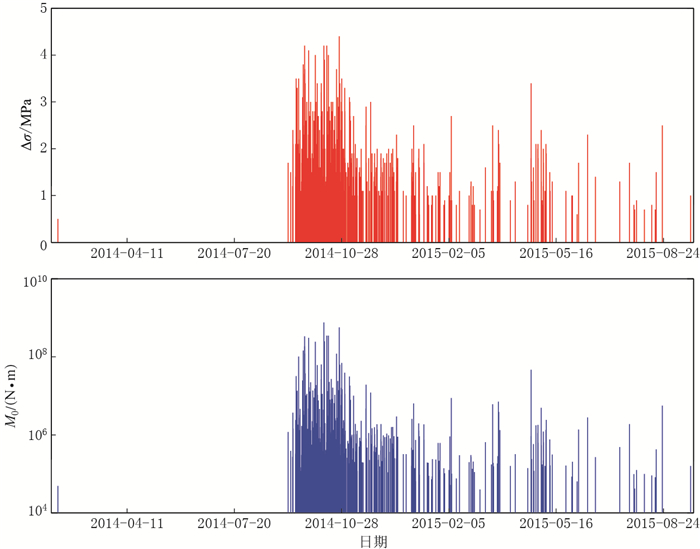
图 6 应力降Δσ(a)和地震矩M0 (b)随时间的变化
Figure 6. Variation of stress drop Δσ (a) and seismic moment M0 (b) with time
![]()
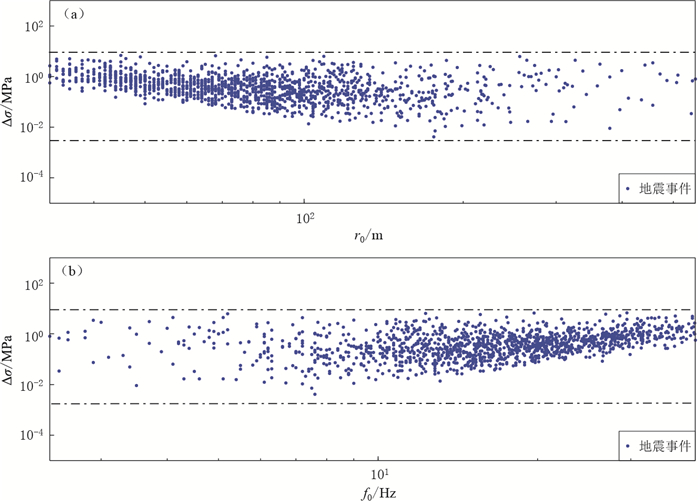
图 7 应力降Δσ与破裂半径r0 (a)和拐角频率f0 (b)的关系
Figure 7. Distribution of data fitting between stress drop Δσ and source radius r0 (a) and Δσ and corner frequency f0 (b)
![]()
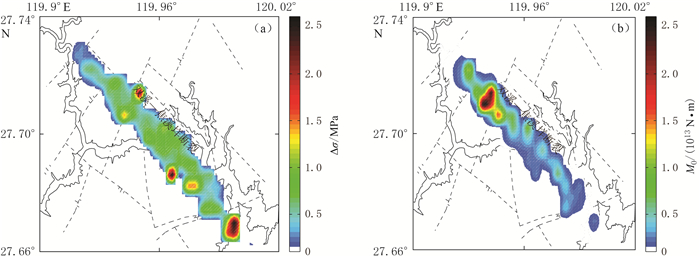
图 8 珊溪水库库区应力降Δσ (a)和地震矩M0 (b)空间分布图
Figure 8. Distribution of stress drop Δσ (a) and seismic moment M0 (b) in the Shanxi Reservoir region
![]()
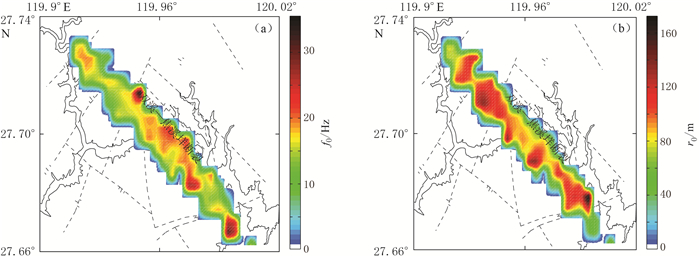
图 9 珊溪水库库区拐角频率f0(a)和破裂半径r0(b)的空间分布
Figure 9. Distribution of corner frequency f0 (a) and source radius r0 (b) in the region of Shanxi Reservoir
表 1 本文与于俊谊和朱新运(2008)关于珊溪水库库区震源参数拟合定标关系结果对比
Table 1 Comparison of fitting scaling relations of source parameters in the Shanxi Reservoir between this paper and Yu and Zhu (2008)
关系式 k1 k2 本文 于俊谊和朱新运(2008) 本文 于俊谊和朱新运(2008) MW=k1ML+k2 0.708 0.74 0.732 0.70 lgM0=k1ML+k2 1.052 1.11 10.16 10.11 lgM0=k1lgr0+k2* 2.195 7.471 lgM0=k1r0* 0.0061 11.71 lgf0=k1lgM0+k2 -0.221 -0.26 3.779 3.97 lgΔσ=k1lgM0+k2 0.332 0.281 1.667 2.158 *关于M0与r0的定标关系,于俊谊和朱新运(2008)采用M0对数与r0拟合,本文采用M0对数与r0对数拟合;若采用M0对数与r0拟合,本文所得结果为k1=0.007 1和k2=10.967,与于俊谊和朱新运(2008)结果近似.  下载: 导出CSV
-
陈培善, Duda S J. 1993.峰值速度和加速度对环境剪应力的依赖性[J].地震学报, 36 (2): 185-194. http://www.dzxb.org/Magazine/Show?id=28525 Chen P S, Duda S J. 1993. Dependence of peak acceleration and peak velocity on the environment shear stress[J]. Acta Seismologica Sinica, 36 (2): 185-194. http://www.dzxb.org/Magazine/Show?id=28525
陈运泰, 吴忠良, 王培德, 许力生, 李鸿吉, 牟其铎. 2000.数字地震学[M].北京:地震出版社: 1-172. Chen Y T, Wu Z L, Wang P D, Xu L S, Li H J, Mu Q D. 2000. Digital Seismology[M]. Beijing: Seismological Press: 1-172 (in Chinese).
于俊谊, 朱新运. 2008.浙江珊溪水库地震震源参数研究[J].中国地震, 24 (4): 379-387. http://www.cnki.com.cn/Article/CJFDTOTAL-ZGZD200804008.htm Yu J Y, Zhu X Y. 2008. Hypocentral parameters research of the Shanxi reservoir area in Zhejiang[J]. Earthquake Research in China, 24 (4): 379-387 (in Chinese). http://www.cnki.com.cn/Article/CJFDTOTAL-ZGZD200804008.htm
张帆, 朱新运, 钟羽云. 2013.珊溪水库地震小震震源机制解特征研究[J].地震工程学报, 35 (3): 684-691. http://www.cnki.com.cn/Article/CJFDTOTAL-ZBDZ201303045.htm Zhang F, Zhu X Y, Zhong Y Y. 2013. Study on the characteristic of focal mechanism solutions of the Shanxi reservoir earthquake[J]. China Earthquake Engineering Journal, 35 (3): 684-691 (in Chinese). http://www.cnki.com.cn/Article/CJFDTOTAL-ZBDZ201303045.htm
钟羽云, 朱新运, 张震峰. 2004.温州珊溪水库ML3.9震群震源参数特征[J].地震, 24 (3): 107-114. http://www.cnki.com.cn/Article/CJFDTotal-DIZN200403015.htm Zhong Y Y, Zhu X Y, Zhang Z F. 2004. Source parameter characteristics of ML3.9 earthquake swarm occurred in Shanxi reservoir, Wenzhou, Zhejiang Province[J]. Earthquake, 24 (3): 107-114 (in Chinese). http://www.cnki.com.cn/Article/CJFDTotal-DIZN200403015.htm
朱新运, 钟羽云, 张震峰. 2004.地震波拐角频率对地震序列的依赖性研究[J].西北地震学报, 26 (2): 131-136. http://www.cnki.com.cn/Article/CJFDTOTAL-ZBDZ200402006.htm Zhu X Y, Zhong Y Y, Zhang Z F. 2004. Study on seismic wave corner frequency depending on earthquake sequences[J]. Northwestern Seismological Journal, 26 (2): 131-136 (in Chinese). http://www.cnki.com.cn/Article/CJFDTOTAL-ZBDZ200402006.htm
朱新运, 张帆. 2006.浙江及邻区尾波Q值研究[J].西北地震学报, 28 (2): 108-113. http://www.cnki.com.cn/Article/CJFDTotal-ZBDZ200602002.htm Zhu X Y, Zhang F. 2006. Research on coda Q value in Zhejiang Province and neighbouring areas[J]. Northwestern Seismological Journal, 28 (2): 108-113 (in Chinese). http://www.cnki.com.cn/Article/CJFDTotal-ZBDZ200602002.htm
朱新运, 陈运泰. 2007.用Lg波资料反演场地效应与地震波衰减参数[J].地震学报, 29 (6): 569-580. http://www.dzxb.org/Magazine/Show?id=26451 Zhu X Y, Chen Y T. 2007. An inversion of site response and Lg attenuation using Lg waveform[J]. Acta Seismologica Sinica, 29 (6): 569-580 (in Chinese). http://www.dzxb.org/Magazine/Show?id=26451
朱新运, 于俊谊. 2008.基于MATLAB的小震震源参数计算软件研制[J].西北地震学报, 30 (4): 380-384. http://www.cnki.com.cn/Article/CJFDTOTAL-ZBDZ200804012.htm Zhu X Y, Yu J Y. 2008. The data processing software of source parameters for middle or small earthquakes based on MATLAB[J]. Northwestern Seismological Journal, 30 (4): 380-384 (in Chinese). http://www.cnki.com.cn/Article/CJFDTOTAL-ZBDZ200804012.htm
朱新运, 张帆, 于俊谊. 2010.浙江珊溪水库地震精细定位及构造研究[J].中国地震, 26 (4): 380-390. http://www.cnki.com.cn/Article/CJFDTOTAL-ZGZD201004005.htm Zhu X Y, Zhang F, Yu J Y. 2010. Study on precise positioning and structure of the Shanxi reservoir earthquake, Zhejiang Province[J]. Earthquake Research in China, 26 (4): 380-390 (in Chinese). http://www.cnki.com.cn/Article/CJFDTOTAL-ZGZD201004005.htm
Aaron M, Jorge A, Kojiro I. 2000. Inversion of source parameters and site effects from strong ground motion records using genetic algorithms[J]. Bull Seismol Soc Am, 90 (4): 977-992. doi: 10.1785/0119990007
Aki K. 1980. Attenuation of shear-waves in the lithosphere for frequencies from 0.05 to 25 Hz[J]. Phys Earth Planet Inter, 21 (1): 50-60. doi: 10.1016/0031-9201(80)90019-9
Bindi D, Spallarossa D, Augliera P, Cattaneo M. 2001. Source parameters estimated from the aftershocks of the 1997 Umbria Marche (Italy) seismic sequence[J]. Bull Seismol Soc Am, 91 (3): 448-455. doi: 10.1785/0120000084
Brune J N. 1970. Tectonic stress and the spectra of seismic shear waves from earthquakes[J]. J Geophys Res, 75 (26): 4997-5009. doi: 10.1029/JB075i026p04997
Brune J N. 1971. Correction[J]. J Geophys Res, 76 (20): 5002. doi: 10.1029/JB076i020p05002
Chael E P. 1987. Spectral scaling of earthquakes in the Miramichi region of New Brunswick[J]. Bull Seismol Soc Am, 77 (2): 347-365.
Giampiccolo E, D′Amico S, Patanè D, Gresta S. 2007. Attenuation and source parameters of shallow microearthquakes at Mt. Etna Volcano, Italy[J]. Bull Seismol Soc Am, 97 (1B): 184-197. doi: 10.1785/0120050252
Herrmann R B. 1980. Q estimates using the coda of local earthquakes[J]. Bull Seismol Soc Am, 70 (2): 447-468. http://cn.bing.com/academic/profile?id=2054846959&encoded=0&v=paper_preview&mkt=zh-cn
Kanamori H. 1977. The energy release in great earthquakes[J]. J Geophys Res, 82 : 2981-2987. doi: 10.1029/JB082i020p02981
Matsunmni K, Nakamura M. 2004. Seismic attenuation in a nonvolcanic swarm region beneath Wakayama, southwest Japan[J]. J Geophys Res, 109 (B9): B09302. http://cn.bing.com/academic/profile?id=2063020719&encoded=0&v=paper_preview&mkt=zh-cn
Rautian T G, Khalturin V I. 1978. The use of the coda for determination of earthquake source spectrum[J]. Bull Seismol Soc Am, 68 (4): 923-948.
Shi J H, Kim W Y, Paul G R. 1998. The corner frequencies and stress drops of intraplate earthquakes in the northeastern United States[J]. Bull Seismol Soc Am, 88 (2): 531-542. http://cn.bing.com/academic/profile?id=2277660255&encoded=0&v=paper_preview&mkt=zh-cn
Zhu X Y. 2014. An inversion of Lg-wave attenuation and site response from seismic spectral ratios in the eastern China region[J]. Bull Seismol Soc Am, 104 (3): 1389-1399. doi: 10.1785/0120120359.


计量
- 文章访问数: 675
- HTML全文浏览量: 289
- PDF下载量: 40
