

Comparision among different methods for assessing monitoring capability of seismic station in North-South Seismic Belt
-
摘要: 为探讨不同地震台网监测能力评估方法的结果差异性及其原因,本文选用目前国际上比较前沿的“基于概率的完整性震级”(PMC)方法和“完整性震级范围”(EMR)方法,以及中国地震台网常规采用的“震级-最大距离”方法,对2008年10月1日—2015年9月17日南北地震带地区表征地震监测能力的最小完整性震级进行了比较研究.研究中考虑了以往关注不够的地震观测质量一致性问题,统一采用至少3个台站记录的地震资料.结果显示,3种方法的结果差异显著,最小完整性震级的差值在南北地震带个别地区甚至可达ML2.0,其中,PMC方法获得的最小完整性震级Mp值在32°N以北地区显著低于其它两种方法,震级-最大距离方法获得的最小完整性震级Mr低值结果仅与高台站密度地区有关,与包括EMR方法获得的最小完整性震级McEMR相比较在统计均值上则呈McEMR < Mp < Mr.进一步对各地震台站的地震检测能力进行评分,结果显示,台站运维水平和对记录地震分析的完整程度,是造成Mp值显著不同于其它方法结果的主要原因,而是否选用相同的记录台站数量等数据质量约束标准,会造成EMR方法与其它方法结果的显著差异.因此,考虑到地震台网运行的实际情况和不同评估方法的计算原理,推荐PMC方法用于地震监测能力的评估.
-
关键词:
- 最小完整性震级ML /
- 地震检测能力 /
- 基于概率的完整性震级(PMC)方法 /
- 完整性震级范围(EMR)方法
Abstract: In order to explore the differences and causes of the methods for assessing monitoring capability of different seismic networks, this paper chooses the "probability-based magnitude of completeness" (PMC) and "entire-magnitude-range"(EMR) methods which are the relatively frontier in the world, and the "magnitude-maximum distance" method applied routinely in China Seismic Networks to compare minimum magnitude of completeness (marked as Mp, McEMR and Mr, respectively, obtained by the above three methods) in the North-South Seismic Belt region during the time span from 1 October 2008 to 17 September 2015. The consistency of data observation quality is also considered, which is not paid enough attention in previous studies, and the selected seismic events are recorded by at least three stations. The results show that the assessing results of the three methods are significant different, and the difference between any two methods can reach to ML2.0 for some specific positions in the North-South Seismic Belt. The Mp result is significantly lower than the results by the other two methods in the region to the north of 32°N, low Mr value by the magnitude-maximum distance method is only related to the higher density seismic station region. In general the statistical relationship is McEMR < Mp < Mr. Furthermore, the detection capability score results reveal that the station operational level and the completeness in earthquake record analyses are the main reasons that the Mp significantly differs from the results calculated by other methods, and data quality constraint criteria such as the amount constraint of recorded stations whether used or not, will cause significantly different results of the EMR method from other methods. Considering practical situation of the seismic network in operation and calculation principles of the three assessment methods, the PMC method is more reasonable and recommended for earthquake monitoring ability assessment work. -
引言
航空遥感影像获取速度快、 分辨率高,对灾害具有很强的宏观把握能力(王晓青等,2003),因此在地震应急和震后灾情获取中的应用越来越广泛. 传统的光学遥感由于受阴雨天气的制约,不能及时获取灾区的影像. 合成孔径雷达(synthetic aperture radar,简写为SAR)是一种利用微波波段感知地物从而获取地物信息的主动式遥感技术,其采用的微波波段较长,能够很容易穿透云、 雾和雨. 例如: L波段(1.5 GHz)在雨量为150 mm/h的天气成像时,电磁波能量的衰减不会超过0.01 dB/km; X波段(10 Hz)的TerraSAR和Cosmo/SkyMed卫星在大暴雨情况下衰减即使高达约4.23 dB/km时,其成像效果也几乎不受影响(Brett,2013). 由于SAR具有全天时和全天候的优势,因此近年来在地震震后灾情信息的获取及评估中受到越来越广泛的关注.
随着2007年TerraSAR和Cosmo/SkyMed卫星的发射,SAR的分辨率已达到1 m,机载SAR实验系统的分辨率已达到0.1 m(Brenner,Roessing,2008). 各国SAR系统发展迅速,虽然高分辨率(分辨率等于或优于1 m)SAR影像的研究应用越来越多,但是由于SAR系统独特的斜距成像方式以及SAR影像所特有的斑噪影响,使得SAR影像的解译十分困难. 国内外研究者已尝试多种方法进行SAR影像的震害信息提取,除目视解译外,一般分为基于震前震后SAR影像的变化检测和只基于震后SAR影像的震害提取两种情况. 基于震前震后的变化检测一般利用的是SAR影像的相位(Yonezawa,Takeuchi,1999; Ito,Hosokawa,2003; Gamba et al,2007)或者强度信息(Yonezawa,Takeuchi,2001; Matsuoka,Yamazaki,2004; Bruzzone et al,2014; Marin et al,2015). 随着SAR影像分辨率的提高,建筑物在SAR影像上的叠掩、 二次散射和阴影等几何特征越来越明显,一些研究者开始利用建筑物在震前震后SAR影像上的成像几何结构对建筑物震害进行检测(Guida et al,2010; Brett,2013; 刘金玉等,2013). 但高分辨率SAR系统的发展时间不长,在震前SAR影像缺失的情况下,仅通过震后SAR数据来解译房屋震害成为不可或缺的技术(Dell’Acqua,Polli,2011),包括利用震后SAR影像的极化(郭华东等,2010; Sato,Chen,2013)或者纹理信息(Polli et al,2010; Dell’Acqua et al,2011; Shi et al,2015)与震害建立一定的联系. 基于震后单幅SAR影像进行震害的提取,目前大多还停留在对街区大小的尺度进行震害检测,虽然能够满足地震应急的需求,但仅利用单幅SAR影像进行震害提取仍很困难. 无论是利用震前震后SAR数据还是仅利用震后SAR数据,随着高分辨率SAR系统的发展,利用建筑物单体的成像几何结构进行震害分析将是未来利用震后高分辨率SAR数据进行震害检测的重要方向之一.
本文在对高分辨率SAR建筑物成像几何结构分析的基础上,以2010年玉树MS7.1地震机载高分辨率SAR数据为信息源,以同质度、 不相似度和熵纹理特征为特征指标,对未倒塌建筑物SAR影像上不同成像几何结构(叠掩、 阴影)的影像特征进行分析,并与倒塌建筑物倒塌区的特征进行对比,以探讨不同震害程度建筑物SAR影像特征的差别,以期为高分辨率SAR建筑物震害的提取方法和指标的建立提供理论依据.
1. 研究方法
1.1 建筑物震害分级
建筑物在不同强度地震动作用下,会产生不同程度的破坏. 目前在地震现场震害调查中,一般将建筑物破坏划分为基本完好、 轻微破坏、 中等破坏、 严重破坏和毁坏等5个等级(中华人民共和国国家质量监督检验检疫总局,中国国家标准化管理委员会,2009). 高分辨率光学影像上,建筑物的某些震害细节很难被检测到,因此基于高分辨率光学影像的建筑物震害提取一般划分为3个等级(倒塌、 部分倒塌、 未倒塌)甚或4个等级(再增加未倒塌但可见轻微震害)(王晓青等,2013). 但由于SAR影像为斜距成像且受斑噪等的影响,所以SAR影像建筑物震害提取等级一般不会超过3个(Shi et al,2015). 作为初步研究,本文只将建筑物的震害分成倒塌和未倒塌两个等级来进行分析.
1.2 高分辨率SAR影像建筑物成像几何结构
由于SAR的特殊成像方式以及高分辨率SAR的空间分辨率远小于建筑物的空间尺度,因此SAR影像上同一建筑物在其空间位置及其邻近区域会形成不同的成像特征,这些特征空间区域的组合,形成了特殊的SAR成像几何结构. 因此,仔细分析高分辨率SAR建筑物成像几何结构,对于认识SAR影像建筑物震害特征以及寻找有效的震害提取方法与指标意义重大.
图 1为依据SAR成像机理描述的一个典型平顶矩形房屋模型沿距离向剖面的后向散射特性所构成的成像几何结构. 假设该房屋模型表面均匀,四周平坦,房屋走向沿方位向,其宽度为w,高度为h,SAR传感器的入射角为θ. 受建筑物空间尺寸大小和传感器入射角的影响,建筑物的后向散射机制分为h>wtanθ,h=wtanθ和h<wtanθ等3种情况. 未倒塌建筑物在光学影像及真实SAR影像上的表现如图 2所示.
地震发生后,建筑物的坍塌破坏了规则建筑物的散射机制(图 3a),使得建筑物的阴影等几何特征消失,最明显的表现就是高亮二次散射亮线的消失,而凌乱瓦砾所形成的角反射小,在影像上则表现为一团杂乱的亮点(图 3b).
由此可见,规则建筑物单体的SAR成像具有明显的空间几何特征,叠掩、 二次散射亮线和阴影等相对于正常建筑物的特征改变是判断建筑物单体是否倒塌的有效特征,也是我们基于高分辨率SAR影像建筑物成像几何结构特性建立目标有效解译方法的关键依据(唐侃,2013). 在SAR影像建筑物解译中,通常以叠掩、 二次散射亮线和阴影等主要特征辨识建筑物(赵凌君,2009),本文将试图分析这些特征与建筑物倒塌的关系.
![]() 图 1 未倒塌建筑物的后向散射机制(引自Brunner,2009) (a)h>wtan θ;(b)h=wtan θ;(c)h<wtan θFigure 1. Backscattering mechanism of undamaged buildings(after Brunner,2009) (a)h>wtan θ;(b)h=wtan θ;(c)h<wtan θ
图 1 未倒塌建筑物的后向散射机制(引自Brunner,2009) (a)h>wtan θ;(b)h=wtan θ;(c)h<wtan θFigure 1. Backscattering mechanism of undamaged buildings(after Brunner,2009) (a)h>wtan θ;(b)h=wtan θ;(c)h<wtan θ![]() 图 2 未倒塌建筑物的光学影像(a)和真实的SAR影像(b),红色箭头代表雷达视线方向(下同)Figure 2. The optical image(a)and SAR image(b)of undamaged buildings The red arrow represents the SAR look direction,the same below
图 2 未倒塌建筑物的光学影像(a)和真实的SAR影像(b),红色箭头代表雷达视线方向(下同)Figure 2. The optical image(a)and SAR image(b)of undamaged buildings The red arrow represents the SAR look direction,the same below1.3 建筑物SAR影像纹理特征的选取
建筑物的叠掩、 二次散射亮线和阴影等空间图像,可以采用不同的影像特征参数来表征,本文将选择纹理特征来进行研究. 纹理特征不同于灰度和颜色等图像特征,其主要通过像素及其周围空间邻域的灰度分布来表现(刘丽,匡纲要,2009),是一种反映像素的空间分布属性的图像特征. SAR图像含有丰富的纹理信息. Haralick等(1973)提出了灰度共生矩阵(gray-level co-occurrence matrix,简写为GLCM)法,该方法成为最常见和广泛应用的一种纹理统计分析方法. GLCM建立在估计图像的二阶组合条件概率密度的基础上,能够反映图象灰度变化的二阶统计特征. 在基于GLCM的纹理特征中,同质度可以反映图像的均匀性; 不相似度能够反映图像的不相似程度对灰度的空间排列; 熵能够反映纹理的复杂度. 本文选取这3个基于二阶矩阵的纹理特征,对未倒塌建筑物的叠影区和阴影区以及倒塌建筑倒塌区(因特征趋同未分叠掩区和阴影区)来进行影像特征分析.
![]() 图 3 完全倒塌建筑物的后向散射机制(刘金玉等,2013)(a)及其光学影像(左)和SAR影像(右)(b)Figure 3. The backscattering mechanism of completely collapsed buildings(after Liu et al,2013)(a) and its optical image(left)and SAR image(right)(b).
图 3 完全倒塌建筑物的后向散射机制(刘金玉等,2013)(a)及其光学影像(左)和SAR影像(右)(b)Figure 3. The backscattering mechanism of completely collapsed buildings(after Liu et al,2013)(a) and its optical image(left)and SAR image(right)(b).同质度的计算公式为(Haralick et al,1973)

式中,P(i,j|Dx,Dy)为滑动窗口W内相距为(Dx,Dy)的两个像素点在窗口中出现的概率,其像素值分别为i,j(i,j=0,1,2,…,L-1),其中L为图像灰度级.
不相似度的计算公式为(Haralick et al,1973)

熵的计算公式为(Haralick et al,1973)

1.4 技术路线
图 4给出了本文研究的技术路线. 在对高分辨率SAR强度影像进行裁剪、 配准和滤波等预处理后,基于建筑物的成像几何结构对其震害特点进行分析. 在此基础上,选取倒塌建筑物和未倒塌建筑物样本各28个,采用通过距离向进行线灰度累加的方法,较准确地确定未倒塌建筑物的叠掩区和阴影区,同时提取倒塌建筑物的倒塌区,以进行同质度、 不相似度和熵等纹理测度的计算分析.
![]() 图 4 基于SAR影像建筑物成像几何结构的震害分析技术路线图Figure 4. echnical route of building damage analysis based on SAR imaging geometry
图 4 基于SAR影像建筑物成像几何结构的震害分析技术路线图Figure 4. echnical route of building damage analysis based on SAR imaging geometry2. 研究区域及其SAR影像选取与处理
本文以2010年4月14日玉树MS7.1地震的主要震害区玉树县城区(结古镇)为研究区域,实验SAR数据选用国家测绘地理信息局于2010年4月17日获取的灾区高分辨率机载X波段的SAR强度影像,如图 5所示. 该影像的标称空间分辨率为0.5 m,飞机航行方向为东西向,雷达波束入射方向为由南向北. 同时,以同日获取的分辨率为0.2 m的航拍光学影像作为参考.
![]() 图 5 玉树地震后玉树县城区机载SAR影像和建筑物样本分布图 红色为倒塌房屋,绿色为未倒塌房屋Figure 5. The post-earthquake airborne SAR image and distribution of building samples in Yushu county after Yushu earthquake Red and green represent the damaged and undamaged buildings,respectively
图 5 玉树地震后玉树县城区机载SAR影像和建筑物样本分布图 红色为倒塌房屋,绿色为未倒塌房屋Figure 5. The post-earthquake airborne SAR image and distribution of building samples in Yushu county after Yushu earthquake Red and green represent the damaged and undamaged buildings,respectively将震后SAR影像和光学遥感影像裁剪至玉树县主城区范围,选取足量控制点,采用样条函数法对其进行配准. 对震后SAR影像采用增强Lee滤波法进行滤波处理,以降低斑噪的影响. 在光学影像的辅助下,在震后SAR影像上选取了未倒塌房屋和倒塌房屋样本各28个(图 5). 对未倒塌建筑物尽量选取走向沿方位向的房屋,对于走向不沿方位向的则根据二次散射亮线的位置进行相应角度的旋转.
3. 建筑物震害特征计算及其结果
3.1 建筑物SAR影像成像几何结构的提取
在SAR影像上,常规的边缘提取算法无法有效地提取出建筑物叠掩区及阴影区的准确位置,本文采用沿距离向剖面进行线灰度累加的方法(邹斌等,2009)来增强SAR影像上建筑物成像几何结构的边缘,从而确定建筑物的叠掩、 二次散射和阴影区位置. 距离向线灰度累加是指沿距离向一定的起始与终止位置之间的各直线上的点灰度值逐一累加的方法,对于建筑物边缘位置的确定具有较好效果. 本文对距离向线灰度累加结果取均值. 图 1a几何结构中的两部分强度不同的叠掩(a+c+d和a+c)区分并不明显,所以在提取中将两部分叠掩作为一个叠掩区域; 而图 1c中的屋顶反射区宽度通常很小或者强度表现不明显,所以暂不考虑屋顶这部分.
图 6为图 2中A,B两栋建筑物SAR影像距离向线灰度累加结果图,从图中可以较准确地确定建筑物阴影、 二次散射和叠掩特征的位置及范围. 例如,建筑物A在距离向上的叠掩为155—206像素位置,二次散射区域为147—155像素位置,阴影区域为47—147像素位置.
![]()
3.2 纹理特征计算结果
在建筑物SAR影像线灰度叠加和几何结构提取的基础上,再依据本文选择的纹理特征对未倒塌建筑物的阴影区和叠掩区以及倒塌建筑物的倒塌区进行同质度、 不相似度和熵纹理特征的分析. 纹理特征的计算采用3×3窗口,偏移向量为(1,1).
按照本文分析方法所得到的建筑物SAR影像同质度、 不相似度和熵计算结果及纹理特征分析结果如表 1和图 7所示. 分别按照未倒塌建筑物的叠掩区、 阴影区以及倒塌建筑物的倒塌区,对各纹理特征进行了均值及其不确定性(1倍标准方差)统计,结果如表 2和图 8所示.
![]() 图 7 SAR影像中未倒塌建筑物叠掩区、 阴影区及倒塌建筑物倒塌区的SAR影像纹理特征分析结果 (a)同质度;(b)不相似度;(c)熵值Figure 7. The analysis result of SAR texture features in layover(squares) and shadowing areas(dots)of undamaged buildings as well as damaged areas of collapsed buildings(triangles) (a)Homogeneity;(b)Dissimilarity;(c)Entropy表 1 未倒塌建筑物叠掩区、 阴影区及倒塌建筑物倒塌区的同质度、 不相似度和熵计算结果Table 1. Computation results of homogeneity,dissimilarity and entropy of layover and shadowing areas of undamaged buildings as well as damaged areas of collapsed buildings
图 7 SAR影像中未倒塌建筑物叠掩区、 阴影区及倒塌建筑物倒塌区的SAR影像纹理特征分析结果 (a)同质度;(b)不相似度;(c)熵值Figure 7. The analysis result of SAR texture features in layover(squares) and shadowing areas(dots)of undamaged buildings as well as damaged areas of collapsed buildings(triangles) (a)Homogeneity;(b)Dissimilarity;(c)Entropy表 1 未倒塌建筑物叠掩区、 阴影区及倒塌建筑物倒塌区的同质度、 不相似度和熵计算结果Table 1. Computation results of homogeneity,dissimilarity and entropy of layover and shadowing areas of undamaged buildings as well as damaged areas of collapsed buildings样本编号 未倒塌建筑物 样本编号 倒塌建筑物 阴影区 叠掩区 倒塌区 同质度 不相似度 熵 同质度 不相似度 熵 同质度 不相似度 熵 1 0.69 0.78 1.27 0.17 6.80 2.09 1 0.40 2.17 1.89 2 0.61 1.00 1.54 0.19 5.95 2.10 2 0.48 1.63 1.76 3 0.75 0.62 1.08 0.35 2.77 1.99 3 0.61 0.99 1.52 4 0.80 0.43 0.89 0.43 2.04 1.82 4 0.58 1.21 1.52 5 0.77 0.56 1.00 0.46 1.88 1.71 5 0.57 1.17 1.53 6 0.84 0.35 0.73 0.55 1.33 1.59 6 0.56 1.29 1.59 7 0.77 0.50 1.01 0.41 2.58 1.84 7 0.54 1.37 1.59 8 0.69 0.78 1.26 0.19 5.74 2.12 8 0.50 1.57 1.71 9 0.81 0.43 0.88 0.37 2.36 1.97 9 0.53 1.39 1.69 10 0.67 0.82 1.32 0.32 3.32 1.99 10 0.35 2.63 1.97 11 0.69 0.76 1.30 0.42 2.11 1.88 11 0.30 3.61 2.00 12 0.67 0.89 1.28 0.45 1.72 1.83 12 0.36 2.70 1.92 13 0.65 0.97 1.41 0.36 2.67 1.93 13 0.47 1.60 1.80 14 0.70 0.68 1.24 0.47 1.88 1.75 14 0.52 1.37 1.69 15 0.72 0.68 1.17 0.26 4.53 2.05 15 0.46 1.86 1.81 16 0.77 0.49 1.06 0.20 5.11 2.11 16 0.53 1.44 1.66 17 0.79 0.49 0.95 0.38 2.39 1.95 17 0.54 1.44 1.67 18 0.78 0.58 0.93 0.27 4.08 2.05 18 0.45 1.84 1.84 19 0.76 0.52 1.03 0.47 1.74 1.75 19 0.50 1.52 1.67 20 0.73 0.68 1.09 0.31 2.80 2.02 20 0.48 1.54 1.76 21 0.84 0.34 0.75 0.33 2.92 1.96 21 0.52 1.37 1.70 22 0.81 0.47 0.81 0.30 3.38 2.05 22 0.50 1.48 1.76 23 0.69 0.77 1.30 0.31 3.07 2.02 23 0.40 2.15 1.89 24 0.74 0.60 1.16 0.37 2.29 1.96 24 0.49 1.57 1.74 25 0.69 0.77 1.27 0.31 3.13 2.01 25 0.50 1.39 1.73 26 0.76 0.73 1.03 0.32 2.94 2.00 26 0.43 1.98 1.86 27 0.62 1.00 1.49 0.38 1.99 1.92 27 0.51 1.86 1.78 28 0.72 0.65 1.18 0.37 2.61 1.93 28 0.47 2.30 1.83 ![]() 图 8 未倒塌建筑物叠掩区、 阴影区及倒塌建筑物倒塌区纹理特征均值的1倍标准方差分布图 (a)同质度;(b)不相似度;(c)熵值Figure 8. One standard deviation distribution of the average values of texture features in layover and shadowing areas of undamaged buildings as well as damaged areas of collapsed buildings (a)Homogeneity;(b)Dissimilarity;(c)Entropy表 2 未倒塌建筑物叠掩区、 阴影区及倒塌建筑物倒塌区的纹理特征统计结果Table 2. Statistic results of texture features in layover and shadowing areas of undamaged buildings as well as damaged areas of collapsed buildings
图 8 未倒塌建筑物叠掩区、 阴影区及倒塌建筑物倒塌区纹理特征均值的1倍标准方差分布图 (a)同质度;(b)不相似度;(c)熵值Figure 8. One standard deviation distribution of the average values of texture features in layover and shadowing areas of undamaged buildings as well as damaged areas of collapsed buildings (a)Homogeneity;(b)Dissimilarity;(c)Entropy表 2 未倒塌建筑物叠掩区、 阴影区及倒塌建筑物倒塌区的纹理特征统计结果Table 2. Statistic results of texture features in layover and shadowing areas of undamaged buildings as well as damaged areas of collapsed buildings统计参数 未倒塌建筑物 倒塌建筑物 阴影区 叠掩区 倒塌区 同质度 不相似度 熵 同质度 不相似度 熵 同质度 不相似度 熵 均值 0.73 0.66 1.12 0.35 3.08 1.94 0.48 1.73 1.75 标准方差 0.06 0.19 0.21 0.09 1.39 0.13 0.07 0.56 0.13 4. 讨论与结论
本文建立了基于建筑物及其震害SAR成像几何结构的纹理特征分析方法,以2010年玉树MS7.1地震玉树县城区的SAR影像为数据源,利用距离向线灰度累加法提取了28个未倒塌建筑物样本叠掩区和阴影区的成像几何结构特征,同时提取了28个倒塌建筑物样本的倒塌区. 最终分析得到了未倒塌建筑物叠掩区、 阴影区以及倒塌建筑物倒塌区的同质度、 不相似度和熵纹理特征(表 1和图 7)及其统计结果(表 2和图 8),结果表明:
1)未倒塌建筑物阴影区的同质度明显高于倒塌建筑物倒塌区,而熵和不相似度则明显低于倒塌建筑物倒塌区.
2)未倒塌建筑物叠掩区与倒塌建筑物倒塌区的同质度分布存在一定的交叉或重叠(图 7a),但如果同时考虑叠掩区和阴影区的同质度,则未倒塌建筑物与倒塌建筑物存在明显的差异或可分性(图 8a).
3)对不相似度和熵分析可得到与2)类似的结果.
根据上述初步研究结果,我们得到的结论如下:
1)建筑物的叠掩、 阴影及二次散射亮线等几何结构特征是震害解译的有效特征. 2)与传统的简单特征统计法相比,考虑多个建筑物SAR影像空间几何结构的特征统计法,可以显著提高建筑物震害的识别能力,对于发展基于震后单幅SAR影像进行建筑物单体震害识别的方法与算法研究具有重要意义.
3)未倒塌建筑物的阴影特征比较稳定,不确定性小; 而倒塌建筑物的阴影可能完全或部分消失. 因此,建筑物阴影特征(同质度、 不相似度、 熵纹理特征)具有较好的震害识别能力.
需要说明的是,由于雷达影像成像较为复杂,实际的SAR影像受雷达入射角、 周围环境以及建筑形态、 相邻建筑等的影响,未倒塌建筑物并不总存在高亮的二次散射亮线和阴影,给倒塌建筑物的震害提取结果增加了不确定性和误判. 因此,仅通过震后单幅SAR影像来提取建筑物震害仍很困难. 但是,以建筑物SAR影像几何特征为基础,并辅以高分辨率光学影像和震前SAR影像等其它数据所发展的精细化算法将提高利用SAR影像进行建筑物震害解译的精度和自动化程度.
-
![]()
图 1 利用不同方法计算得到的南北地震带地区最小完整性震级的空间分布
图中三角形为计算所用的289个地震台站,下同. (a)利用PMC方法计算得到的最小完整性震级Mp的空间分布;(b)利用EMR方法计算得到的最小完整性震级McEMR(在δMc≤0.3情况下)的空间分布;(c)利用震级-最大距离法计算得到的最小完整性震级Mr的空间分布
Figure 1. Distribution of minimum magnitude of completeness in the North-South Seismic Belt calculated by different methods. The black triangles show the 289 seismic stations used
(a) Distribution of Mp calculated by PMC method; (b) Distribution of McEMR (in the case of δMc≤0.3) calculated by EMR method; (c) Distribution of Mr calculated by magnitude-maximum distance method
![]()
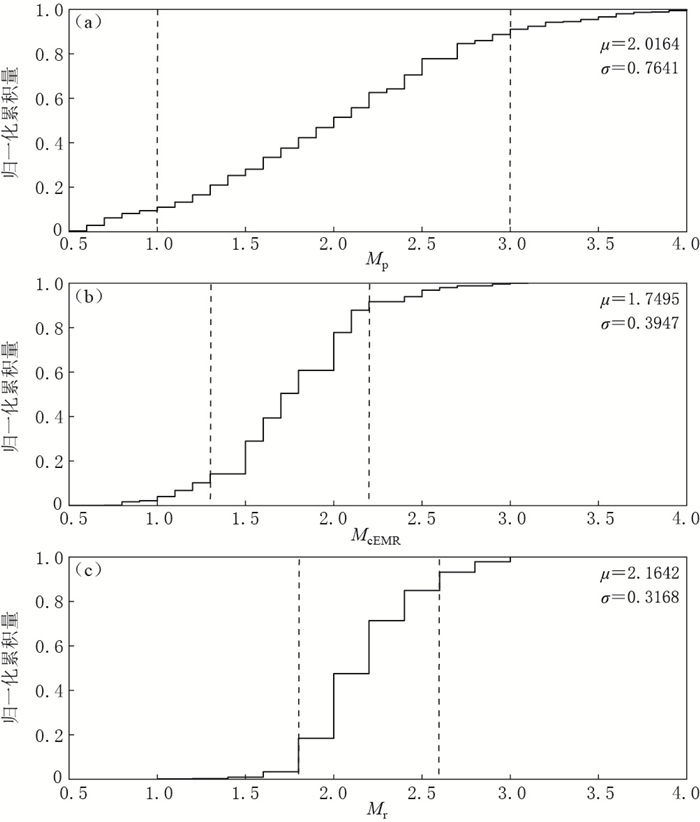
图 2 利用不同方法计算得到的南北地震带地区各空间网格点的最小完整性震级的累积分布
(a)利用PMC方法计算得到的最小完整性震级Mp的累积分布;(b)利用EMR方法计算得到的最小完整性震级McEMR(δMcEMR≤0.3情况下)的累积分布;(c)利用震级-最大距离法计算得到的最小完整性震级Mr的累积分布.子图中的两条黑色虚线标出了累积的空间网格数占总数10%和90%的位置
Figure 2. Cumulative distribution of minimum magnitude of completeness in all the pixels of the North-South Seismic Belt calculated by different method
(a) Cumulative distribution of Mp calculated by PMC method; (b) Cumulative distribution of McEMR (in the case of δMc≤0.3) calculated by EMR method; (c) Cumulative distribution of Mr calculated by magnitude-maximum distance method. The two black dashed lines in each subplots indicate the accumulated pixels accounting for 10% and 90% of the total, respectively
![]()
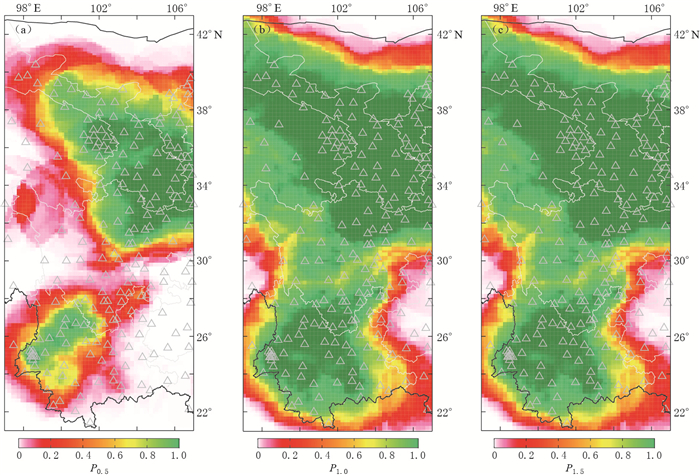
图 3 利用PMC方法给出的南北地震带地区不同震级档对应的检测概率PE的空间分布
(a) M=ML0.5地震的PE空间分布(记为P0.5);(b) M=ML1.0地震的PE空间分布(记为P1.0);(c) M=ML1.5地震的PE空间分布(记为P1.5)
Figure 3. Distribution of the detection probability PE in the North-South Seismic Belt region under different detected magnitude level by PMC method
(a) P0.5 with detected magnitude level ML0.5; (b) P1.0 with detected magnitude level ML1.0; (c) P1.5 with detected magnitude level ML1.5
![]()
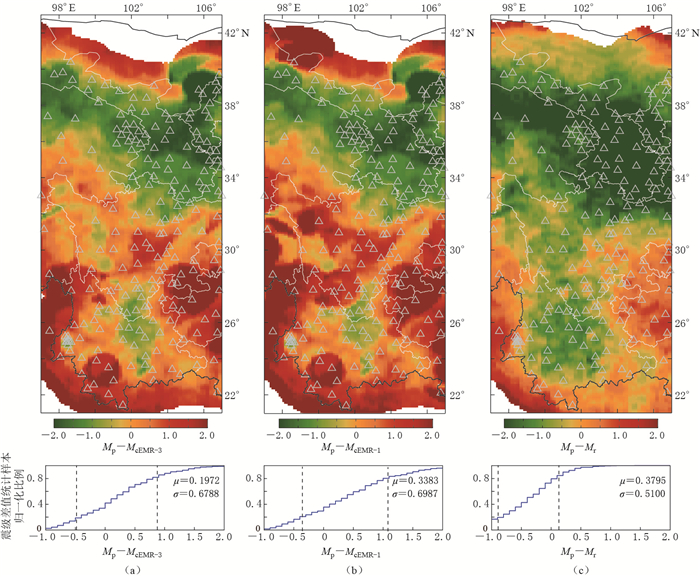
图 4 不同方法对南北地震带地区最小完整性震级计算结果的比较(上)及相应累积分布(下)
图中两条黑色虚线分别标出了累积正态分布拟合参数μ-σ和μ+σ的位置. (a)最小完整性震级Mp与利用至少3个地震台站记录观测资料获得的McEMR-3的差值Mp-McEMR-3的空间分布及其累积分布;(b)最小完整性震级Mp与包括单台记录的全部观测资料获得的McEMR-1的差值Mp-McEMR-1的空间分布及其累积分布;(c)最小完整性震级Mp与利用至少3个地震台站记录观测资料获得的Mr的差值Mp-Mr的空间分布及其累积分布
Figure 4. Comparison of the minimum magnitude of completeness results calculated by different method in the North-South Seismic Belt (upper panels) and corresponding cumulative distribution (lower panels)
The two vertical dashed lines indicate the position of fitting parameters μ-σ and μ+σ of the cumulative normal distribution, respectively. (a) Spatial distribution and the cumulative distribution of Mp-McEMR-3, and the McEMR-3 is calculated by using the selected data recorded by at least three seismic stations; (b) Spatial distribution and the cumulative distribution of Mp-McEMR-1, and the McEMR-1 calculated by all the recorded data including the single station recorded; (c) Spatial distribution and the cumulative distribution of Mp-Mr, and the Mr calculated by the selected data of at least three seismic stations recorded
![]()
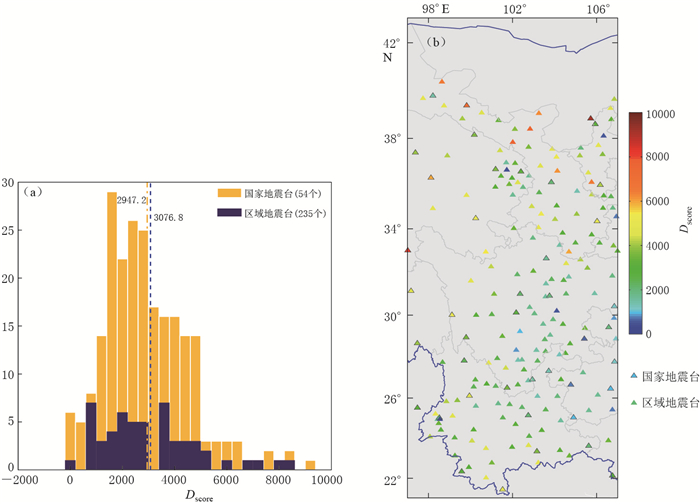
图 5 南北地震带地区289个地震台站的“检测能力评分”Dscore的统计分布(a)及其空间分布(b)
Figure 5. Histogram of the detection capability score result (Dscore) of 289 seismic stations in North-South Seismic Belt (a) and its spatial distribution (b)
![]()
图 6 不同观测记录条件下的EMR方法评估最小完整性震级McEMR的空间分布
(a)由至少1个台站记录的地震目录计算得到的McEMR-1;(b)由至少4个台站记录的地震目录计算得到的McEMR-4
Figure 6. Distribution of McEMR under the different observation data selection conditions
(a) McEMR-1 calculated by the events with at least one station recorded; (b) McEMR-4 calculated by the events with at least four stations recorded
-
邓起东, 张培震, 冉勇康, 杨晓平, 闵伟, 楚全芝. 2002.中国活动构造基本特征[J].中国科学: D辑, 32(12): 1020-1030, 1057. doi: 10.1360/03yd9032 Deng Q D, Zhang P Z, Ran Y K, Yang X P, Min W, Chu Q Z. 2002. Basic characteristics of active tectonics of China[J]. Science in China: Series D, 32(12): 1020-1030, 1057. doi: 10.1360/03yd9032
韩立波, 蒋长胜, 李艳娥, 郭祥云. 2012.用于地震可预测性CSEP计划的南北地震带地区地震最小完整性震级Mc研究[J].地震, 32(1): 17-27. https://www.researchgate.net/publication/288271075_Minimum_magnitude_of_completeness_in_the_North-South_Seismic_Belt_for_Collaboratory_Study_of_Earthquake_Predictability Han L B, Jiang C S, Li Y E, Guo X Y. 2012. Minimum magnitude of completeness in the North-South Seismic Belt for collaboratory study of earthquake predictability[J]. Earthquake, 32(1): 17-27. https://www.researchgate.net/publication/288271075_Minimum_magnitude_of_completeness_in_the_North-South_Seismic_Belt_for_Collaboratory_Study_of_Earthquake_Predictability
黄亦磊, 周仕勇, 庄建仓. 2016.基于地震目录估计完备震级方法的数值实验[J].地球物理学报, 59(4): 1350-1358. doi: 10.6038/cjg20160416 Huang Y L, Zhou S Y, Zhuang J C. 2016. Numerical tests on catalog-based methods to estimate magnitude of completeness[J]. Chinese Journal of Geophysics, 59(4): 1350-1358. doi: 10.6038/cjg20160416
王亚文, 蒋长胜, 刘芳, 毕金孟. 2017.中国地震台网监测能力评估和台站检测能力评分(2008-2015年)[J].地球物理学报, 60(7). doi: 10.6038/cjg20170701. Wang Y W, Jiang C S, Liu F, Bi J M. 2017. Assessment of earthquake monitoring capability and score of seismic station detection capability in China Seismic Network (2008-2015)[J]. Chinese Journal of Geophysics, 60(7). doi: 10.6038/cjg20170701.
易桂喜, 闻学泽. 2000.时间-震级可预报模式在南北地震带分段危险性评估中的应用[J].地震, 20(1): 71-79. https://www.researchgate.net/publication/294748898_Application_of_the_time-and_magnitude_predictable_model_to_seismic_hazard_assessment_in_segmentation_of_the_north-south_seismic_belt Yi G X, Wen X Z. 2000. Application of the time-and magnitude predictable model to seismic hazard assessment in segmentation of the North-South Seismic Belt[J]. Earthquake, 20(1): 71-79. https://www.researchgate.net/publication/294748898_Application_of_the_time-and_magnitude_predictable_model_to_seismic_hazard_assessment_in_segmentation_of_the_north-south_seismic_belt
中国地震局监测预报司. 2007.地震学与地震观测[M].北京:地震出版社: 230-231. Department of Monitoring and Prediction, China Earthquake Administration. 2007. Seismology and Earthquake Observation[M]. Beijing: Seismological Press: 230-231.
Adler J, Parmryd I. 2010. Quantifying colocalization by correlation: The Pearson correlation coefficient is superior to the Mander's overlap coefficient[J]. Cytometry A, 77(8): 733-742. https://www.researchgate.net/publication/45283972_Quantifying_Colocalization_by_Correlation_The_Pearson_Correlation_Coefficient_is_Superior_to_the_Mander%27s_Overlap_Coefficient
Aki K. 1965. Maximum likelihood estimate of b in the formula log N=a-bM and its confidence limits[J]. Bull Earthq Res Inst, 43(2): 237-239. https://www.researchgate.net/publication/302172746_Maximum_likelihood_estimate_of_b_in_the_formula_log_N_a-bM_and_its_confidence_limits
Amorèse D. 2007. Applying a change-point detection method on frequency-magnitude distributions[J]. Bull Seismol Soc Am, 97(5): 1742-1749. doi: 10.1785/0120060181
Cao A M, Gao S S. 2002. Temporal variation of seismic b-values beneath northeastern Japan island arc[J]. Geophys Res Lett, 29(9): 48-1-48-3. doi: 10.1029/2001GL013775
Chernick M R. 1999. Bootstrap Methods: A Practitioner's Guide[M]. New York: Wiley-Interscience Publication: 264.
Efron B. 1979. Bootstrap methods: Another look at the Jackknife[J]. Ann Stat, 7(1): 1-26. doi: 10.1214/aos/1176344552
Gentili S, Sugan M, Peruzza L, Schorlemmer D. 2011. Probabilistic completeness assessment of the past 30 years of seismic monitoring in northeastern Italy[J]. Phys Earth Planet Int, 186(1/2): 81-96. https://www.researchgate.net/publication/232373416_Probabilistic_Completeness_Assessment_of_the_Past_30_Years_of_Seismic_Monitoring_in_northeastern_Italy
Gomberg J. 1991. Seismicity and detection/location threshold in the southern great basin seismic network[J]. J Geophys Res, 96(B10): 16401-16414. doi: 10.1029/91JB01593
Gutenberg R, Richter C F. 1944. Frequency of earthquakes in California[J]. Bull Seismol Soc Am, 34(4): 185-188. http://www.nature.com/nature/journal/v156/n3960/abs/156371a0.html
Jordan T H. 2006. Earthquake predictability, brick by brick[J]. Seismol Res Lett, 77(1): 3-6. doi: 10.1785/gssrl.77.1.3
Kværna T, Ringdal F. 1999. Seismic threshold monitoring for continuous assessment of global detection capability[J]. Bull Seismol Soc Am, 89(4): 946-959. http://www.bssaonline.org/content/89/4/946.abstract
Li S L, Mooney W D, Fan J C. 2006. Crustal structure of mainland China from deep seismic sounding data[J]. Tectonophysics, 420(1/2): 239-252. https://www.researchgate.net/publication/222300469_Crustal_Structure_of_Mainland_China_from_Deep_Seismic_Sounding_Data
Mignan A, Jiang C, Zechar J D, Wiemer S, Wu Z, Huang Z. 2013. Completeness of the mainland China earthquake catalog and implications for the setup of the China Earthquake Forecast Testing Center[J]. Bull Seismol Soc Am, 103(2A): 845-859. doi: 10.1785/0120120052
Nanjo K Z, Ishibe T, Tsuruoka H, Schorlemmer D, Ishigaki Y, Hirata N. 2010a. Analysis of the completeness magnitude and seismic network coverage of Japan[J]. Bull Seismol Soc Am, 100(6): 3261-3268. doi: 10.1785/0120100077
Nanjo K Z, Schorlemmer D, Woessner J, Wiemer S, Giardini D. 2010b. Earthquake detection capability of the Swiss Seismic Network[J]. Geophys J Int, 181(3): 1713-1724. https://ynu.pure.elsevier.com/en/publications/earthquake-detection-capability-of-the-swiss-seismic-network
Ringdal F. 1975. On the estimation of seismic detection thresholds[J]. Bull Seismol Soc Am, 65(6): 1631-1642. http://bssa.geoscienceworld.org/content/65/6/1631
Schorlemmer D, Neri G, Wiemer S, Mostaccio A. 2003. Stability and significance tests for b-value anomalies: Example from the Tyrrhenian Sea[J]. Geophys Res Letts, 30(16): 1835. doi: 10.1029/2003GL017335.
Schorlemmer D, Woessner J. 2008. Probability of detecting an earthquake[J]. Bull Seismol Soc Am, 98(5): 2103-2117. doi: 10.1785/0120070105
Schorlemmer D, Mele F, Marzocchi W. 2010. A completeness analysis of the National Seismic Network of Italy[J]. J Geophys Res, 115(B4): B04308. doi: 10.1029/2008JB006097.
Wiemer S, Wyss M. 2000. Minimum magnitude of complete reporting in earthquake catalogs: Examples from Alaska, the western United States, and Japan[J]. Bull Seismol Soc Am, 90(4): 859-869. doi: 10.1785/0119990114
Woessner J, Wiemer S. 2005. Assessing the quality of earthquake catalogues: Estimating the magnitude of completeness and its uncertainty[J]. Bull Seismol Soc Am, 95(2): 684-698. doi: 10.1785/0120040007
Zhang P Z, Deng Q D, Zhang G M, Ma J, Gan W J, Min W, Mao F Y, Wang Q. 2003. Active tectonic blocks and strong earthquakes in the continent of China[J]. Science in China: Series D, 46(S2): 13-24. https://www.researchgate.net/publication/285354452_Active_tectonic_blocks_and_strong_earthquakes_in_the_continent_of_China_J
Zhang S F, Wu Z L, Jiang C S. 2016. The central China North-South Seismic Belt: Seismicity, ergodicity, and five-year PI forecast in testing[J]. Pure Appl Geophys, 173(1): 245-254. doi: 10.1007/s00024-015-1123-9
-
期刊类型引用(7)
1. 孙钦瑶,钟秀梅,马金莲,王妍,许晓威,吴松翰,王谦. 基于GF-2遥感影像的甘东南农村建筑物结构分类方法. 遥感技术与应用. 2025(01): 192-201 .  百度学术
百度学术
2. 缪恒,王晓青,丁玲,邵乐. 基于全极化Radarsat-2影像的建筑物震害评估. 中国地震. 2022(02): 338-347 . 百度学术
3. 杜妍开,龚丽霞,李强,詹森,张景发. 基于多纹理特征融合的震后SAR图像倒塌建筑物信息提取. 遥感技术与应用. 2021(04): 865-872 . 百度学术
4. 刘刚,梁树能,燕云鹏,闫柏琨,王喆. 精细地质初议. 地学前缘. 2018(02): 267-279 . 百度学术
5. 高宪慧. 雷达遥感对建筑物震害信息提取方法的综述. 智能城市. 2018(03): 46-47 . 百度学术
6. 李强,张景发,龚丽霞,薛腾飞,蒋洪波. SAR图像纹理特征相关变化检测的震害建筑物提取. 遥感学报. 2018(S1): 128-138 . 百度学术
7. 陈丽. 城市高层阵列式建筑布局智能成像方法仿真. 计算机仿真. 2017(07): 285-288 . 百度学术
其他类型引用(6)

 下载:
下载:


计量
- 文章访问数: 766
- HTML全文浏览量: 623
- PDF下载量: 44
- 被引次数: 13
