Three-dimensional crustal velocity structure around Longmenshan and Anninghe fault zones
-
摘要:
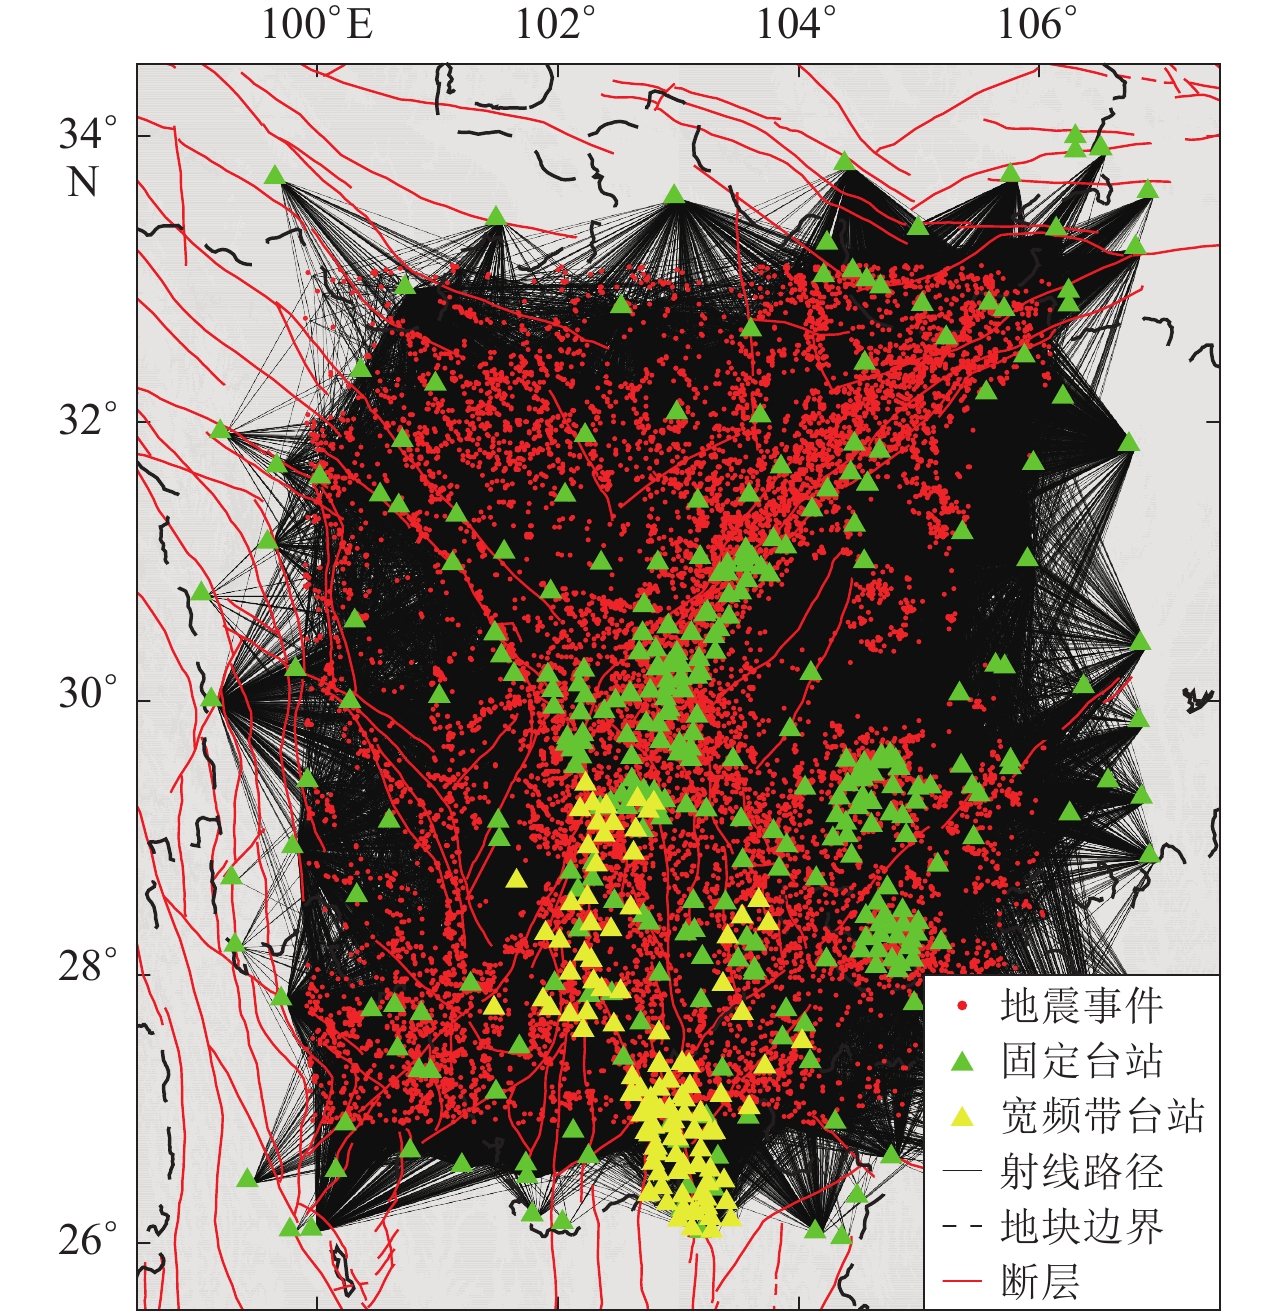
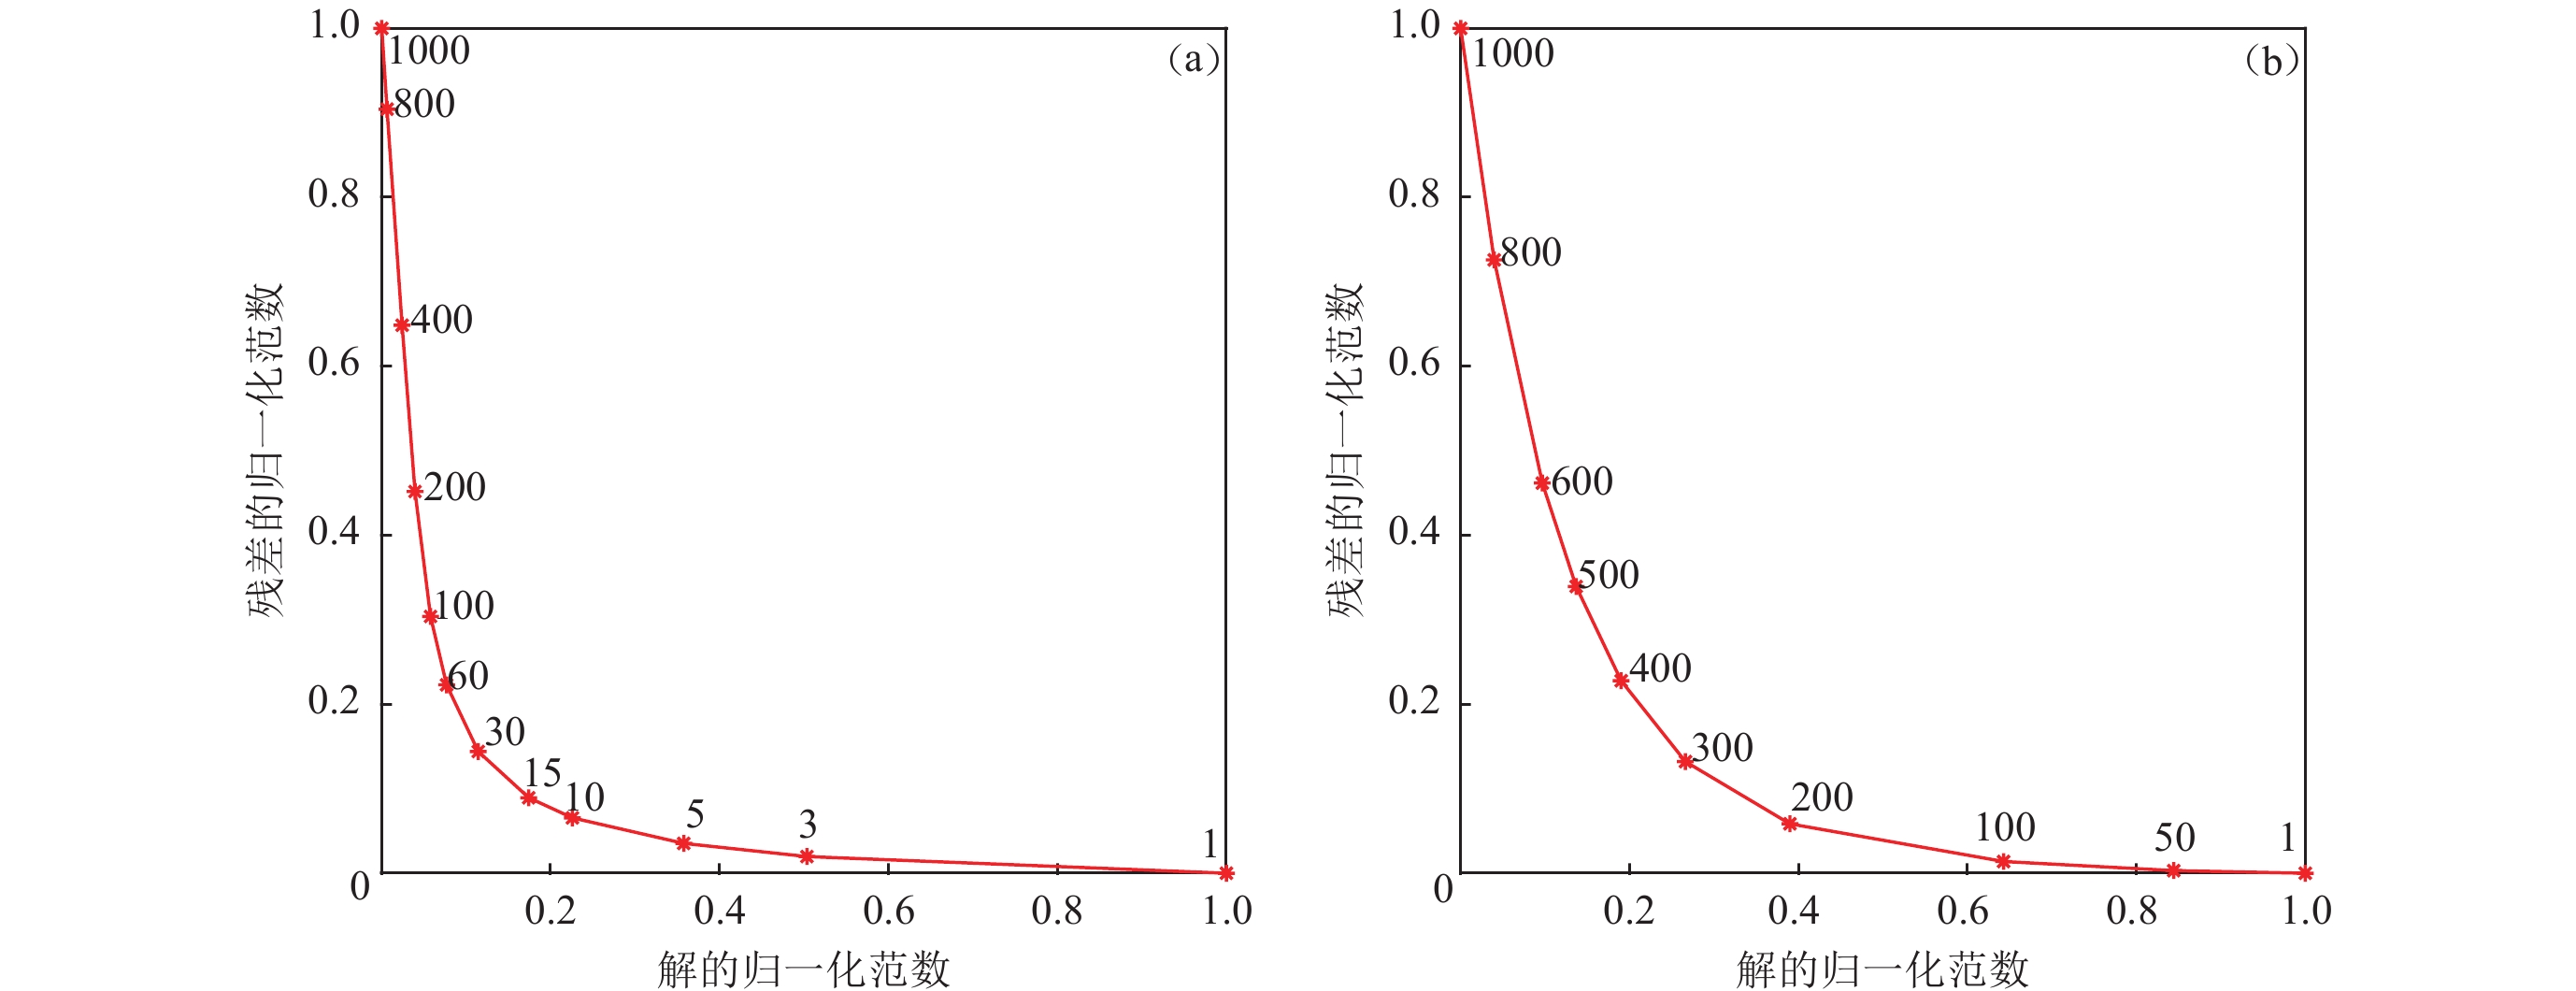
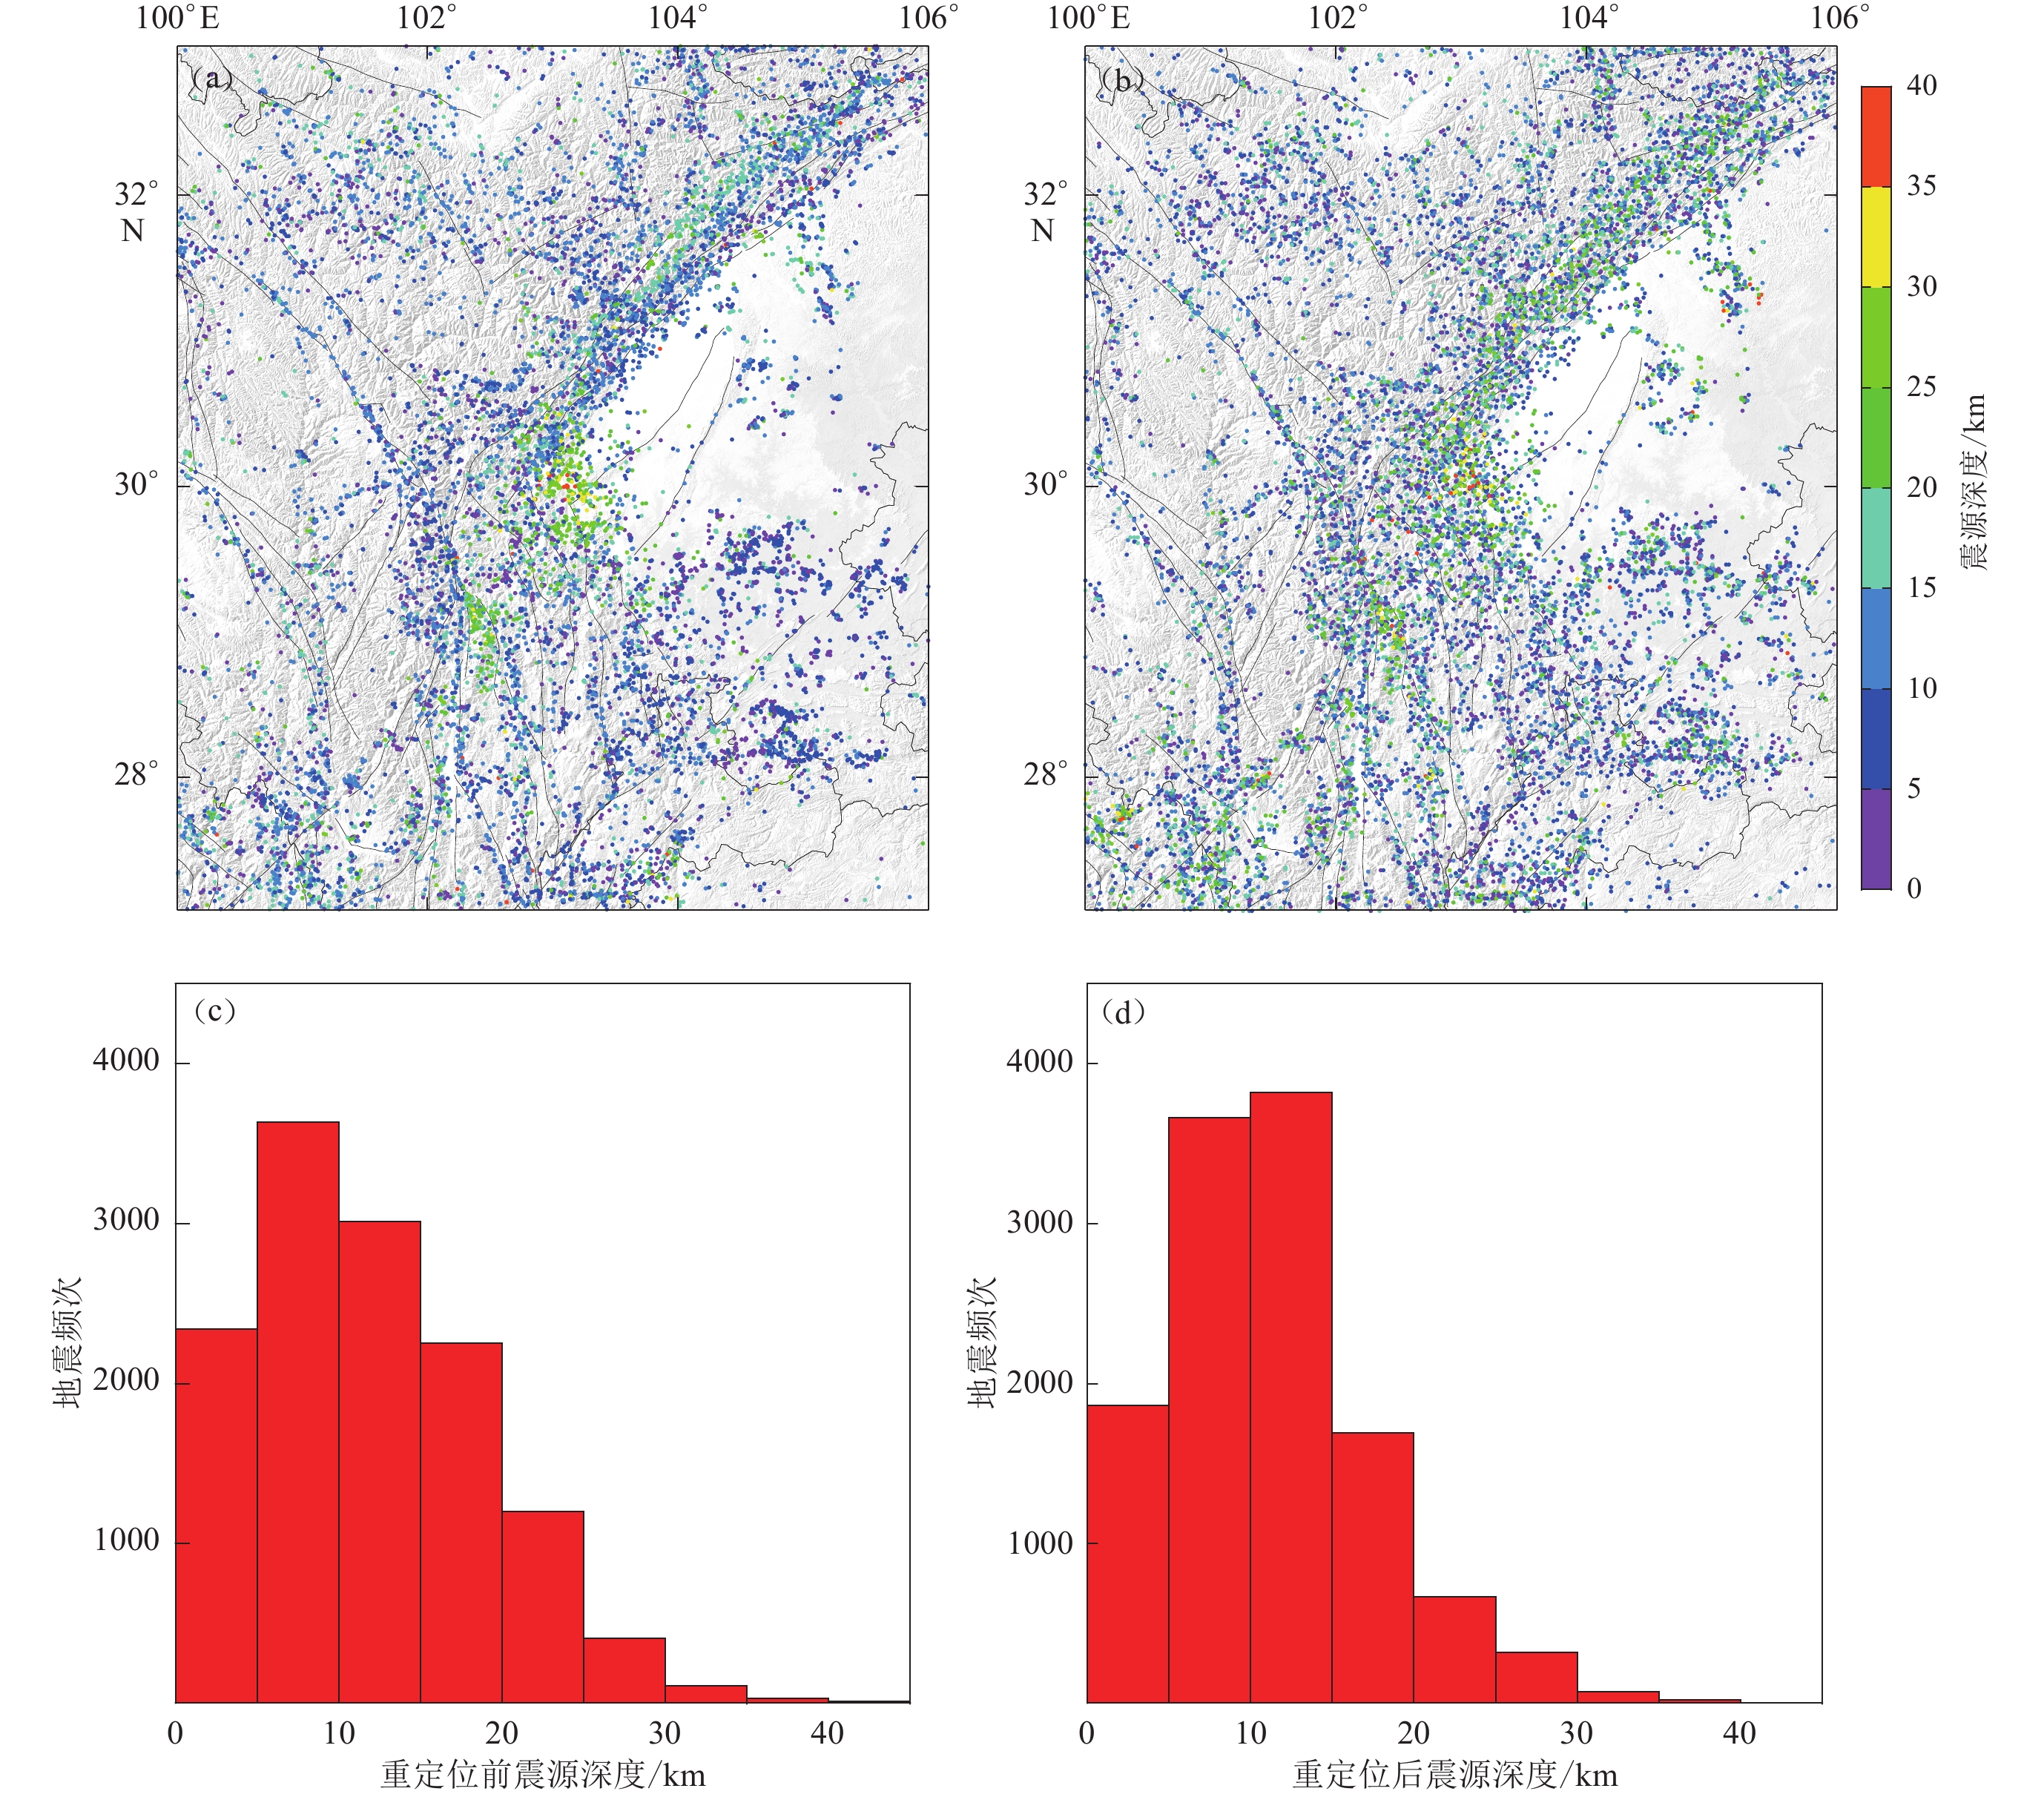
利用2008—2021年区域地震台网及部分流动地震台阵的近震走时观测资料,采用双差层析成像方法获得了龙门山断裂带和安宁河断裂带周边地区的高分辨率地壳三维P波速度结构。结果显示:四川盆地浅部呈明显的低速异常,在前陆盆地低速异常可一直延伸至约15 km深,推测与该地区接收大量来自青藏高原东缘的沉积物有关;在龙门山断裂带附近,中上地壳存在一些与断裂带平行的高速异常体,它们较好地揭示了该地区穹隆体和逆冲推覆体深浅部的分布特征,例如,位于龙门山断裂带中部的彭灌穹隆体下延深度可达15 km左右,而与之相邻的雪隆山穹隆体下延深度不超过5 km。在安宁河断裂带与大凉山断裂带之间存在震源深度超过20 km的微震活动带,其分布形态与P波高速异常的分布形态基本一致,推测高速异常体的存在可能导致地壳内部脆韧性转换带深度的增加,并且受安宁河与大凉山交会部位强烈变形的影响,该地区出现深度较大的地震活动。上述结果为认识该地区的深部地质构造和地震活动机制提供了新的依据。
Abstract:The Anninghe and Longmenshan fault zones are the eastern boundary of the Tibetan Plateau, and they are also important strong earthquake active zones. The study of the deep structure of the fault zones and surrounding areas is of great significance to understand the dynamic process of the eastward expansion of the Tibetan Plateau and the tectonic mechanism of strong earthquake. In this paper, based on the seismic travel time data from regional seismic network and temporary seismic arrays from 2008 to 2021, the high-resolution 3D crustal P-wave velocity structure around the Longmenshan and Anninghe fault zones is obtained by double difference tomography. There are obvious low-velocity anomalies in the shallow part of the Sichuan Basin, and the low-velocity anomalies can extend to about 15 km near the foreland basin, which is related to the foreland basin receiving sediments from the eastern margin of the Tibetan Plateau. Near the Longmenshan fault zone, there are some high-velocity anomalies in the upper to middle crust parallel to the fault zone, which reveals the spatial distribution of domal complexes and thrust complexes in this area. For example, the Pengguan domal complex located in the middle of the Longmenshan fault zone extends down to a depth of about 15 km, while the adjacent Xuelongshan domal complex extends down to a depth not deeper than 5 km. There is an active microseismic zone with a focal depth deeper than 20 km between the Anninghe and Daliangshan fault zones, which is consistent with the distribution of P-wave high-velocity anomaly, therefore we speculate that the existence of high-velocity anomalies may increase the depth of the crustal brittle-ductile transition zone, and deep seismicity appeared in this region due to the strong deformation at the intersection of the Anninghe and the Daliangshan fault zones. The research results of this paper provide new information for further understanding of the deep geological structure and seismic activity mechanism in this area.
-
引言
边坡是一个复杂难解的结构体,这种复杂难解源自于其自身材料特性和坡体内部结构等的不确定性.要想全面地认识、研究边坡在地震作用下的动力稳定性状态,需要对实际工程中的边坡进行总结分类,以便实现不同类型边坡地震稳定性的快速识别、评价和预测,同时为边坡工程的勘察评价、设计施工和运营维护等工作提供依据.
目前,边坡的分类方式主要为单因素分类法和多因素分类法两种.单因素分类法,一般按照边坡的成因、高度、材料、结构特征、使用年限和用途等单因素划分.例如孙玉科和徐义芳 (1959)根据坡体材料的地质特性将边坡分为岩质岩石边坡、半岩质岩石边坡、黏性土质边坡、砂性土质边坡和特殊边坡, 又根据边坡的工程类别将边坡分为路堑边坡、水坝边坡、露天矿边坡和建筑边坡等.多因素分类法的应用实例,例如《建筑边坡工程技术规范》(中华人民共和国住房和城乡建设部,2014) 中综合岩体完整程度、结构面结合程度、产状和自稳能力等4种因素来划分岩体;Deere等 (1967)提出岩石质量指标 (rock quality designation,简写为RQD) 分类法,将岩体质量划分为5个等级,从Ⅰ级到Ⅴ级岩体质量由极好递减到极差;Bieniawski (1974)提出了一种更为全面的综合分类方法,即岩体地质力学分类法 (rock mass rating,简写为RMR).但上述分类方法的对象均为地下工程岩体.
总结前人的研究可知,根据单一因素对边坡进行分类,虽可以更直接地认识边坡,但因影响边坡地震稳定性的因素很多,只考虑单一因素不足以分析其在地震作用下的稳定性,因此需要综合多种因素对边坡进行分类.本文将综合考虑边坡地质和材料力学性质等因素,对地震作用下的土质边坡进行划分,可为地震作用下土质边坡稳定性评价分析奠定基础.
1. 划分条件
对土质边坡进行划分,首先要确定划分指标.前人关于地震滑坡影响因素的研究已有很多.例如Keefer (2000)对1989年Loma Prieta地震引发的滑坡进行了调查分析,认为地震引发的滑坡分布主要与震级、震中距、边坡岩性和坡度等因素有关. 2008年5月12日汶川MS8.0大地震和2013年芦山MS7.0地震均引发了大量的滑坡灾害 (黄润秋等,2008;裴向军,黄润秋,2013).许多地震触发的滑坡分布的研究 (黄润秋,李为乐,2008;许冲等,2009;王秀英等, 2009, 2010;李果等,2011;崔鹏等,2013;裴向军,黄润秋,2013) 表明,地形坡度和高程、水系距离、地震因素、地震断裂、坡体结构和岩性等均应作为边坡地震稳定性的主要控制因素.
通过上述研究分析可以看出,地震诱发滑坡的影响因素主要为地形、水文、岩性和地震参数等4个方面,具体表现为坡度、坡高、斜坡结构类型、降水、水系距离、黏聚力、内摩擦角和地震动参数等8个因素.由于这些影响因素均具有一定的不确定性和模糊性 (袁仁茂等,1999;黄润秋,2007),若将所有影响因素作为划分边坡类型的依据,则划分结果势必杂乱,且操作性和实用性不强,因此须计算上述影响因素的权重,选取权重值较大的主导因素作为划分指标.为了更准确、更方便地评价地震作用下土质边坡的稳定性,本文基于以下原则对边坡进行划分:①综合性.影响地震滑坡的因素有多种,结合地质因素和力学参数,更全面地划分土质边坡类型;②操作性.将影响因素中的主导因素作为划分依据,以实现实际工程运用中的可操作性和高效性;③实用性.在实际工程的基础上进行分类,通过文中得到的土质边坡类型表实现地震作用下边坡稳定性的快速识别、评价和预测.
2. 地震作用下边坡稳定性影响因素的权重计算
2.1 层次分析法
层次分析法 (analytical hierarchy process,简写为AHP),是美国运筹学家Saaty和Wong (1983)于20世纪70年代提出的一种对复杂的定性问题进行定量描述的简便、灵活而又实用的多目标评价决策方法,该方法把复杂问题中的多个影响因素进行两两比较,而后建立结构模型和数学模型来计算分析各元素的相对重要性次序和影响权重,为无法完全用定量或定性方法解决的问题提供了一种行之有效的策略.近年来层次分析法已被广泛运用于地震滑坡的危险性评估中 (樊晓一等,2004;李萍,2006;陈晓利等, 2008, 2012),并取得了良好的效果.
本文将利用层次分析法,研究地震作用下和非地震作用下影响土质斜坡稳定性的关键因素及其权重计算等问题.
2.2 各影响因素的权重计算
1) 建立递阶层次结构模型.将第一节选取出的坡度、坡高、斜坡结构类型、降水、水系距离、黏聚力、内摩擦角和地震动参数等8个因素作为研究对象,建立如图 1的层次分析结构模型.
2) 构造判断矩阵.建立层次分析结构模型后,需要构造判断矩阵,用以对模型第二层 (指标层) 中各因素对上一层因素的相对重要性进行量化,量化的判断标度及含义如表 1所示,若因素i与因素j的比较值为aij,则因素j与因素i的比较值aji=1/aij.
表 1 判断矩阵的标度及含义Table 1. Scale and implication of judgment matrix标度 含义 1 两因素相比,重要性相同 3 两因素相比,一个因素比另一个因素稍微重要 5 两因素相比,一个因素比另一个因素明显重要 7 两因素相比,一个因素比另一个因素强烈重要 9 两因素相比,一个因素比另一个因素极端重要 2,4,6,8 上述相邻判断标度的中间值 根据目前对地震滑坡影响因素的认识和相关专家的经验,结合表 1,对指标层中8个因素之间的相对重要性进行判断、取值,并将取值结果组成判断矩阵A=(aij)8×8.
为了度量该判断矩阵A的一致性和可信度,需要对判断矩阵进行一致性检验,为此引入两个指标,即一致性指标CI和平均随机一致性指标RI.
一致性指标CI的计算公式为

(1) 式中,λmax为判断矩阵的最大特征根,m为判断矩阵的元素个数,此时m=8.
平均随机一致性指标RI,是通过随机构造500个判断矩阵A1,A2,A3,…,A500作为参照对比,分别计算各矩阵对应的一致性指标CI1,CI2,CI3,…,CI500,并取其平均数得到平均随机一致性指标:

(2) 1—9标度下判断矩阵的平均随机一致性指标RI值如表 2所示 (Saaty,Wong,1983).
表 2 判断矩阵的平均随机一致性指标RITable 2. Average random consistency scale RI of judgment matrix判断矩阵标度 1 2 3 4 5 6 7 8 9 RI 0 0 0.58 0.90 1.12 1.24 1.32 1.41 1.45 当判断矩阵的阶数大于2时,其一致性指标CI和平均随机一致性指标RI的比值称为随机一致性比率,记为CR=CI/RI.当CR<0.1时,判断矩阵才具有较好的一致性,即各因素的相对重要性取值的排序是合理的,否则需要重新排列判断矩阵的取值.本文通过多次调整取值并试算,最终获得上述8个因素的合理的判断矩阵为

具体结果列于表 3.
表 3 地震滑坡影响因素判断矩阵Table 3. Judgment matrix of seismic landslide influence factors黏聚力 降水 斜坡结构类型 坡度 坡高 内摩擦角 水系距离 地震动参数 黏聚力 1 3 5 1/2 4 2 6 1/3 降水 1/3 1 3 1/4 2 1/2 4 1/5 斜坡结构类型 1/5 1/3 1 1/6 1/2 1/4 2 1/7 坡度 2 4 6 1 5 3 7 1/2 坡高 1/4 1/2 2 1/5 1 1/3 3 1/6 内摩擦角 1/2 2 4 1/3 3 1 5 1/4 水系距离 1/6 1/4 1/2 1/7 1/3 1/5 1 1/8 地震动参数 3 5 7 2 6 4 8 1 计算上述判断矩阵的最大特征值,得到λmax=8.2883,由一致性指标计算公式,即式 (1) 求得CI=(8.2883-8)/(8-1)=0.0412,根据表 2得到平均随机一致性指标RI为1.41,则随机一致性比率CR=0.0412/1.41=0.0292<0.1,说明该判断矩阵具有较好的一致性,各因素的相对重要性排序是合理的.
之后求出与判断矩阵A的最大特征根λmax=8.2883对应的特征向量W=(0.3449,0.1556,0.0717,0.5059,0.1046,0.2323,0.0517,0.7267),并对其进行归一化处理,得到的向量W′=(0.1572,0.0709,0.0327,0.2306,0.0477,0.1059,0.0236,0.3313) 即为各影响因素的权重值 (表 4).由表 4可知,对土质边坡稳定性影响最大的因素为地震动参数,之后依次为坡度、黏聚力、内摩擦角、降水、坡高、结构类型和水系距离.
表 4 地震作用下土质边坡稳定性影响因素的权重Table 4. Weight of each influence factor of soil slop stability under seismic action影响因素 黏聚力 降水 斜坡结构类型 坡度 坡高 内摩擦角 水系距离 地震动参数 权重值 0.1572 0.0709 0.0327 0.2306 0.0477 0.1059 0.0236 0.3313 根据计算得到的各因素的权重值,本文选取权重值较大的前4个因素,即地震动参数、坡度、黏聚力和内摩擦角作为划分土质边坡类型的指标.
3. 非地震作用下边坡稳定性影响因素的权重计算
在不考虑地震作用的情况下,利用层次分析法计算坡度、坡高、斜坡结构类型、降水、水系距离、黏聚力和内摩擦角等7个影响因素的权重.根据各影响因素相互作用的大小作多次取值调整并试算,最终获得合理的判断矩阵为

具体结果列于表 5.
表 5 诱发滑坡的影响因素判断矩阵Table 5. Judgment matrix of induced landslide influence factors影响因素 黏聚力 降水 坡高 坡度 水系距离 斜坡结构类型 内摩擦角 黏聚力 1 1/3 5 1/2 4 2 3 降水 3 1 7 2 6 4 5 坡高 1/5 1/7 1 1/6 1/2 1/4 1/3 坡度 2 1/2 6 1 5 3 4 水系距离 1/4 1/6 2 1/5 1 1/3 1/2 斜坡结构类型 1/2 1/4 4 1/3 3 1 2 内摩擦角 1/3 1/5 3 1/4 2 1/2 1 计算上述判断矩阵的最大特征值,得到λmax=7.1955,对于7阶矩阵,m=7,则由一致性指标计算公式求得CI=(7.1955-7)/(7-1)=0.0326,根据表 2得到平均随机一致性指标RI为1.32,则随机一致性比率CR=0.0326/1.32=0.0247<0.1,说明该判断矩阵具有较好的一致性,各因素的相对重要性排序是合理的.
之后进一步求得判断矩阵A的最大特征根λmax=7.1955所对应的特征向量W=(-0.3333,-0.7444,-0.0655,-0.5041,-0.0941,-0.2177,-0.1420),并对其进行归一化处理,得到向量W′=(0.1586,0.3543,0.0312,0.2399,0.0448,0.1036,0.0676),即为各影响因素的权重值 (表 6).
表 6 非地震作用下土质边坡稳定性影响因素的权重Table 6. Weight of each influence factor of soil slop stability under non-seismic action影响因素 黏聚力 降水 坡高 坡度 水系距离 斜坡结构类型 内摩擦角 权重值 0.1586 0.3543 0.0312 0.2399 0.0448 0.1036 0.0676 根据计算得到的各因素权重值,对比分析表 4与表 6可知,边坡稳定性的影响因素在有无地震作用下所得的权重是有所差别的.在非地震作用下,降水对土质边坡稳定性的影响最大,之后依次为坡度、黏聚力、斜坡结构类型、内摩擦角、水系距离和坡高; 与地震作用下各影响因素的权重相比,降水、斜坡结构类型和水系距离的影响权重显著增大.相关统计显示,自20世纪80年代以来发生在我国大陆范围内的滑坡灾害,约一半是由降雨引发的 (黄润秋,2007),这也很好地印证了本文的结论.
4. 土质边坡类型
4.1 坡体材料性质
土质边坡材料具有多样性,而不同土质的力学性质不同,在地震作用下表现出的稳定性亦不同.根据土体的工程分类 (刘祖典,1997;唐大雄等,1999;孔宪立,石振明,2001;姜德义,王国栋,2003;李萍,2006;《工程地质手册》编委会,2011),将土质边坡材料的内摩擦角和黏聚力划分为以下4段:
1) 内摩擦角介于15°—24°,黏聚力介于30—65 kPa.典型代表为黏土边坡.以黏性土为主的边坡称为黏土边坡.黏土以细密颗粒为主,含有较多黏粒和亲水性黏土矿物,是修筑堤坝的常用土料.但由于黏土的生成时间及空间环境的差异,其物理力学特性等也有较大的差别,对边坡稳定性的影响也不同.尤其是稠度,如固态或者硬塑态的黏土, 抗剪强度较高,其组成的边坡一般具有较好的稳定性.
2) 内摩擦角介于40°—76°,黏聚力介于20—33 kPa.典型代表为黄土边坡.黄土,顾名思义,是颜色呈黄色的土,天然状态下含水量较少,对湿度变化很敏感.黄土边坡在我国分布较广,甘、陕、晋地区尤为常见,宁夏、河北和河南等部分地区也有分布.在地震和降雨的作用下,黄土边坡极易发生失稳破坏,造成严重的人员伤亡与经济损失.
3) 内摩擦角小于15°,黏聚力小于20 kPa.典型代表为软土边坡.软土边坡是指坡体主要由淤化、泥变、淤泥实土及其它抗剪强度极低的土组成的边坡.软土边坡主要分布于我国东海、黄海、渤海和南海等沿海地区,内陆地区也有少量分布,这类土体的抗剪强度较低.
4) 内摩擦角介于24°—42°,黏聚力近似为零.典型代表为砂土边坡.砂土边坡是指主要由砂或砂性土组成的边坡.砂土的特性与砂粒的大小和密度有关.一般情况下,砂土的透水性较强.因砂土中黏粒含量很少,其黏聚力也很小,几乎为零.在地震作用下,砂土边坡多易产生液化而导致滑坡.
4.2 边坡坡度
坡度是反映边坡面倾斜程度的一个物理量,坡度对滑坡的发育具有重要的影响 (樊晓一等,2004).边坡坡度决定了坡体有效临空面的大小,而有效临空面又为滑坡的发生提供了必要的空间条件.在地震作用下,滑坡等级的分布规律有所不同,但是大量研究统计显示,地震滑坡多发生在20°—50°的坡度范围内 (孙崇绍,蔡红卫,1997;黄润秋,2007;许冲等,2009).本文参考姜德义和王国栋 (2003)一文,将坡度划分为4个等级, 详见表 7.
表 7 边坡坡度等级类型Table 7. Slop gradient type等级 边坡名称 坡度/° Ⅰ 缓坡 <20 Ⅱ 缓陡坡 20—35 Ⅲ 陡坡 35—50 Ⅳ 急坡 >50 4.3 土质边坡类型划分
由于地震动参数的影响因素较多,使得探讨变得较为复杂且不具操作性.作者此前已对地震动参数的土质边坡响应特性进行过讨论 (张江伟,2015),研究结果表明,地震动的峰值加速度、频谱和持时对地震边坡稳定性均有不同程度的影响,其中峰值加速度和频谱的影响较为显著.地震动中幅值、频谱和持时的不同组合对边坡稳定性的影响程度也不同.本文考虑的地震作用主要体现在影响因素的选取,比如降水等因素在非地震作用下对边坡稳定性的影响作用显著,但在地震作用下则相反.根据地震作用下边坡影响因素及其权重的研究结果可知,以坡度、黏聚力和内摩擦角这3个指标进行土质边坡分类比较合适,其分类结果见表 8.首先将土质边坡按照土体的内摩擦角和黏聚力划分为4个大类,然后根据坡度等级将土质边坡进一步细分.
表 8 土质边坡分类Table 8. Soil slope classification类型 内摩擦角/° 黏聚力/kPa 坡度 参考材料 缓坡/° 缓陡坡/° 陡坡/° 急坡/° Ⅰ 15—24 30—65 <20 20—35 35—50 >50 黏土 Ⅱ 40—76 20—33 <20 20—35 35—50 >50 黄土 Ⅲ <15 <20 <20 20—35 35—50 >50 软土 Ⅳ 24—42 ≈0 <20 20—35 35—50 砂土 5. 讨论与结论
影响土质边坡地震稳定性的因素有很多,在研究时需要对其进行筛选,利用主导因素来研究土质边坡的地震稳定性,这样更具操作性和效率性.本文在对地震作用下土质边坡类型研究分析的过程中,得到以下几点结论:
1) 通过对边坡地震稳定性影响因素的研究分析,认为影响地震诱发滑坡的主要因素涉及地形、水文、岩性和地震参数等4个方面,具体表现为坡度、坡高、斜坡结构类型、降水、水系距离、黏聚力、内摩擦角和地震动参数等8个主要因素.
2) 利用层次分析法对上述8个影响因素建立的层次结构模型进行分析计算,得到各因素在有、无地震作用下土质边坡稳定性的影响权重.结果表明:在地震作用下,影响土坡稳定性的主要因素为地震动参数,之后依次为坡度、黏聚力、内摩擦角、降水、坡高、斜坡结构类型和水系距离;非地震作用下,降水对土质边坡稳定性的影响作用最大,之后依次为坡度、黏聚力、斜坡结构类型、内摩擦角、水系距离和坡高.
3) 以地震作用下影响权重较高的坡度、黏聚力和内摩擦角等3个因素为指标,建立地震作用下土质边坡类型的划分方案,将土质边坡划分为4类,每个类型中又根据坡度的不同划分为缓坡、缓陡坡、陡坡和急坡等4个亚类.
本文的划分结果可为土坡地震稳定性的数值模拟分析及危险性评价提供基础和依据.值得注意的是,对于上述各类型土坡的易滑性有待进一步研究.
-
图 9 剖面AA′ (a),BB′ (b),CC′ (c),DD′ (d),EE′ (e)的P波速度及地震分布图
左侧为P波绝对速度剖面,右侧为P波速度扰动剖面;黑色实线为地形,黑色圆点为距离剖面两侧10 km范围内的地震
Figure 9. P wave velocity along vertical profiles AA′ (a),BB′ (b),CC ′ (c),DD ′ (d),EE ′ (e) and earthquake distribution
Left column is the profile of absolute P wave velocity,right column is the perturbation velocity of P wave;black line represents topography,black dots denote seismic events within 10 km from both sides of the profile
图 1 研究区构造背景及历史强震分布图(引自邓起东等,2002)
F1:鲜水河断裂带;F2:安宁河断裂带;F3:汶川—茂县断裂;F4:映秀—北川断裂;F5:灌县—江油断裂,下同
Figure 1. Tectonic settings and historical strong earthquake distribution of the studied area (after Deng et al,2002)
F1:Xianshuihe fault zone;F2:Anninghe fault zone;F3:Wenchuan-Maoxian fault;F4:Yingxiu-Beichuan fault;F5:Guanxian-Jiangyou fault,the same below
图 3 三维P波初始模型图
图(a−f)分别为研究区不同深度的P波速度初始模型图;图(g,h)分别为沿102°E和30°N剖面的P波速度初始模型图
Figure 3. Three-dimensional P-wave initial model
Figs. (a−f) are the three-dimensional P-wave initial models at different depths in the studied area;Figs. (g,h) are the P-wave initial models of the profiles along 102°E and 30°N
-
陈运泰,杨智娴,张勇,刘超. 2013. 从汶川地震到芦山地震[J]. 中国科学:地球科学,43(6):1064–1072. Chen Y T,Yang Z X,Zhang Y,Liu C. 2013. From 2008 Wenchuan earthquake to 2013 Lushan earthquake[J]. Scientia Sinica Terrae,43(6):1064–1072 (in Chinese). doi: 10.1360/zd-2013-43-6-1064
邓起东,陈社发,赵小麟. 1994. 龙门山及其邻区的构造和地震活动及动力学[J]. 地震地质,16(4):389–403. Deng Q D,Chen S F,Zhao X L. 1994. Tectonics,seismisity and dynamics of Longmenshan Mountains and its adjacent regions[J]. Seismology and Geology,16(4):389–403 (in Chinese).
邓起东,张培震,冉永康,杨晓平,闵伟,楚全芝. 2002. 中国活动构造基本特征[J]. 中国科学:D辑,32(12):1020–1030. Deng Q D,Zhang P Z,Ran Y K,Yang X P,Min W,Chu Q Z. 2002. Basic characteristics of active tectonics of China[J]. Science in China: Series D,46(4):356–372.
邓文泽,陈九辉,郭飚,刘启元,李顺成,李昱,尹昕忠,齐少华. 2014. 龙门山断裂带精细速度结构的双差层析成像研究[J]. 地球物理学报,57(4):1101–1110. Deng W Z,Chen J H,Guo B,Liu Q Y,Li S C,Li Y,Yin X Z,Qi S H. 2014. Fine velocity structure of the Longmenshan fault zone by double-difference tomography[J]. Chinese Journal of Geophysics,57(4):1101–1110 (in Chinese).
范莉苹,吴建平,房立华,王未来. 2015. 青藏高原东南缘瑞利波群速度分布特征及其构造意义探讨[J]. 地球物理学报,58(5):1555–1567. Fan L P,Wu J P,Fang L H,Wang W L. 2015. The characteristic of Rayleigh wave group velocities in the southeastern margin of the Tibetan Plateau and its tectonic implications[J]. Chinese Journal of Geophysics,58(5):1555–1567 (in Chinese).
李勇,周荣军,Densmore A L,Ellis M A. 2006. 青藏高原东缘龙门山晚新生代走滑−逆冲作用的地貌标志[J]. 第四纪研究,26(1):40–51. Li Y,Zhou R J,Densmore A L,Elli M A. 2006. Geomorphic evidence for the Late Cenozoic strike-slipping and thrusting in Longmen mountain at the eastern margin of the Tibetan Plateau[J]. Quaternary Sciences,26(1):40–51 (in Chinese).
马宗晋,郑大林. 1981. 中蒙大陆中轴构造带及其地震活动[J]. 地震研究,4(4):421–436. Ma Z J,Zheng D L. 1981. The Chinese-Mongolian continental mid-axis tectonic belt and its seismicity[J]. Journal of Seismological Research,4(4):421–436 (in Chinese).
冉勇康,陈立春,程建武,宫会玲. 2008. 安宁河断裂冕宁以北晚第四纪地表变形与强震破裂行为[J]. 中国科学:D辑,38(5):543–554. Ran Y K,Chen L C,Cheng J W,Gong H L. 2008. Late Quaternary surface deformation and rupture behavior of strong earthquake on the segment north of Mianning of the Anninghe fault[J]. Science in China: Series D,51(9):1224–1237. doi: 10.1007/s11430-008-0104-6
唐荣昌,黄祖智. 1983. 鲜水河断裂带的地震地质基本特征及其研究现状[J]. 国际地震动态,1(3):1–4. Tang R C,Huang Z Z. 1983. The basic seismo-geological characteristics of the Xianshuihe fracture zone and the current situation of research thereon[J]. Recent Developments in World Seismology,1(3):1–4 (in Chinese).
唐荣昌,钱洪,黄祖智,文德华,伍先国,蔡长星,田鸿. 1992. 安宁河断裂带北段晚更新世以来的分段活动特征[J]. 中国地震,8(3):62–70. Tang R C,Qian H,Huang Z Z,Wen D H,Wu X G,Cai C X,Tian H. 1992. The feature of activity on the north segment of the Anninghe fracture zone since Late Pleistocene[J]. Earthquake Research in China,8(3):62–70 (in Chinese).
滕吉文,白登海,杨辉,闫雅芬,张洪双,张永谦,阮小敏. 2008. 2008汶川 MS8.0地震发生的深层过程和动力学响应[J]. 地球物理学报,51(5):1385–1402. Teng J W,Bai D H,Yang H,Yan Y F,Zhang H S,Zhang Y Q,Ruan X M. 2008. Deep processes and dynamic responses associated with the Wenchuan MS8.0 earthquake of 2008[J]. Chinese Journal of Geophysics,51(5):1385–1402 (in Chinese).
王小娜,于湘伟,章文波. 2015. 芦山震区地壳三维P波速度精细结构及地震重定位研究[J]. 地球物理学报,58(4):1179–1193 Wang X N,Yu X W,Zhang W B. 2015. 3D P-wave velocity of the structure of the crust and relocation of earthquakes in the Lushan source area[J]. Chinese Journal of Geophysics,58(4):1179–1193 (in Chinese).
吴建平,黄媛,张天中,明跃红,房立华. 2009. 汶川 MS8.0级地震余震分布及周边区域P波三维速度结构研究[J]. 地球物理学报,52(2):320–328. Wu J P,Huang Y,Zhang T Z,Ming Y H,Fang L H. 2009. Aftershock distribution of the MS8.0 Wenchuan earthquake and three dimensional P-wave velocity structure in and around source region[J]. Chinese Journal of Geophysics,52(2):320–328 (in Chinese).
谢其锋,蔡元峰,董云鹏,吴灌洲,翟明国. 2018. 扬子板块西缘挖角地区晋宁期岩浆作用及大地构造意义[J]. 岩石学报,34(11):3287–3301. Xie Q F,Cai Y F,Dong Y P,Wu G Z,Zhai M G. 2018. The magmatism and tectonic significance of Jinningian monzogranite in Wajiao area,western margin of Yangtze Block[J]. Acta Petrologica Sinica,34(11):3287–3301 (in Chinese).
许志琴,李化启,侯立炜,付小芳,陈文,曾令森,蔡志慧,陈方远. 2007. 青藏高原东缘龙门—锦屏造山带的崛起:大型拆离断层和挤出机制[J]. 地质通报,26(10):1262–1276. Xu Z Q,Li H Q,Hou L W,Fu X F,Chen W,Zeng L S,Cai Z H,Chen F Y. 2007. Uplift of the Longmen-Jinping orogenic belt along the eastern margin of the Qinghai-Tibet Plateau:Large-scale detachment faulting and extrusion mechanism[J]. Geological Bulletin of China,26(10):1262–1276 (in Chinese).
颜丹平,孙铭,巩凌霄,周美夫,邱亮,李书兵,张森,古术航,木红旭. 2020. 青藏高原东缘龙门山前陆逆冲带复合结构与生长[J]. 地质力学学报,26(5):615–633. Yan D P,Sun M,Gong L X,Zhou M F,Qiu L,Li S B,Zhang S,Gu S H,Mu H X. 2020. Composite structure and growth of the Longmenshan foreland thrust belt in the eastern margin of the Qinghai-Tibet Plateau[J]. Journal of Geomechanics,26(5):615–633 (in Chinese).
张杰,杨光亮,谈洪波,吴桂桔,王嘉沛. 2020. 基于接收函数约束的川滇地区莫霍面深度反演研究[J]. 地球物理学报,63(7):2579–2591. Zhang J,Yang G L,Tan H B,Wu G J,Wang J P. 2020. Inversion of Moho surface depth in Sichuan-Yunnan area based on the constraint of receiving function[J]. Chinese Journal of Geophysics,63(7):2579–2591 (in Chinese).
张沛,周祖翼. 2008. 碎屑矿物热年代学研究进展[J]. 地球科学进展,23(11):1130–1140. Zhang P,Zhou Z Y. 2008. Geological applications of detrital thermochronology[J]. Advances in Earth Science,23(11):1130–1140 (in Chinese).
Allen C R,Luo Z L,Qian H,Wen X Z,Zhou H W,Huang W S. 1991. Field study of a highly active fault zone:The Xianshuihe fault of southwestern China[J]. GSA Bull,103(9):1178–1199. doi: 10.1130/0016-7606(1991)103<1178:FSOAHA>2.3.CO;2
Cao F H,Liang C T,Zhou L,Zhu J S. 2020. Seismic azimuthal anisotropy for the southeastern Tibetan Plateau extracted by Wave Gradiometry analysis[J]. J Geophys Res: Solid Earth,125(5):e2019JB018395. doi: 10.1029/2019JB018395
Chen S F,Wilson C J L. 1996. Emplacement of the Longmen shan thrust-nappe belt along the eastern margin of the Tibetan Plateau[J]. J Struct Geol,18(4):413–430.
Eberhart-Phillips D. 1986. Three-dimensional velocity structure in northern California Coast Ranges from inversion of local earthquake arrival times[J]. Bull Seismol Soc Am,76(4):1025–1052.
Gray R,Pysklywec R N. 2012. Geodynamic models of mature continental collision:Evolution of an orogen from lithospheric subduction to continental retreat/delamination[J]. J Geophys Res: Solid Earth,117(B3):B03408.
Holt W E,Ni J F,Wallace T C,Haines A J. 1991. The active tectonics of the eastern Himalayan syntaxis and surrounding regions[J]. J Geophys Res: Solid Earth,96(B9):14595–14632. doi: 10.1029/91JB01021
Houseman G,England P. 1993. Crustal thickening versus lateral expulsion in the Indian-Asian continental collision[J]. J Geophys Res: Solid Earth,98(B7):12233–12249. doi: 10.1029/93JB00443
Hu P Y,Zhai Q G,Wang J,Tang Y,Ren G M. 2017. The Shimian ophiolite in the western Yangtze Block,SW China:Zircon SHRIMP U-Pb ages,geochemical and Hf-O isotopic characteristics,and tectonic implications[J]. Precamb Res,298:107–122. doi: 10.1016/j.precamres.2017.06.005
Huang Z C,Wang P,Xu M J,Wang L S,Ding Z F,Wu Y,Xu M J,Mi N,Yu D Y,Li H. 2015. Mantle structure and dynamics beneath SE Tibet revealed by new seismic images[J]. Earth Planet Sci Lett,411:100–111. doi: 10.1016/j.jpgl.2014.11.040
Humphreys E,Clayton R W. 1988. Adaptation of back projection tomography to seismic travel time problems[J]. J Geophys Res: Solid Earth,93(B2):1073–1085. doi: 10.1029/JB093iB02p01073
Lei J S,Zhao D P,Su Y J. 2009. Insight into the origin of the Tengchong intraplate volcano and seismotectonics in southwest China from local and teleseismic data[J]. J Geophys Res: Solid Earth,114(B5):B05302.
Lévěque J J,Rivera L,Wittlinger G. 1993. On the use of the checker-board test to assess the resolution of tomographic inversions[J]. Geophys J Int,115(1):313–318. doi: 10.1111/j.1365-246X.1993.tb05605.x
Li H Y,Su W,Wang C Y,Huang Z X. 2009. Ambient noise Rayleigh wave tomography in western Sichuan and eastern Tibet[J]. Earth Planet Sci Lett,282(1/2/3/4):201–211.
Lin G,Thurber C H,Zhang H,Hauksson E,Shearer P M,Waldhauser F,Brocher T M,Hardebeck J. 2010. A California statewide three-dimensional seismic velocity model from both absolute and differential times[J]. Bull Seismol Soc Am,100(1):225–240. doi: 10.1785/0120090028
Liu Z Q,Liang C T,Hua Q,Li Y,Yang Y H,He F J,Fang L H. 2018. The seismic potential in the seismic gap between the Wenchuan and Lushan earthquakes revealed by the joint inversion of receiver functions and ambient noise data[J]. Tectonics,37(11):4226–4238. doi: 10.1029/2018TC005151
Meng E,Liu F L,Du L L,Liu P H,Liu J H. 2015. Petrogenesis and tectonic significance of the Baoxing granitic and mafic intrusions,southwestern China:Evidence from zircon U-Pb dating and Lu-Hf isotopes,and whole-rock geochemistry[J]. Gondwana Res,28(2):800–815. doi: 10.1016/j.gr.2014.07.003
Paige C C,Saunders M A. 1982. Algorithm 583:LSQR:Sparse linear equations and least squares problems[J]. ACM Trans Math Softw,8(2):195–209. doi: 10.1145/355993.356000
Pei S P,Su J R,Zhang H J,Sun Y S,Toksöz M N,Wang Z,Gao X,Zeng J L,He J K. 2010. Three-dimensional seismic velocity structure across the 2008 Wenchuan MS8.0 earthquake,Sichuan,China[J]. Tectonophysics,491(1/2/3/4):211–217.
Shen Z K,Lü J N,Wang M,Bürgmann R. 2005. Contemporary crustal deformation around the southeast borderland of the Tibetan Plateau[J]. J Geophys Res: Solid Earth,110(B11):B11409.
Thurber C H. 1992. Hypocenter-velocity structure coupling in local earthquake tomography[J]. Phys Earth Planet Inter,75(1/2/3):55–62.
Waldhauser F,Ellsworth W L. 2000. A double-difference earthquake location algorithm:Method and application to the northern Hayward fault,California[J]. Bull Seismol Soc Am,90(6):1353–1368. doi: 10.1785/0120000006
Wang W L,Wu J P,Fang L H,Lai G J,Cai Y. 2017. Crustal thickness and Poisson’s ratio in southwest China based on data from dense seismic arrays[J]. J Geophys Res: Solid Earth,122(9):7219–7235. doi: 10.1002/2017JB013978
Wang Z,Fukao Y,Pei S P. 2009. Structural control of rupturing of the MW7.9 2008 Wenchuan earthquake,China[J]. Earth Planet Sci Lett,279(1/2):131–138.
Wang Z,Zhao D P,Wang J. 2010. Deep structure and seismogenesis of the north-south seismic zone in southwest China[J]. J Geophys Res: Solid Earth,115(B12):B12334.
Xie J Y,Ritzwoller M H,Shen W S,Yang Y J,Zheng Y,Zhou L Q. 2013. Crustal radial anisotropy across eastern Tibet and the western Yangtze Craton[J]. J Geophys Res: Solid Earth,118(8):4226–4252. doi: 10.1002/jgrb.50296
Xie J Y,Ritzwoller M H,Shen W S,Wang W T. 2017. Crustal anisotropy across eastern Tibet and surroundings modeled as a depth-dependent tilted hexagonally symmetric medium[J]. Geophys J Int,209(1):466–491.
Xue Z H,Martelet G,Lin W,Faure M,Chen Y,Wei W,Li S J,Wang Q C. 2017. Mesozoic crustal thickening of the Longmenshan belt (NE Tibet,China) by imbrication of basement slices:Insights from structural analysis,petrofabric and magnetic fabric studies,and gravity modeling[J]. Tectonics,36(12):3110–3134. doi: 10.1002/2017TC004754
Yan D P,Zhou M F,Wei G Q,Gao J F,Liu S F,Xu P,Shi X Y. 2008. The Pengguan tectonic dome of Longmen mountains,Sichuan Province:Mesozoic denudation of a Neoproterozoic magmatic arc-basin system[J]. Science in China: Series D,51(11):1545–1559. doi: 10.1007/s11430-008-0126-0
Yao H J,van der Hilst R D,Montagner J P. 2010. Heterogeneity and anisotropy of the lithosphere of SE Tibet from surface wave array tomography[J]. J Geophys Res: Solid Earth,115(B12):B12307.
Zhang H J,Thurber C H. 2003. Double-difference tomography:The method and its application to the Hayward fault,California[J]. Bull Seismol Soc Am,93(5):1875–1889. doi: 10.1785/0120020190
Zhang H J,Thurber C H. 2006. Development and applications of double-difference seismic tomography[J]. Pure Appl Geophys,163(2/3):373–403.
Zhang P Z. 2013. A review on active tectonics and deep crustal processes of the western Sichuan region,eastern margin of the Tibetan Plateau[J]. Tectonophysics,584:7–22. doi: 10.1016/j.tecto.2012.02.021
Zhang Z Q,Yao H J,Wang W T,Liu C M. 2022. 3-D crustal azimuthal anisotropy reveals multi-stage deformation processes of the Sichuan basin and its adjacent area,SW China[J]. J Geophys Res: Solid Earth,127(1):e2021JB023289. doi: 10.1029/2021JB023289
Zhou M F,Yan D P,Wang C L,Qi L,Kennedy A. 2006. Subduction-related origin of the 750 Ma Xuelongbao adakitic complex (Sichuan Province,China):Implications for the tectonic setting of the giant Neoproterozoic magmatic event in South China[J]. Earth Planet Sci Lett,248(1/2):286–300.
-
期刊类型引用(1)
1. 覃燕媚. 自动化监测在公路边坡工程的设计应用. 住宅与房地产. 2024(17): 56-58 .  百度学术
百度学术
其他类型引用(2)


 下载:
下载:


