

Characteristics of seismic wave attenuation in Shanxi Reservoir area of Zhejiang Province
-
摘要: 2002—2007年发生的珊溪水库地震事件是少震、 弱震的浙江省区域显著的地震事件. 搜集182次ML>2.0地震的近场台站数字地震波形, 使用这些波形高信噪比的尾波时间域信号, 根据计算尾波Qc(f)值的Sato模型, 通过滤波及去除环境噪声, 计算了地震波传播路径上的尾波Qc(f)值; 拟合Qc(f)值与频率f之间的关系, 分析了水库区域地震波衰减的时空特征. 根据信噪比及计算要求, 从近场9个台站的记录中挑选出641条三分向记录, 计算尾波衰减参数, 得到尾波Qc(f)与频率f的关系为: Qc(f)=52.19±7.11f0.922 1±0.05. 结果表明, 本区域为低衰减区域. 震群活动使区域介质对高频率波衰减趋势性增大. 进一步对尾波衰减参数及尾波采样体之间的关系分析发现, 该区域存在深部高衰减层.Abstract: The earthquakes which occurred from 2002 to 2007 in Shanxi Reservoir area, Zhejiang Province, are very notable, because the province is not considered prone to earthquakes. We have collected waveform data of 182 ML>2.0 earthquakes recorded at near-source stations. By using the coda time series with high signal-to-noise ratio and filtering the data to eliminate background noises based on Sato model, the coda Qc(f) was calculated, and the relationship between Qc(f) and frequency (f) was obtained. Then, the characteristics of seismic wave attenuation in the reservoir area were analyzed. 641 three-component records chosen from 9 stations were used for this study. Our result shows that the relationship between the coda Qc(f) and f is: Qc(f)=52.19±7.11f0.9221±0.05, suggesting that the study area is a tectonically inactive zone. The attenuation coefficient for high frequency waves increases with seismic activity. Further analysis on the relationship between Qc(f) and sampling depth reveals that high attenuation layers exist deep beneath the study area.
-
Keywords:
- earthquake swarm /
- coda /
- attenuation coefficient /
- reservoir earthquakes
-
引言
尾波理论是地震波衰减研究的基本理论,Aki (1969)及Herraiz和Espinosa (1987)将地震图中所有直达波之后的部分称作尾波. 研究表明,不论地震震级大小,在基本相同的区域或路径,地震波尾波振幅随流逝时间的衰减基本相当.Aki (1969)认为,尾波是随机分布于一个椭球内的地壳和上地幔的无数间断面对地震波的散射波,震中和台站位于椭球体与地面垂直面相交椭圆的两个焦点上. 地震波的散射包括弱散射(或单次散射)(Aki,Chouet,1975; Sato,1977)、 多重散射(Gao et al,1983a, b)及强散射(或漫射)(Aki,1969)等. 其中,单次散射模型(Pulli,1984)假定散射场弱,无二次散射. Aki (1969)及Aki和Chouet (1975)在单次散射模型基础上提出了台、 源重合情况下的尾波衰减系数计算方法. 考虑到台、 源分离情况下震源至接收点距离的影响,Sato (1977))和Pulli (1984)对Aki和Chouet (1975)的尾波计算方法进行了必要的修正(Sato模型). 由于单次散射模型的计算方法简单而得到了广泛应用 (Liu et al,1994; Nava et al,1999; Castro et al,2003; Horasan,Guney,2004).
浙江珊溪水库区域属于浙东南褶皱带,走向北东的泰顺—温州断裂和走向北西的景宁—苍南断裂交叉穿过库区,构造复杂,但地震活动性很弱,历史上库区70 km范围内没有显著地震事件记录. 珊溪水库蓄水2.5年之后,该库区发生了显著的、 间隙性的地震活动. 虽然地震强度低,最大震级仅有ML4.6,但由于农村民居结构简单,抗震能力弱,因而水库地震在当地也造成了很大的经济损失 浙江省地震局. 2006. 珊溪水库活断层调查报告. .
本研究搜集近场记录的信噪比较高的数字地震波资料,采用单次散射的Sato计算模型,计算地震波衰减参数,以期对珊溪水库区域地震波衰减特征有一定的认识.
1. 理论与方法
根据Sato (1977)提出的尾波衰减系数计算方法,尾波振幅可以表达为

式中,AS为S波最大振幅; Ac(f)为流逝时间t对应的合成振幅,由式(3)和式(4)给出; K(a)为散射体附近的几何扩散因子,可表示为

式中,a=t/tS,tS为S波的流逝时间,t为从震源开始至尾波截断点的流逝时间

AT为一个采样周期T的地震波均方根振幅(Drouet et al,2005),ST(NS)和ST(EW)分别为南北及东西分量. An为Pg波到达前适当时间段(2 s)噪声均方根振幅,用以进行地震波的噪声校正(Pulli,1984). 对同一地震的同一频率,C(f)为常数,拟合出F(t)与(t-tS)的线性关系,得到b. b与Qc的关系由式(5)给出

衰减参数与频率的关系表示为

式中,Qc(f)为频率f时的尾波衰减参数,Q0为频率f=1时的尾波衰减参数,η代表尾波衰减参数Qc(f)对频率f的依赖性指数.
2. 资料及数据处理
2.1 资料条件
珊溪水库位于浙江省南部温州市飞云江干流上游河段,2001年底建成并开始蓄水. 2002年7月28日库区发生ML3.5地震,随后不断有小震发生. 同年9月5日发生了ML3.9 地震,之后ML2.0以上地震平静了2年,ML3.0以上地震平静了3.5年. 到2006年2月4日地震强度及频度突然升高,2006年2月9日发生的ML4.6地震为震群最大地震,至2008年7月25日库区共记录到ML>0地震达3 544次. 其中ML3.0—3.9地震48次,ML4.0—4.9地震11次. 根据朱新运等(2010)的研究结果,震群地震的最大深度为9.5 km,最浅1.7 km,震源深度平均4.7 km,震中呈北西向狭窄条带分布. 小震震源参数研究结果(于俊谊,朱新运,2008; 朱新运等,2010)表明,水库地震震源参数未表现出有别于构造地震的特征.
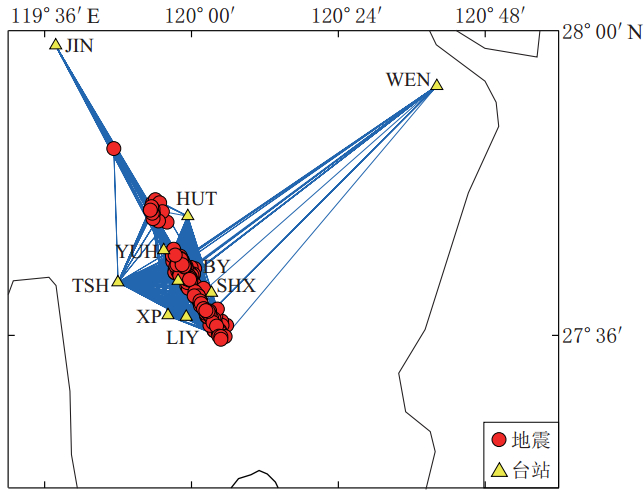
2006年2月4日震区发生ML3.5地震后,浙江省地震局迅速在震源区布设了流动台站(朱新运等,2010). 尽管该序列地震震级不大,但近距离流动台仍然获得了大量高信噪比数字地震波资料. 同时,WEZ和JIN两个固定台距震中区小于70 km,也记录了大量的数字地震波资料. 除了部分极短时间间隔连发地震无法进行尾波衰减参数计算之外,绝大部分资料可以获得稳定的尾波衰减参数. 本研究搜集了ML2.0以上近场记录的波形资料,根据信噪比及计算要求,从中挑选出共182 次地震在9个台站的641条记录,计算尾波衰 减参数. 地震震中、 台站及射线分布见图1.
![]() 图 1 台站、 震中及射线分布图(震中引自朱新运等,2010) WEZ: 温州台; JIN: 景宁台; HUT: 黄塘台;YUH: 云湖台; TSH: 泰顺台; BY: 包洋台;XP: 新浦台; SHX: 珊溪台; LIY: 联云台Figure 1. Seismic stations (triangles),epicenters (circles) and ray-paths (blue solid lines)
图 1 台站、 震中及射线分布图(震中引自朱新运等,2010) WEZ: 温州台; JIN: 景宁台; HUT: 黄塘台;YUH: 云湖台; TSH: 泰顺台; BY: 包洋台;XP: 新浦台; SHX: 珊溪台; LIY: 联云台Figure 1. Seismic stations (triangles),epicenters (circles) and ray-paths (blue solid lines)2.2 数据处理
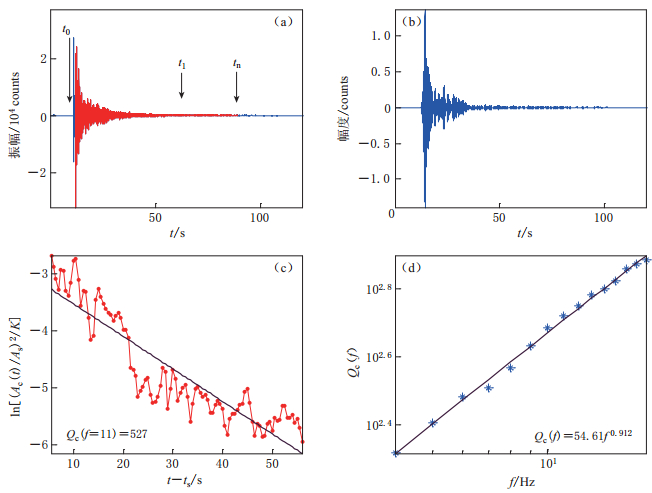
通过原始记录读取Pg和Sg震相到时. 在Pg波到时前取2 s为背景噪声,使用均方根振幅比作为信噪比,其值大于2满足尾波衰减参数进一步计算的基本条件,截取可用尾波波形(朱新运,2005,2006). 在满足信噪比的情况下,将流逝时间固定为60 s,在近场地9个台站记录的182次地震中,挑选出地震波记录641条. 对每条记录,确定分析频率段为4—18 Hz,间隔1 Hz,使用6阶Butterworth带通滤波器,对分析频率f,以[2/3f,4/3f]带宽滤波. 尾波从S波震相到时之后5 s开始起算,取采样窗长2 s,滑动步长0.5 s,根据式(3)和式(4)计算各时间点的合成振幅,求解尾波Qc(f); 根据式(6)拟合Qc(f)与f的关系,获得Q0及η. 计算过程见图2.
![]() 图 2 尾波衰减参数计算过程实例(a) 使用波形原始记录(仅绘EW向),tn表示满足信噪比条件的尾波截断点,t1表示尾波计算实际使用的尾波截断点,t0表示地震发震时刻(t1-t0=60 s); (b) f=11(f±1/3f)数据滤波实例; (c) 主频率为f=11的数据拟合; (d) Qc(f)与频率关系Figure 2. Examples of coda wave attenuation parameter calculation (a) E- -W component velocity seismogram,tn represents cutoff point of coda waves satisfying signal-to-noise ratio (SNR) condition,t1 denotes cutoff point of coda waves used in the calculation,t0 is the origin time (t1-t0=60 s); (b) Filtered seismogram (f=11(f±1/3f)); (c) Data fitting with f=11; (d) Relationship between Qc(f) and frequency
图 2 尾波衰减参数计算过程实例(a) 使用波形原始记录(仅绘EW向),tn表示满足信噪比条件的尾波截断点,t1表示尾波计算实际使用的尾波截断点,t0表示地震发震时刻(t1-t0=60 s); (b) f=11(f±1/3f)数据滤波实例; (c) 主频率为f=11的数据拟合; (d) Qc(f)与频率关系Figure 2. Examples of coda wave attenuation parameter calculation (a) E- -W component velocity seismogram,tn represents cutoff point of coda waves satisfying signal-to-noise ratio (SNR) condition,t1 denotes cutoff point of coda waves used in the calculation,t0 is the origin time (t1-t0=60 s); (b) Filtered seismogram (f=11(f±1/3f)); (c) Data fitting with f=11; (d) Relationship between Qc(f) and frequency3. 数据结果
3.1 按区域及台站统计的衰减系数特征
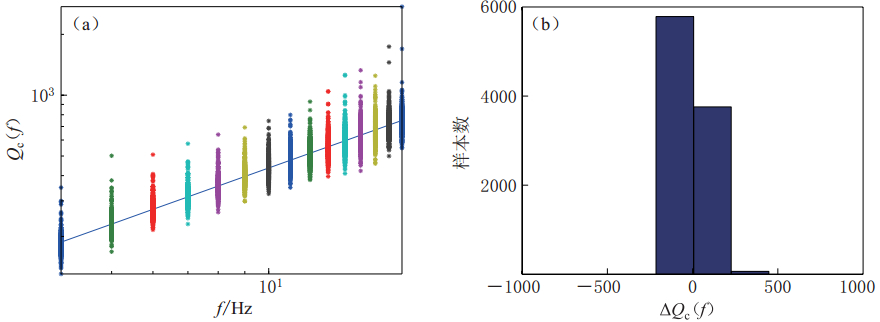
对全区域全部结果进行统计,地震波衰减参数可表示为式(7),数据分布见图3.

![]() 图 3 全区域所有台站记录的尾波衰减参数与频率关系 (a) Qc(f)与频率关系图,星号表示实测的Qc(f)值,实线表示衰减参数与频率的依赖关系; (b) 数据残差分布Figure 3. Qc(f) values versus frequency for all stations in the whole region (a) Relationship between Qc(f) and frequency,asterisk represents measuredQc(f),solid line shows Qc(f)-frequency dependency relation for the whole region; (b) Residual distribution
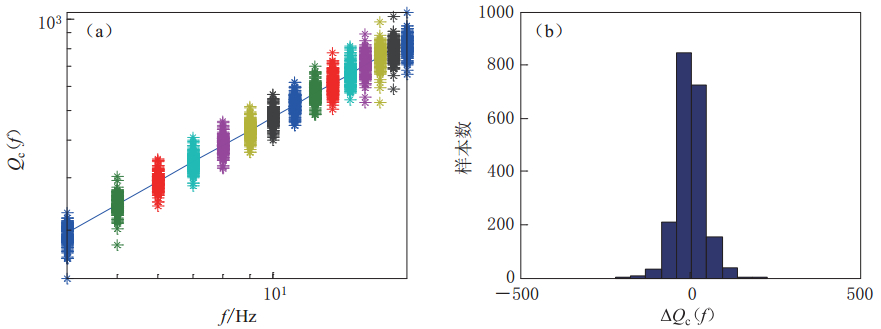
图 3 全区域所有台站记录的尾波衰减参数与频率关系 (a) Qc(f)与频率关系图,星号表示实测的Qc(f)值,实线表示衰减参数与频率的依赖关系; (b) 数据残差分布Figure 3. Qc(f) values versus frequency for all stations in the whole region (a) Relationship between Qc(f) and frequency,asterisk represents measuredQc(f),solid line shows Qc(f)-frequency dependency relation for the whole region; (b) Residual distribution为进一步进行数据分析,本研究按获取记录的台站统计地震波衰减参数与频率的关系,统计实例见图4及式(8),各台站统计的衰减参数见表1.
表 1 各台站数据统计结果Table 1. Statistical results of Q value from different stations
![]() 图 4 TSH台获得的Qc(f)与频率关系 (a) Qc(f)与频率关系图,星号表示实测的Qc(f)值,实线表示衰减参数与频率的依赖关系; (b) 数据残差分布Figure 4. Qc(f) obtained as a function of frequency for TSH station (a) Relationship between Qc(f) and frequency,asterisk represents measured Qc(f),solid line shows the Qc(f)-frequency dependency relation for the whole region; (b) Residual distribution
图 4 TSH台获得的Qc(f)与频率关系 (a) Qc(f)与频率关系图,星号表示实测的Qc(f)值,实线表示衰减参数与频率的依赖关系; (b) 数据残差分布Figure 4. Qc(f) obtained as a function of frequency for TSH station (a) Relationship between Qc(f) and frequency,asterisk represents measured Qc(f),solid line shows the Qc(f)-frequency dependency relation for the whole region; (b) Residual distribution由TSH台单台获得的尾波衰减系数关系为

This page contains the following errors:
error on line 1 at column 1: Start tag expected, '<' not foundBelow is a rendering of the page up to the first error.
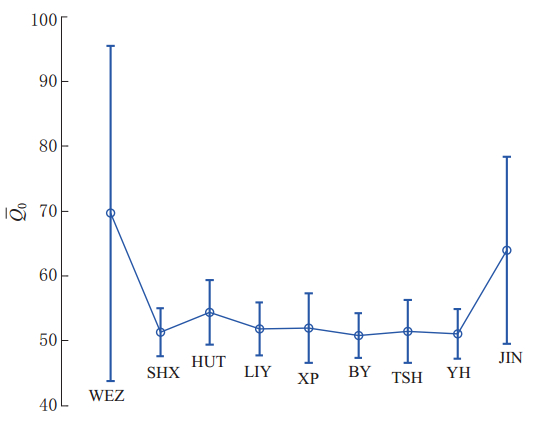
![]() 图 5
图 5This page contains the following errors:
error on line 1 at column 1: Start tag expected, '<' not foundBelow is a rendering of the page up to the first error.
Figure 5.
This page contains the following errors:
error on line 1 at column 1: Start tag expected, '<' not foundBelow is a rendering of the page up to the first error.
3.2 与地震序列同步的衰减系数变化
3.2.1 近距离记录的衰减系数统计特征
This page contains the following errors:
error on line 1 at column 1: Start tag expected, '<' not foundBelow is a rendering of the page up to the first error.
![]() 图 6
图 6This page contains the following errors:
error on line 1 at column 1: Start tag expected, '<' not foundBelow is a rendering of the page up to the first error.
Figure 6.This page contains the following errors:
error on line 1 at column 1: Start tag expected, '<' not foundBelow is a rendering of the page up to the first error.
This page contains the following errors:
error on line 1 at column 1: Start tag expected, '<' not foundBelow is a rendering of the page up to the first error.
3.2.2 TSH台记录的衰减系数特征
流动台稳定性较差,故障率较高,单台对序列地震记录的完整性较低. 从表1可以看出,共9个台站记录的182次地震中,实际获取的记录仅为641条,台均记录只有71条. 在9个台站中,相比而言记录最完整的是库区TSH台,在182次地震中记录到了135次. 按地震顺序绘制TSH台单台获得的Q0及η图(图7),由图7a可以看到,在地震序列发展过程中,尾波衰减系数Q0存在起伏变化,且前期起伏大,后期起伏小,但没有趋势性上升或下降,或趋势性特征不明显. 而由图7b所反映的η除了起伏变化外,整体上还表现出下降趋势. 根据式(6)中Qc(f),Q0,η及f的关系,在Q0不变的情况下,η越小,在频率高端的Qc(f)越低. 说明随着序列发展,高频率波衰减系数降低,衰减增大.
![]() 图 7 TSH台获得的尾波衰减参数Q0 (a)和η (b)随地震序列的变化Figure 7. Variation of coda Q0 (a) and η (b) values with the earthquake sequence at TSH station
图 7 TSH台获得的尾波衰减参数Q0 (a)和η (b)随地震序列的变化Figure 7. Variation of coda Q0 (a) and η (b) values with the earthquake sequence at TSH station4. 讨论与结论
This page contains the following errors:
error on line 1 at column 1: Start tag expected, '<' not foundBelow is a rendering of the page up to the first error.
表 2 国内外不同区域尾波衰减参数比较Table 2. Comparison of coda attenuation parameters obtained at home and abroad
地震活动与地震波衰减是两个互为相关的问题,一方面,地震波衰减系数反映区域介质非均匀性程度,而介质非均匀性正是地震活动的条件; 反过来,地震活动会降低地震波传播区域介质均匀程度. 地震平静期在应力作用下,震源区破裂介质也可能愈合,使震源区介质趋向均匀. 本研究结果表明,地震对区域介质衰减参数的影响与地震波频率有关. 无论频率高低,地震波衰减都是由介质对地震波的吸收、 散射及能量转换引起的,而介质对高、 低频率波的传播机制则有区别. 对于高频率波,波长短,无法衍射,即使在地震发生后震源区介质破碎的情况下,也难以达到衍射条件,能量的传播主要通过反射进行; 而低频率波波长长,在几何非均匀性介质中可以通过反射和衍射到达台站. 地震导致的震源区介质弹性程度降低,而非弹性程度升高,以被吸收或能量转化为主要特征的高频率波衰减增大,衰减系数降低; 对于低频率波则存在吸收或能量转化引起更大衰减及由于衍射而导致能量衰减程度减低这两个相互消长的过程,地震序列使η趋势性降低正好说明了这一点.
-
![]()
图 1 台站、 震中及射线分布图(震中引自朱新运等,2010) WEZ: 温州台; JIN: 景宁台; HUT: 黄塘台;YUH: 云湖台; TSH: 泰顺台; BY: 包洋台;XP: 新浦台; SHX: 珊溪台; LIY: 联云台
Figure 1. Seismic stations (triangles),epicenters (circles) and ray-paths (blue solid lines)
![]()
图 2 尾波衰减参数计算过程实例(a) 使用波形原始记录(仅绘EW向),tn表示满足信噪比条件的尾波截断点,t1表示尾波计算实际使用的尾波截断点,t0表示地震发震时刻(t1-t0=60 s); (b) f=11(f±1/3f)数据滤波实例; (c) 主频率为f=11的数据拟合; (d) Qc(f)与频率关系
Figure 2. Examples of coda wave attenuation parameter calculation (a) E- -W component velocity seismogram,tn represents cutoff point of coda waves satisfying signal-to-noise ratio (SNR) condition,t1 denotes cutoff point of coda waves used in the calculation,t0 is the origin time (t1-t0=60 s); (b) Filtered seismogram (f=11(f±1/3f)); (c) Data fitting with f=11; (d) Relationship between Qc(f) and frequency
![]()
图 3 全区域所有台站记录的尾波衰减参数与频率关系 (a) Qc(f)与频率关系图,星号表示实测的Qc(f)值,实线表示衰减参数与频率的依赖关系; (b) 数据残差分布
Figure 3. Qc(f) values versus frequency for all stations in the whole region (a) Relationship between Qc(f) and frequency,asterisk represents measuredQc(f),solid line shows Qc(f)-frequency dependency relation for the whole region; (b) Residual distribution
![]()
图 4 TSH台获得的Qc(f)与频率关系 (a) Qc(f)与频率关系图,星号表示实测的Qc(f)值,实线表示衰减参数与频率的依赖关系; (b) 数据残差分布
Figure 4. Qc(f) obtained as a function of frequency for TSH station (a) Relationship between Qc(f) and frequency,asterisk represents measured Qc(f),solid line shows the Qc(f)-frequency dependency relation for the whole region; (b) Residual distribution
![]()
图 5
This page contains the following errors:
error on line 1 at column 1: Start tag expected, '<' not foundBelow is a rendering of the page up to the first error.
Figure 5.
![]()
图 6
This page contains the following errors:
error on line 1 at column 1: Start tag expected, '<' not foundBelow is a rendering of the page up to the first error.
Figure 6.
This page contains the following errors:
error on line 1 at column 1: Start tag expected, '<' not foundBelow is a rendering of the page up to the first error.
![]()
图 7 TSH台获得的尾波衰减参数Q0 (a)和η (b)随地震序列的变化
Figure 7. Variation of coda Q0 (a) and η (b) values with the earthquake sequence at TSH station
表 2 国内外不同区域尾波衰减参数比较
Table 2 Comparison of coda attenuation parameters obtained at home and abroad
 下载: 导出CSV
-
刘芳, 苗春兰, 高艳玲. 2007. 内蒙古中西部地区尾波Q值研究[J]. 地震, 27(1): 72-75. 刘希强, 石玉燕, 曲均浩, 周彦文, 李红, 李铂, 张坤. 2009. 品质因子的尾波测定方法讨论[J]. 中国地震, 25(1): 11-23. 师海阔, 朱新运, 贺永忠, 张立恒. 2011. 基于Sato模型的宁夏及邻区尾波Q值研究[J]. 地震, 31(1): 118-126. 魏红梅, 贺曼秋, 黄世源, 王同军. 2009. 重庆荣昌地区尾波Qc值特征[J]. 西北地震学报, 31(1): 97-100. 于俊谊, 朱新运. 2008. 浙江珊溪水库地震震源参数研究[J]. 中国地震, 24(4): 379-387. 朱新运, 杨钢宇, 张震峰. 2005. 基于Sato模型的近震S波尾波Q值求解及分析软件研制[J]. 地震地磁观测与研究, 26(3): 63-70. 朱新运, 刘杰, 张帆. 2006. 基于Aki模型的近震S波尾波Q值求解及分析软件研制[J]. 地震研究, 29(1): 76-80. 朱新运, 张帆, 于俊谊. 2010. 珊溪水库精细地震定位及构造研究[J]. 中国地震, 26(4): 380-391. Aki K. 1969. Analysis of the seismic coda of local earthquakes as scatter waves[J]. J Geophys Res, 74(2): 615-631.
Aki K, Chouet B. 1975. Origin of coda waves: Source, attenuation and scattering effects[J]. J Geophys Res, 80(23): 3322-3342.
Amerbeh W B, Fairhead J D. 1989. Coda Q estimates in the Mount Cameroon volcanic region, West Africa[J]. Bull Seism Soc Amer, 79(5): 1589-1600.
Carpenter P J, Sanford A R. 1985. Apparent Q for upper crustal rocks in the central Rio Grande Rift[J]. J Geophys Res, 90(B10): 8661-8674.
Castro R R, Cecilio J R, Inzunza L, Orozco L, Sánchez J, Gálvez O, Farfán F J, Méndez I. 2003. Direct body wave Q estimates in northern Baja California Mexico[J]. Phys Earth Planet Inter, 103(1-2): 33-38.
Domínguez T, Rebollar C J. 1997. Regional variations of seismic attenuation from coda and Lg waves in northern Baja California[J]. J Geophys Res, 102(B7): 15259-15268.
Drouet S, Souriau A, Cotton F. 2005. Attenuation, seismic moments, and site effects for weak-motion events: Application to the Pyrenees[J]. Bull Seism Soc Amer, 95(5): 1731-1748.
Gao L S, Lee L C, Biswas N N, Aki K. 1983a. Comparison of the effects between single and multiple scattering on coda waves for local earthquakes[J]. Bull Seism Soc Amer, 73(2): 377-389.
Gao L S, Biswas N N, Lee L C, Aki K. 1983b. Effects of multiple scattering on coda waves in three-dimensional medium[J]. Pure Appl Geophys, 121(1): 3-15.
Herraiz M, Espinosa A F. 1987. Coda waves: A review[J]. Pure Appl Geophys, 125(4): 499-577.
Horasan G, Guney A B. 2004. S-wave attenuation in the Sea of Marmara, Turkey[J]. Phys Earth Planet Inter, 142(3-4): 215-224.
Jacobson R S, Shor G G, Shor J, Bée M. 1984. A comparison of velocity and attenuation between the Nicobar and Bengal deep sea fans[J]. J Geophys Res, 89(B7): 6181-6196.
Liu Z, Wuenscher M E, Herrmann R B. 1994. Attenuation of body waves in the central New Madrid seismic zone[J]. Bull Seism Soc Amer, 84(4): 1112-1122.
Nava F A, Arthur R G, Castro R R, Suarez C, Marquez B, Cornu F N, Saavedra G. 1999. S wave attenuation in the coastal region of Jalisco-Colima, Mexico[J]. Phys Earth Planet Inter, 115(3): 247-257.
Petukhin A, Irikura K, Shiro O, Kagawa T. 2003. Estimation of Q-values in the seismogenic and aseismic layers in the Kinki region, Japan, by elimination of the geometrical spreading effect using ray approximation[J]. Bull Seism Soc Amer, 93(4): 1498-1515.
Pitt A M, Hill D P, Walter S W, Jonson M J S. 2002. Midcrustal, long-period earthquakes beneath Northern California volcanic areas[J]. Seism Res Lett, 73(2): 144-152.
Pulli J J. 1984. Attenuation of coda waves in New England[J]. Bull Seism Soc Amer, 74(4): 1149-1166.
Sato H. 1977. Energy propagation including scattering effects: Single isotropic scattering approximation[J]. J Phys Earth, 25: 27-41.
Wong V, Cecilio C J, Munguía L. 2001. Attenuation of coda waves at the Tres Vírgenes volcanic area, Baja California Sur, México[J]. Bull Seism Soc Amer, 91(4): 683-693.
-
期刊类型引用(3)
1. 李姗姗,张小飞,李晓东,夏爱国. 2016年新疆轮台M_S 5.3地震序列尾波Q_c值分析. 地震地磁观测与研究. 2022(03): 18-24 .  百度学术
百度学术
2. 史水平,周斌,黄树生,阎春恒,郭培兰. 广西龙滩水库库区地震尾波衰减特征. 地震学报. 2020(02): 151-162+244 . 本站查看
3. 史水平,周斌,黄树生,陆丽娟,蒙陆斌,张帆. 2013年广西平果震群尾波衰减特征研究. 中国地震. 2015(04): 710-720 . 百度学术
其他类型引用(2)


计量
- 文章访问数: 561
- HTML全文浏览量: 241
- PDF下载量: 7
- 被引次数: 5
