

Variation of the main magnetic field in Chinese mainland during 20th century
-
摘要: 为了研究2 0世纪中国地区主磁场变化, 首先使用最新的全球模型IGRF11, CALS3K. 4 (3K. 4) 和GUFM1进行计算, 并分析了1900—1990年的主磁场年变率均值的变化; 然后基于1960—2000年以10年为间隔的实测数据, 结合全球模型CM4与区域模型泰勒(Taylor)多项式(TY)模型分析了中国地区主磁场的年变率分布及年变率均值, 并与上述几种全球模型进行了比较. 结果显示: 20世纪利用IGRF11, GALS3K.4和GUFM1模型得到的主磁场的年变率均值均很接近. 它们所绘制的1960—2000年中国地区的主磁场年变率分布类似. 其原因主要是由于它们的建模原理相同且截断阶数接近所致. 基于实测点绘制的年变率分布与全球模型基本一致, X分量的年变率逐年减少, Y、 Z、 F分量的年变率均呈现先减小后增大的趋势.但两者也存在一定差异, 主要原因是由于更高密度的实测点及使用区域模型所致. 结果还显示了基于实测值绘制的年变率均值变化与CM4较为接近. 作者认为 CM4模型可以较好地反映中国地区主磁场的变化.Abstract: In order to investigate the variation of main magnetic field in Chinese mainland during 20th century, the newest global modes, such as IGRF11, CALS3K. 4 (3K. 4) and GUFM1, were firstly adopted to calculate and analyze the mean values of annual rate of change (MAC) during 1900—1990. Combining the global mode, CM4, and regional model, Taylor polynomial (TY), we analyzed the distribution of annual rate of change (ARC) and MAC with interval of 10 years, based on survey data during 1960—2000, and then made a comparison with that of three global models. Results showed that the MACs are very close based on the models IGRF11, 3K. 4 and GUFM1 throughout the 20th century. These three models demonstrated the similar distribution of ARC in China during 1960—2000, which is resulted from the same modeling theory and closed truncation levels. The distributions of ARC based on global and TY models are basically consistent, that is, the X component of ARC decreases with years, and Y, Z, F firstly decrease and then increase. However, there were some tiny differences between global models and TY model, which is caused by the higher density of valid survey data and the usage of regional model. Results also showed that the MAC from TY model is consistent with that from CM4, indicating that the CM4 model is able to ideally reflect the variation of main magnetic field in Chinese mainland.
-
Keywords:
- main magnetic field /
- annual rate of change /
- Chinese mainland /
- geomagnetic model
-
-
![]()
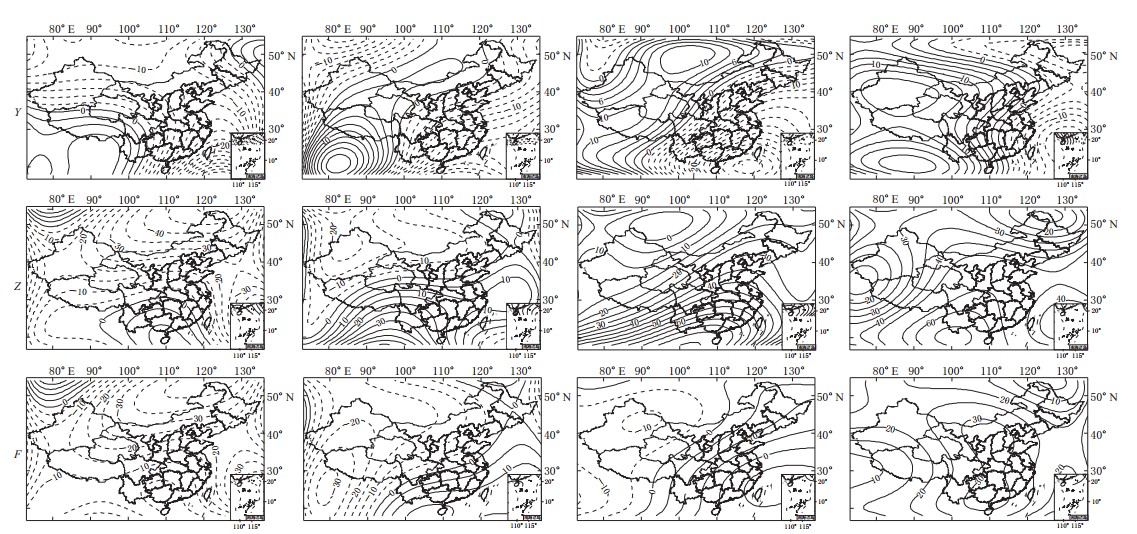
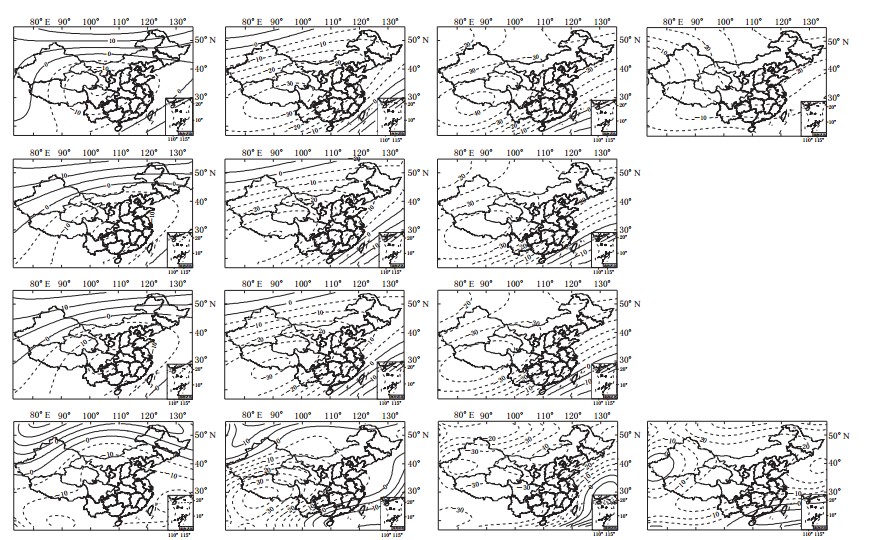
图 1 X分量的年变率分布图。从上到下分别为IGRF11,3K.4,GUFM1以及5阶TY模型
Figure 1. Distribution of annual rate of change(ARC)of component X from IGRF11(a),3K.4(b),GUFM1(c)and 5-degree Taylor model(d),respectively
![]()
图 2 基于实测值的5阶TY模型的年变率分布图。从上到下分别为Y,Z,F分量
Figure 2. Distribution of ARCs basedon 5-degree Taylor model.Top tobottom are Y,Z,F components
表 1 IGRF11, 3K.4和GUFM1模型的X, Y, Z和F分量在不同年代的年变率均值表(单位: nT/a)
Table 1 The mean values of annual rate of change (MAC) of X, Y, Z and F components based on IGRF11, 3K.4 and GUFM1 (unit: nT/a)
年份 X Y Z F IGRF11 3K.4 GUFM1 IGRF11 3K.4 GUFM1 IGRF11 3K.4 GUFM1 IGRF11 3K.4 GUFM1 1900—1910 -4.72 -1.56 -1.56 -18.82 -18.46 -18.47 24.01 29.28 29.30 18.16 24.68 24.68 1910—1920 -16.33 -15.88 -15.62 -34.57 -34.02 -34.02 16.70 17.84 17.88 5.20 6.22 6.24 1920—1930 -4.07 -4.28 -4.34 -27.66 -27.67 -27.68 12.68 15.66 15.69 10.26 12.20 12.21 1930—1940 16.01 19.48 19.26 -15.50 -16.09 -16.11 24.17 24.72 24.77 32.84 35.55 35.57 1940—1950 32.68 29.44 29.01 -9.64 -10.26 -10.28 42.52 36.68 36.72 59.23 51.84 51.86 1950—1960 14.69 19.52 19.92 -12.93 -13.49 -13.51 10.53 11.95 11.98 19.34 24.25 24.27 1960—1970 -0.57 -2.27 -2.28 -3.65 -5.08 -5.10 -13.61 -16.85 -16.81 -12.24 -15.93 -15.91 1970—1980 -13.25 -11.02 -11.04 -6.78 -5.75 -5.77 -2.41 -1.62 -1.61 -12.60 -10.39 -10.40 1980—1990 -23.58 -21.97 -21.99 -0.84 -2.00 -2.02 26.51 27.76 27.79 3.77 6.13 6.14  下载: 导出CSV
表 2 1960—2000年中国地区不同模型的X分量年变率均值(单位: nT/a)
Table 2 X component of MAC from 5 models in Chinese mainland during 1960—2000 (unit: nT/a)
年代 IGRF11 3K.4 GUFM1 CM4 TY 1960—1970 -13.25 19.52 19.92 -2.85 -4.50 1970—1980 -23.58 -2.27 -2.28 -11.41 -6.94 1980—1990 -15.84 -11.02 -11.04 -22.66 -24.12 1990—2000 -20.42 -21.97 -21.99 -15.88 -12.87
下载: 导出CSV
表 3 1960—2000年中国地区不同模型的Y分量年变率均值(单位: nT/a)
Table 3 Y component of MAC from 5 models in Chinese mainland during 1960—2000 (unit: nT/a)
年代 IGRF11 3K.4 GUFM1 CM4 TY 1960—1970 -6.78 -13.49 -13.51 -5.14 -6.05 1970—1980 -0.84 -5.08 -5.10 -5.59 -4.16 1980—1990 4.37 -5.75 -5.77 -0.41 -3.26 1990—2000 -15.61 -2.00 -2.02 4.02 4.41
下载: 导出CSV
表 4 1960—2000年中国地区不同模型的Z分量年变率均值(单位: nT/a)
Table 4 Z component of MAC from 5 models in Chinese mainland during 1960—2000 (unit: nT/a)
年代 IGRF11 3K.4 GUFM1 CM4 TY 1960—1970 -2.41 11.95 11.98 -16.42 -17.28 1970—1980 26.51 -16.85 -16.81 -2.73 0.32 1980—1990 41.76 -1.62 -1.61 27.02 27.44 1990—2000 37.85 27.76 27.79 41.79 39.11
下载: 导出CSV
表 5 1960—2000年中国地区不同模型的F分量年变率均值(单位: nT/a)
Table 5 F component of MAC from 5 models in Chinese mainland during 1960—2000 (unit: nT/a)
年代 IGRF11 3K.4 GUFM1 CM4 TY 1960—1970 -12.60 24.25 24.27 -16.47 -17.95 1970—1980 3.77 -15.93 -15.91 -11.56 -6.70 1980—1990 21.81 -10.39 -10.40 4.75 4.46 1990—2000 14.94 6.13 6.14 21.85 21.46
下载: 导出CSV
-
安振昌, 徐元芳, 王月华. 1991. 1950-1980年中国地区主磁场模型的建立与分析[J]. 地球物理学报, 34 (5): 585-593. 安振昌. 1998. 根据IGRF计算1995-2000年中国及邻区地磁长期变化[J]. 地球物理学进展, 13 (3): 79-82. 安振昌. 1999. 1900-2000年亚洲地磁场长期变化[J]. 地球物理学进展, 14 (2): 58-64. 安振昌. 2003. 1950-1990年中国地磁剩余场冠谐分析[J]. 地球物理学报, 46 (6): 767-771. 冯彦, 安振昌, 孙涵, 毛飞. 2010a. 利用地磁场综合模型CM4分析中国大陆地区地磁场变化[J]. 物理学报, 59 (12): 8941-8953. 冯彦, 安振昌, 孙涵, 毛飞. 2010b. 中国地区地磁正常场模型研究[J]. 地球科学进展, 25 (7): 723-729. 王亶文. 2003. 1950-1980年中国地区主磁场模型的建立与分析[J]. 地球物理学报, 46 (2): 171-174. 王亶文. 2004. 20世纪地磁长期变化场分析[J]. 地球物理学报, 47 (3): 423-427. 王亶文. 2005. 20世纪的地球偶极子磁场[J]. 地球物理学报, 48 (1): 52-55. 魏自刚, 徐文耀. 2001a. 地磁场的漂移运动和强度变化[J]. 地球物理学报, 44 (4): 500-509. 魏自刚, 徐文耀. 2001b. 地磁场西漂的纬度变化和频散特征[J]. 科学通报, 46 (18): 1563-1567. 徐文耀, 孙炜. 1998. 1900-2000年地球主磁场的本征模分析[J]. 地球物理学报, 14 (1): 1-9. 徐文耀, 魏自刚, 马石庄. 2000. 20世纪地磁场的剧烈变化[J]. 科学通报, 45 (14): 1563-1566. Bellager E, Le Mouel J L, Mandea M, Labrosse S. 2001. Changler wobble and geomagnetic jerks[J]. Phys Earth Planet Inter, 124 (1-2): 95-103.
Bloxham J, Gubbins D. 1985. The secular variation of Earth's magnetic field[J]. Nature, 317 : 777-781.
Bloxham J, Jackson A. 1991. Fluid flow near the surface of Earth's outer core[J]. Rev Geophys, 29 (1): 97-120.
Bondi H, Gold T. 1950. On the generation of magnetism by fluid motion[J]. Mon Not R Astro Soc, 110 : 607-611.
Gallet Y, Genevey A, Courtillot V. 2003. On possible occurrence of 'archaeomagnetic jerks' in the geomagnetic field over the past three millennia[J]. Earth Planer Sci Lett, 214 (1/2): 237-242.
Glatzmaier G A, Coe R S, Hongre L, Roberts P H. 1999. The role of the Earth's mantle in controlling the frequency of geomagnetic reversals[J]. Nature, 401 : 885-890.
Glatzmaiers G A, Roberts P H. 1995. A three-dimentional self-consistent computer simulation of geomagnetic field reversal[J]. Nature, 377 : 203-209.
Gubbins D. 1982. Finding core motions from magnetic observations[J]. Philos Trans R Soc London, Ser A, 306 (1): 247-256.
Hulot G, Sabaka T J, Olsen N. 2007. Treatise in Geophysics[M]. Amsterdam: Elsevier Ltd: 1-589.
IAGA. 2010. Working Group V-MOD. International geomagnetic reference field: The eleventh generation[J]. Geophys J Int, 183 : 1216-1230.
Jackson A, Jonkers A R T, Walker M R. 2000. Four centuries of geomagnetic secular variation from historical records[J]. Phil Trans R Soc London, Ser A, 358 (1768): 957-990.
Jault D, Gire C, Le Mouel J L. 1988. Westward drift, core motions and exchanges of angular momentum between core and mantle[J]. Nature, 336 : 353-356.
Korte M, Constable C. 2011. Improving geomagnetic field reconstructions for 0-3 ka[J]. Phys Earth Planet Inter, 188 (3/4): 247-259.
Kuang W, Bloxham J. 1997. An earth-like numerical dynamo model[J]. Nature, 389 : 371-374.
Malin S R C, Saunders I. 1973. Rotation of the Earth's magnetic field[J]. Nature, 245 : 25-26.
Maus S, Barckhausen U, Berkenbosch H, Bournas N, Brozena J, Childers V, Dostaler F, Fairhead J D, Finn C, Von Frese R R B, Gaina C, Golynsky S, Kucks R, Luhr H, Milligan P, Morgan S, Muller D, Olsen O, Piklington M, Saltus R, Schreckenberger B, Thebault E, Tontini T C. 2009. EMAG2: A 2-arc-minute resolution earth magnetic anomaly grid compiled from satellite, airborne and marine magnetic measurements[J]. J Geophys Res, 10 (8), doi:10.1029/2009GC002471.
Mioara A, Courtillot V, Le Mou J. 1997. High-resolution secular variation of the geomagnetic field in western Europe over the last 4 centuries: Comparison and integration of historical data from Pairs and London[J]. J Geophys Res, 102 (B9): 20245-20258.
Olson P. 1997. Geophysics: Probing Earth's dynamo[J]. Nature, 389 : 337-338.
Roberts P H, Scott S. 1965. On analysis of the secular variation (1). A hydromagnetic constraints: Theory[J]. J Geomag Geoelectr, 17 (2): 137-151.
Sabaka T J, Olsen N, Purucker M E. 2004. Extending comprehensive models of the Earth's magnetic field with Oersted and CHAMP data[J]. Geophys J Int, 159 : 521-547.
计量
- 文章访问数: 512
- HTML全文浏览量: 235
- PDF下载量: 17
