

Parameter characteristics in the early period of three earthquake sequences in the Yutian, Xinjiang since 2008
-
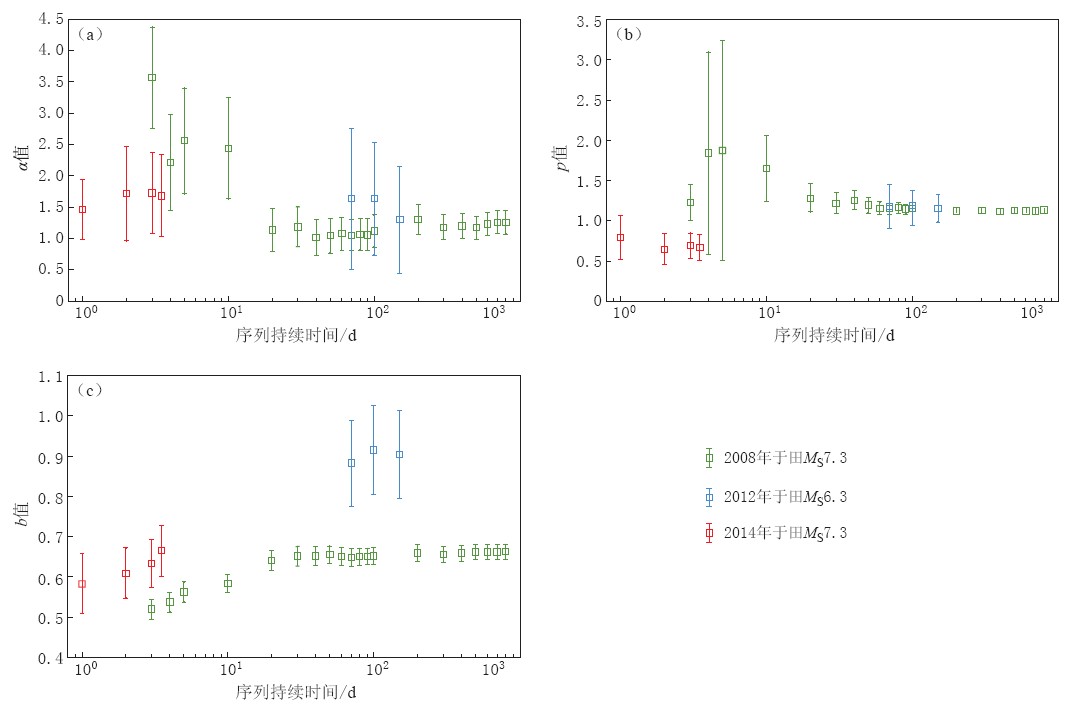
摘要: 考察新疆于田地区2008年以来发生的2008年3月21日MS7.3、 2012年8月12日MS6.3和2014年2月12日MS7.3等3个地震序列的参数早期特征, 利用“时空传染型余震序列”(ETAS)模型进行了参数估计. 统一选用截止震级Mc=ML3.0, 并使用最大似然法分别估算了这3个序列不同持续时间的α、 p和b等参数. 研究结果表明, 3个地震序列的参数差异明显, 其中: 2014年MS7.3地震序列α值与2012年MS6.3地震序列接近, 但高于2008年MS7.3地震序列; 2014年MS7.3地震序列p值较低, 表明当前序列衰减缓慢; 2012年MS6.3地震序列b值最大, 2014年MS7.3地震序列次之, 2008年MS7.3地震序列最小. 此外, 2008年MS7.3地震序列参数在震后20天内变化较为显著, 而2014年MS7.3地震序列的α值和p值在震后3.5天内则相对稳定.
-
关键词:
- /
- 2014年2月12日新疆于田MS7.3地震 /
- 余震 /
- 地震序列 /
- ETAS模型
Abstract: To investigate the characteristics of various earthquake sequences, we fitted three aftershock sequences of the March 21, 2008 MS7.3 earthquake, the August 12, 2012 MS6.3 earthquake, and the February 12, 2014 MS7.3 earthquake respectively with the epidemic-type aftershock sequence (ETAS) model. We set a unified cutoff magnitude Mc=ML3.0 and adopted the maximum likelihood method to estimate the parameters α, p and b of these sequences with different duration times. It is observed that the α, p and b value are significantly different for the three earthquake sequences. The α value of 2014 MS7.3 earthquake sequence is close to the 2012 MS6.3 earthquake sequence, and larger than that of the 2008 MS7.3 earthquake sequence; a smaller p value of the 2014 MS7.3 earthquake sequence indicates that it has a slow decay rate of aftershocks compared with the other two sequences; the b value of 2014 MS7.3 earthquake sequence is larger than the 2008 MS7.3 earthquake sequence, but smaller than the 2012 MS6.3 earthquake sequence. Moreover, the parameters of 2008 MS7.3 earthquake sequence change significantly within 20 days after the mainshock, while the α and p values of the 2014 MS7.3 earthquake sequence keep stable in the first 3.5 days.-
Keywords:
- 12 February 2014 Yutian /
- Xinjiang MS7.3 earthquake /
- aftershock /
- earthquake sequence /
- ETAS model
-
-
![]()
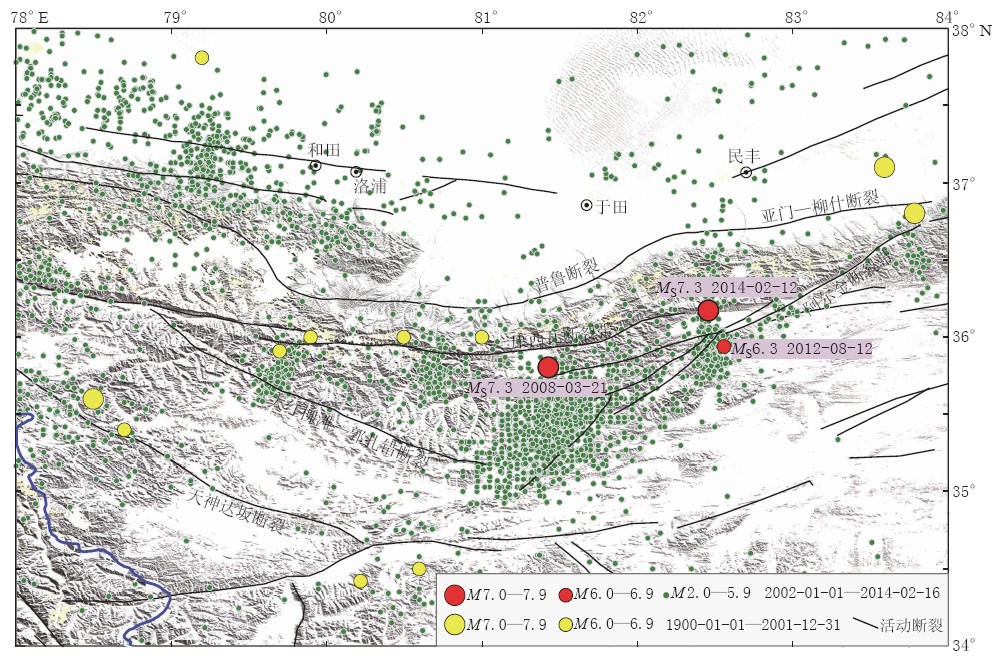
图 1 新疆于田地区活动构造与地震分布
Figure 1. Tectonic and distribution of earthquakes in the Yutian region of Xinjiang
![]()
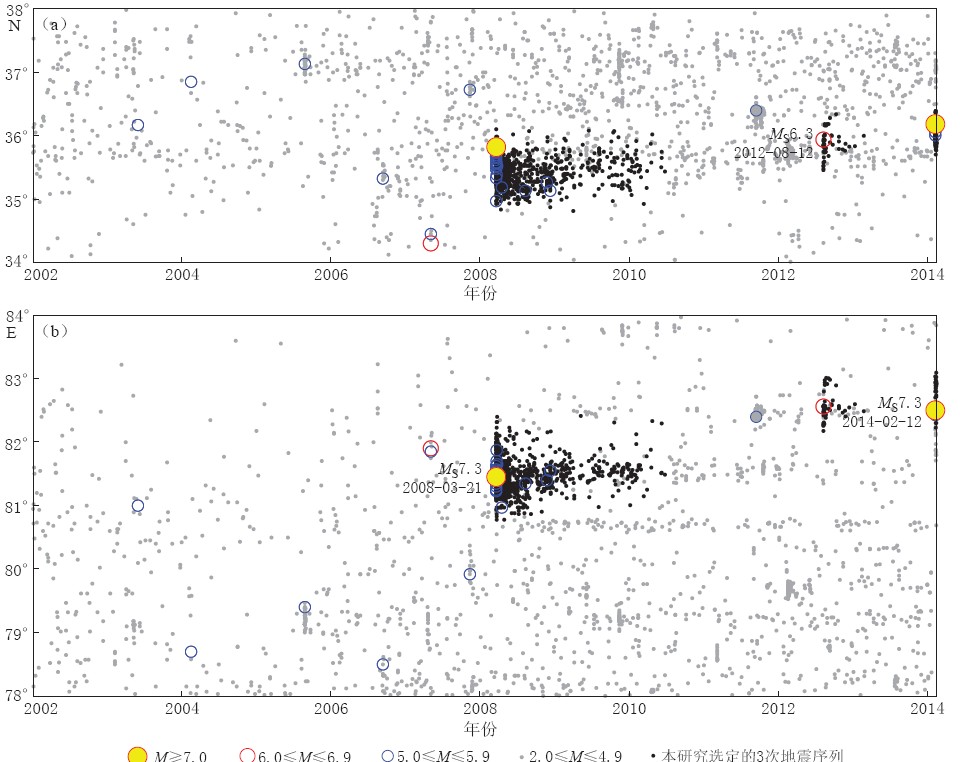
图 2 2002年以来新疆于田地区地震活动时空分布. (a) 纬度-时间分布图; (b) 经度-时间分布图
Figure 2. Spatio-temporal distribution of seismicity in the Yutian region, Xinjiang since 2002 (a) Latitude-time plot; (b) Longitude-time plot
![]()
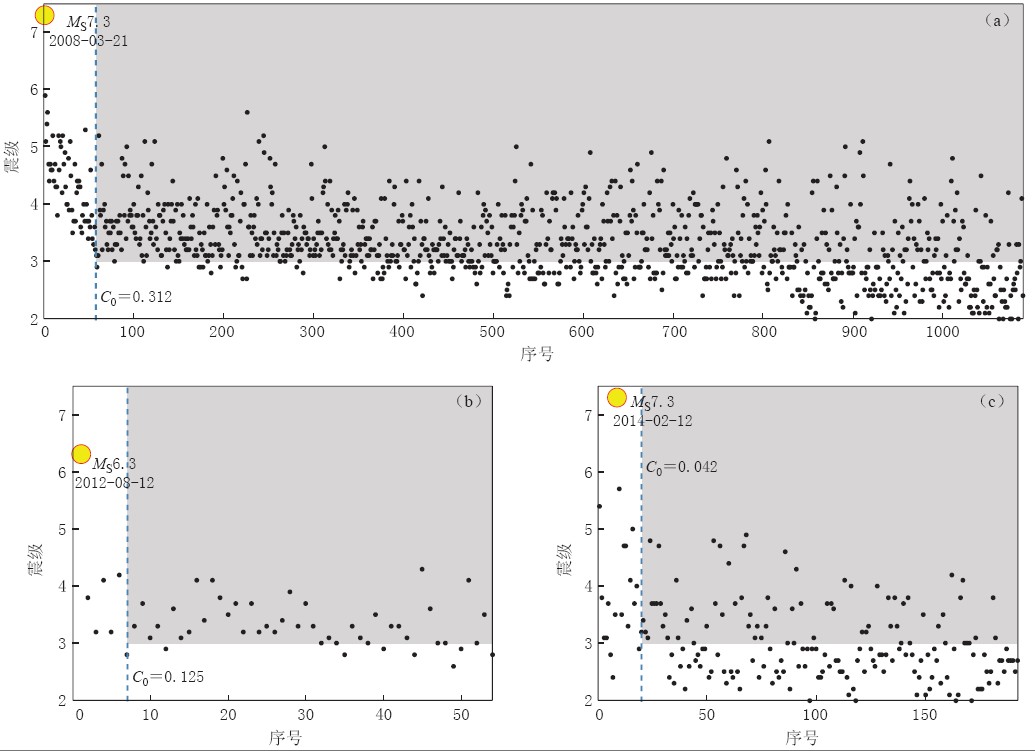
图 3 2008年3月21日(a)、 2012年8月12日(b)和2014年2月12日(c)3个于田地震序列震级-序号图. 图中黄色实心圆标出了主震位置, 垂直虚线标出了截止震级为ML3.0时地震目录完整的初始时间位置(C0表示距离主震的时间, 单位: d)
Figure 3. Magnitude-rank distribution of three earthquake sequences (a) 21 March 2008 Yutian MS7.3 earthquake sequence; (b) 12 August 2012 Yutian MS6.3 earthquake sequence; (c) 12 February 2014 Yutian MS7.3 earthquake sequence. Yellow dots show the position of mainshock, and the vertical dashed lines indicate the starting time of ETAS model fitting, C0, which accords to the magnitude completeness of ML3.0
![]()
图 4 利用ETAS模型对2014年MS7.3于田地震序列的拟合(a) 累积地震数在“转换时间”(τ)域的拟合情况, 图中深蓝色实线为累积地震数, 虚线为ETAS理论曲线; (b) “转换时间”域的地震序列
Figure 4. Residual analysis results from fitting the ETAS model to M ≥ML3.0 of the 2014 Yutian MS7.3 earthquake sequence(a) Cumulative numbers of earthquakes (the deep blue curve) against transformed time τ with a comparison to the their theoretical values (the thick dashed line); (b) Plot of magnitude against transformed time calculated according to equation (3)
![]()
图 5 ETAS模型给出的2014年于田MS7.3地震序列的条件强度曲线(a)和M-t图(b).图(a)纵坐标上的频次指每天发生的地震次数
Figure 5. Conditional intensity of the 2014 Yutian MS7.3 earthquake sequence fitted by ETAS model (a) and M -t plot (b), where cutoff magnitude Mc of the earthquake sequence is ML3.0.The frequency on the ordindte axis in Fig.(a) means the number of earthquakes per day
-
蒋长胜, 吴忠良. 2011. 2010年玉树MS7.1地震前的中长期加速矩释放(AMR)问题[J]. 地球物理学报, 54(6): 1501-1510. Jiang C S, Wu Z L. 2011. Intermediate-term medium-range Accelerating Moment Release (AMR) prior to the 2010 Yushu MS7.1 earthquake[J]. Chinese Journal of Geophysics, 54(6): 1501-1510 (in Chinese).
蒋长胜, 吴忠良, 韩立波, 郭路杰. 2013a. 地震序列早期参数估计和余震概率预测中截止震级Mc的影响: 以2013年甘肃岷县漳县6.6级地震为例[J]. 地球物理学报, 56(12): 4048-4057. Jiang C S, Wu Z L, Han L B, Guo L J. 2013a. Effect of cutoff magnitude Mc of earthquake catalogues on the early estimation of earthquake sequence parameters with implication for the probabilistic forecast of aftershocks: The 2013 Minxian-Zhangxian, Gansu, MS6.6 earthquake sequence[J]. Chinese Journal of Geophysics, 56(12): 4048-4057 (in Chinese).
蒋长胜, 庄建仓, 龙锋, 韩立波, 郭路杰. 2013b. 2013年芦山MS7.0地震序列参数的早期特征: 传染型余震序列模型计算结果[J]. 地震学报, 35(5): 661-669. Jiang C S, Zhuang J C, Long F, Han L B, Guo L J. 2013b. Statistical analysis of ETAS parameters in the early stage of the 2013 Lushan MS7.0 earthquake sequence[J]. Acta Seismologica Sinica, 35(5): 661-669 (in Chinese).
蒋海昆, 郑建常, 吴琼, 曲延军, 李永莉. 2007. 传染型余震序列模型震后早期参数特征及其地震学意义[J]. 地球物理学报, 50(6): 1778-1786. Jiang H K, Zheng J C, Wu Q, Qu Y J, Li Y L. 2007. Earlier statistical features of ETAS model parameters and their seismological meanings[J]. Chinese Journal of Geophysics, 50(6): 1778-1786 (in Chinese).
Aki K. 1965. Maximum likelihood estimate of b in the formula logn=a-bm and its confidence limits[J]. Bull Earthquake Res Inst Tokyo Univ, 43(2): 237-239.
Daley D D, Vere-Jones D. 2003. An Introduction to the Theory of Point Processes: Volume 1: Elementary Theory and Methods[M]. 2nd Edition. New York: Springer: 17, 33.
Falcone G, Console R, Murru M. 2010. Short-term and long-term earthquake occurrence models for Italy: ETES, ERS and LTST[J]. Annals of Geophysics, 53(3): 41-50. doi:10.4401/ag-4760.
Gerstenberger M C, Wiemer S, Jones L M, Reasenberg P A. 2005. Real-time forecasts of tomorrow's earthquakes in California[J]. Nature, 435: 328-331. doi:10.1038/nature03622.
Helmstetter A, Kagan Y Y, Jackson D D. 2006. Comparison of short-term and long-term earthquake forecast models for southern California[J]. Bull Seismol Soc Am, 96(1): 90-106.
Huang Q. 2006. Search for reliable precursors: A case study of the seismic quiescence of the 2000 western Tottori prefecture earthquake[J]. J Geophys Res, 111(B4): B04301. doi:10.1029/2005JB003982.
Iwata T. 2008. Low detection capability of global earthquakes after the occurrence of large earthquakes: Investigation of the Harvard CMT catalogue[J]. Geophys J Int, 174(3): 849-856.
Kagan Y Y, Bird P, Jackson D D. 2010. Earthquake patterns in diverse tectonic zones of the globe[J]. Pure Appl Geophys, 167(6/7): 721-741.
Ogata Y. 1988. Statistical models for earthquake occurrences and residual analysis for point processes[J]. J Amer Statist Assoc, 83(401): 9-27.
Ogata Y. 1989. Statistical model for standard seismicity and detection of anomalies by residual analysis[J]. Tectonophy-sics, 169(1/2/3): 159-174.
Ogata Y. 1992. Detection of precursory relative quiescence before great earthquakes through a statistical model[J]. J Geophys Res, 97(B13): 19845-19871.
Ogata Y. 2001. Increased probability of large earthquakes near aftershock regions with relative quiescence[J]. J Geophys Res, 106(B5): 8729-8744.
Omori F. 1894. On aftershocks of earthquakes[J]. J Coll Sci Imp Univ Tokyo, 7: 11-200.
Reasenberg P A, Jones L M. 1989. Earthquake hazard after a mainshock in California[J]. Science, 243: 1173-1176.
Shi Y, Bolt B A. 1982. The standard error of the magnitude frequency b-value[J]. Bull Seismol Soc Am, 72(5): 1677-1687.
Utsu T. 1961. A statistical study on the occurrence of aftershocks[J]. Geophys Mag, 30: 521-605.
Utsu T. 1965. A method for determining the value of b in a formula logn=a-bm showing the magnitude frequency for earthquakes[J]. Geophys Bull Hokkaido Univ, 13: 99-103.
Werner M J, Helmstetter A, Jackson D D, Kagan Y Y. 2011. High-resolution long-term and short-term earthquake forecasts for Califonia[J]. Bull Seismol Soc Am, 101(4): 1630-1648.
Zhuang J. 2011. Next-day earthquake forecasts for the Japan region generated by the ETAS model[J]. Earth Planets Space, 63(3): 207-216.
Zhuang J, Harte D, Werner M J, Hainzl S, Zhou S. 2012. Basic models of seismicity: Temporal models[G]//Community Online Resource for Statistical Seismicity Analysis. [2014-02-13]. http://www.corssa.org. doi: 10.5078/corssa-79905851.
 下载:
下载:


计量
- 文章访问数: 681
- HTML全文浏览量: 262
- PDF下载量: 28
