

The effect of P wave velocity on the H-k stacking results of receiver functions
-
摘要: 从公式推导、 不同模型数值试验和实际资料处理等3个方面, 系统研究了P波速度vPP对接收函数H(地壳厚度)-k(波速比)叠加搜索结果的影响. 结果表明, vPP的变化与H正相关, 与k负相关; 且地壳模型越复杂, vPP对H的影响越大.Abstract: This paper systematically investigates the effect of P wave velocity on the H-k stacking results of receiver functions by three aspects of theoretical analyses, numerical tests and observed data processing. The results show that the P wave velocity is positively correlated with crustal depth H, and negatively correlated with wave velocity ratio k. Moreover, the more complex the crust model is, the larger effect P wave velocity has on H.
-
Keywords:
- P wave velocity /
- H-k stacking /
- receiver function
-
引言
远震P波接收函数是用远震P波波形的垂直分量对径向分量和切向分量作反褶积后得到的时间序列,由于它在很大程度上消除了震源时间函数和传播路径的影响,可以近似地认为代表了台站下方壳幔结构的响应.接收函数方法自1979年由Langston(1979)提出以后,不断地得到发展和完善.为利用接收函数资料确定地震台站下方的地壳厚度H和波速比k,Zhu和Kanamori(2000)提出了一种通过叠加不同震中距单台多震接收函数的一次转换波和多次波来约束地壳厚度H和平均波速比k的方法,即H-k搜索叠加方法.该方法因可以快速处理大量的数据而被广泛应用于地壳和上地幔结构研究,现已成为天然地震波资料处理的一种常规手段.
远震P波接收函数主要由直达波、 台站下方速度界面产生的P--S转换波及不同速度界面之间的多次反射波等震相组成. 接收函数H-k方法正是利用径向接收函数的Ps,PpPs及PpSs+PsPs震相与直达P波的到时信息共同约束Moho间断面深度与地壳平均波速比.自接收函数方法提出以来,前人已经运用该方法在不同区域进行了大量的研究工作(Ramesh et al, 2002,2005; 李永华等,2006; Tomlinson et al,2006; 王峻等,2009; 葛粲等,2011; 黄海波等,2011; 刘琼林等,2011; 刘文学等,2011; Pan,Niu,2011; 郭震等,2012). 这些研究基本上都是采用给定P波速度vPP计算研究区的地壳厚度和波速比.此外,针对H-k方法本身的研究,也一直备受关注. 例如,倾斜界面对H-k搜索结果的影响(Lombardi et al,2007; Wang et al, 2010),各向异性地层对H-k搜索结果的影响(查小惠等,2013)等. 运用H-k方法时,当地壳的平均P波速度改变时,所估算的地壳厚度和波速比会发生相应的改变.为了减小vPP对H-k方法结果的影响,Ma和Zhou(2007)联合接收函数与面波频散曲线,通过选择不同的vPP,使接收函数与面波频散结果尽量一致,从而确定一个合理的vPP,进而确定地壳厚度和波速比; 沈旭章等(2011)将该方法运用于龙门山断裂带下方地壳速度结构的研究.但前人并未系统分析vPP对接收函数H-k方法的影响.基于此,本文通过理论计算、 数值模拟和实际资料处理,系统分析了vPP的变化对H-k搜索结果的影响.
1. 原理
接收函数H-k方法中涉及到震相的射线路径和各震相到时,如图 1所示.为了定量分析vPP的变化对H-k搜索结果的影响,在此引入下面公式(Yang et al,2011):
![]() 图 1 单层模型中Ps, PpPs, PpSs+PsPs震相射线路径(左)及接收函数(右)示意图Figure 1. Ray paths of Ps, PpPs and PpSs+PsPs (left panel) and synthetic receiver functions (right panel) for one-layer simple model
图 1 单层模型中Ps, PpPs, PpSs+PsPs震相射线路径(左)及接收函数(右)示意图Figure 1. Ray paths of Ps, PpPs and PpSs+PsPs (left panel) and synthetic receiver functions (right panel) for one-layer simple model
式中,p为射线参数,H为地壳厚度,k为波速比; vPP和vPS分别为P波、 S波速度; tP,tPs,tPpPs和tPsPs分别表示初至P,Ps,PpPs和PsPs震相到时.
为了分析vPP对地壳厚度H和波速比k的影响,式(1)、(2)的两边分别对vPP求偏导:

式中ΔH和Δk分别是H和k对ΔvPP的偏增量. 例如,选取vPP=6.1 km/s、 k=1.73、 H=30 km时,根据式(3)和式(4)可以得到

式(5)和式(6)表明,当vPP偏离真实值0.1 km/s时,所确定的地壳厚度结果会偏离约0.57 km,而波速比结果会偏离约0.003. 公式推导总体上表明,vPP的变化与H的结果正相关,而与k的结果负相关.
2. 数值试验
vPP的变化会对接收函数波形特别是震相到时产生影响,从而影响H-k叠加搜索结果. 为了直观地显示vPP对H-k方法结果的影响,本文计算不同模型的理论接收函数,然后对其理论接收函数分别进行H-k叠加搜索. 通过比较不同vPP的搜索结果与真实值之间的差别,研究vPP对H-k搜索结果的影响.本文选择了3种地壳模型,即单层模型、 双层模型及存在低速梯度带的双层模型(图 2),分别讨论vPP对H-k搜索结果的影响. 每组地壳模型vPP以实际值为中心,前后以0.05 km/s为间隔进行20次试验,以考察vPP的变化对H-k叠加搜索结果的影响.
![]() 图 2 数值试验的理论地壳模型(a) 单层模型; (b) 双层模型; (c) 含梯度带的双层模型Figure 2. Three theoretical crustal models for numerical test(a) One-layered model; (b) Two-layered model; (c) Two-layered model with a gradient structure
图 2 数值试验的理论地壳模型(a) 单层模型; (b) 双层模型; (c) 含梯度带的双层模型Figure 2. Three theoretical crustal models for numerical test(a) One-layered model; (b) Two-layered model; (c) Two-layered model with a gradient structure对每一个模型使用反射率法(Aki,Richards,2002)计算震中距30°—90°内,共61个不同震中距径向分量的理论接收函数,采样间隔为0.05 s,并用高斯因子为2.5的滤波器进行滤波; 然后改变vPP的大小,进行H-k搜索.通过比较搜索结果与真实值间的差别,分析vPP对H-k搜索结果的影响.
第一组模型为单层模型(图 2a),其下层是无限半空间,地壳厚度30 km,选取vPP值为6.10 km/s; 第二组模型为双层模型(图 2b),在20 km处存在一个壳内间断面,地壳厚度为35 km,地壳以下为无限半空间,壳内平均速度为6.15 km/s; 第三组模型(图 2c)为在壳内20—30 km深处存在一个厚度为10 km的低速梯度带,壳内平均P波速度为6.25 km/s,地壳厚度为35 km,地壳以下为无限半空间. 3组模型中波速比k均为1.73.
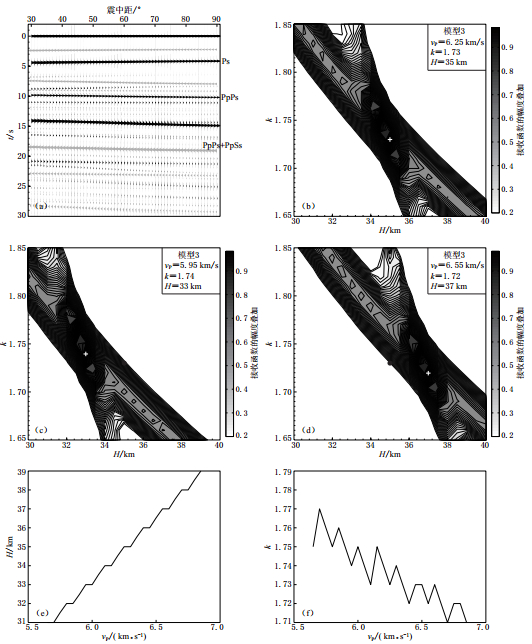
由第一组单层模型(模型1)计算得到的理论接收函数和H-k搜索结果分别如图 3a,b所示. 图 3c,d为改变vPP输入,运用接收函数H-k搜索得到的结果. 其中,图 3c为输入vPP值比预设vPP值小0.3 km/s时H-k的搜索结果,图 3d为输入vPP值比预设vPP值大0.3 km/s时H-k的搜索结果. 图 3e,f分别为地壳厚度H和波速比k随vPP的变化. 通过对比vPP改变时走时曲线的变化发现,随着vPP增大,Ps转换震相的到时变化很小,而PpPs震相的到时则明显变大,随着vPP减小,Ps转换震相的到时同样变化很小,而PpPs震相的到时则明显变小. 根据式(1)和式(3)可知,vPP增大时必然导致H的高估. 根据图 3e可看出,随着vPP的变化,地壳厚度H有明显的变化,即地壳厚度H随着vPP的增大而增大,vPP增大0.1 km/s,H的最大偏离值约为0.5 km; 而当vPP变化较小时,其对k的影响亦较小. 根据图 3f可看出随着vPP的增大k有减小的趋势.
![]() 图 3 单层模型数值试验结果(a) 理论接收函数; (b)、 (c)和(d)分别表示vPP为预设值、 小于预设值0.3 km/s和大于预设值0.3 km/s时H-k方法的搜索结果. 白色“+”为数据计算得到的结果, 黑色圆点表示预设模型; (e)和(f)分别表示数值模拟试验中地壳厚度H和波速比k随vPP的变化Figure 3. Numerical test for the one-layer model(a) Theoretical receiver functions; (b--d) H-k stacking results with default vPP, smaller vPP (0.3 km/s less than default vPP ) and larger vPP (0.3 km/s larger than default vPP), respectively. The white crosses represent the calculated values, black dots represent the default values, gray bars represent the stacking amplitude of receiver functions;(e) H versus vPP in numerical tests; (f) k versus vPP in numerical tests
图 3 单层模型数值试验结果(a) 理论接收函数; (b)、 (c)和(d)分别表示vPP为预设值、 小于预设值0.3 km/s和大于预设值0.3 km/s时H-k方法的搜索结果. 白色“+”为数据计算得到的结果, 黑色圆点表示预设模型; (e)和(f)分别表示数值模拟试验中地壳厚度H和波速比k随vPP的变化Figure 3. Numerical test for the one-layer model(a) Theoretical receiver functions; (b--d) H-k stacking results with default vPP, smaller vPP (0.3 km/s less than default vPP ) and larger vPP (0.3 km/s larger than default vPP), respectively. The white crosses represent the calculated values, black dots represent the default values, gray bars represent the stacking amplitude of receiver functions;(e) H versus vPP in numerical tests; (f) k versus vPP in numerical tests第二组为双层模型(模型2),计算得到的理论接收函数和H-k搜索结果分别如图 4a,b所示. 图 4c,d为改变vPP输入,运用接收函数H-k方法搜索得到的结果.其中,图 4c为输入vPP值比预设vPP值小0.3 km/s时H-k的搜索结果,图 4d为输入vPP值比预设vPP值大0.3 km/s时H-k的搜索结果. 图 4e,f分别表示地壳厚度H和波速比k随vPP的变化. 由图 4e,f可看出vPP的变化同样对H影响较大. 当vPP变化0.1 km/s时,H的最大偏离值约为1 km; 而当vPP变化较小时,其对k的影响不稳定,总体上k随vPP的增大有减小的趋势.
![]() 图 4 双层模型数值试验结果(a) 理论接收函数; (b)、 (c)和(d)分别表示vPP为预设值、 小于预设值0.3 km/s和大于预设值0.3 km/s时H-k方法的搜索结果.白色“+”为数据计算得到的结果, 黑色圆点表示预设模型; (e)和(f)分别表示数值模拟试验中地壳厚度H和波速比k随vPP的变化Figure 4. Numerical test for the two-layered model(a) Theoretical receiver functions; (b--d) H-k stacking results with default vPP, smaller vPP (0.3 km/s less than default vPP ) and larger vPP (0.3 km/s larger than default vPP), respectively. The white crosses represent the calculated values, black dots represent the default values, gray bars represent the stacking amplitude of receiver functions; (e) H versus vPP in numerical tests; (f) k versus vPP in numerical tests
图 4 双层模型数值试验结果(a) 理论接收函数; (b)、 (c)和(d)分别表示vPP为预设值、 小于预设值0.3 km/s和大于预设值0.3 km/s时H-k方法的搜索结果.白色“+”为数据计算得到的结果, 黑色圆点表示预设模型; (e)和(f)分别表示数值模拟试验中地壳厚度H和波速比k随vPP的变化Figure 4. Numerical test for the two-layered model(a) Theoretical receiver functions; (b--d) H-k stacking results with default vPP, smaller vPP (0.3 km/s less than default vPP ) and larger vPP (0.3 km/s larger than default vPP), respectively. The white crosses represent the calculated values, black dots represent the default values, gray bars represent the stacking amplitude of receiver functions; (e) H versus vPP in numerical tests; (f) k versus vPP in numerical tests第三组模型(模型3)为地壳中存在一低速梯度带,运用该模型计算得到的理论接收函数和H-k搜索结果分别如图 5a,b所示. 图 5c,d为改变vPP输入,运用接收函数H-k搜索得到的结果. 其中,图 5c为输入vPP值比预设vPP值小0.3 km/s时H-k的搜索结果,图 5d为输入vPP值比预设vPP值大0.3 km/s时H-k的搜索结果. 图 5e,f分别表示地壳厚度H和波速比k随vPP的变化. 由图 5e,f可看出vPP的变化同样对H影响较大. 当vPP变化0.1 km/s时,H的最大偏离值约为1 km; 而当vPP变化较小时,其对k的影响不稳定,总体上k随vPP的增大有减小的趋势.
![]() 图 5 存在一低速梯度带的双层模型数值试验结果(a) 理论接收函数; (b)、 (c)和(d)分别表示vPP为预设值、 小于预设值0.3 km/s和大于预设值0.3 km/s时 H-k方法的搜索结果. 白色“+”为数据计算得到的结果, 黑色圆点表示预设模型; (e)和(f)分别 表示数值模拟试验中地壳厚度H和波速比k随vPP的变化Figure 5. Numerical test for the two-layered model with a gradient structure(a) Theoretical receiver functions; (b--d) H-k stacking results with default vPP, smaller vPP (0.3 km/s less than default vPP ) and larger vPP (0.3 km/s larger than default vPP), respectively. The white crosses represent the calculated values, black dots represent the default values, gray bars represent the stacking amplitude of receiver functions; (e) H versus vPP in numerical tests; (f) k versus vPP in numerical tests
图 5 存在一低速梯度带的双层模型数值试验结果(a) 理论接收函数; (b)、 (c)和(d)分别表示vPP为预设值、 小于预设值0.3 km/s和大于预设值0.3 km/s时 H-k方法的搜索结果. 白色“+”为数据计算得到的结果, 黑色圆点表示预设模型; (e)和(f)分别 表示数值模拟试验中地壳厚度H和波速比k随vPP的变化Figure 5. Numerical test for the two-layered model with a gradient structure(a) Theoretical receiver functions; (b--d) H-k stacking results with default vPP, smaller vPP (0.3 km/s less than default vPP ) and larger vPP (0.3 km/s larger than default vPP), respectively. The white crosses represent the calculated values, black dots represent the default values, gray bars represent the stacking amplitude of receiver functions; (e) H versus vPP in numerical tests; (f) k versus vPP in numerical tests以上3组不同地壳模型的数值试验结果都与公式推导结果基本一致,即vPP的变化与H正相关,与k负相关.
3. 实际资料处理
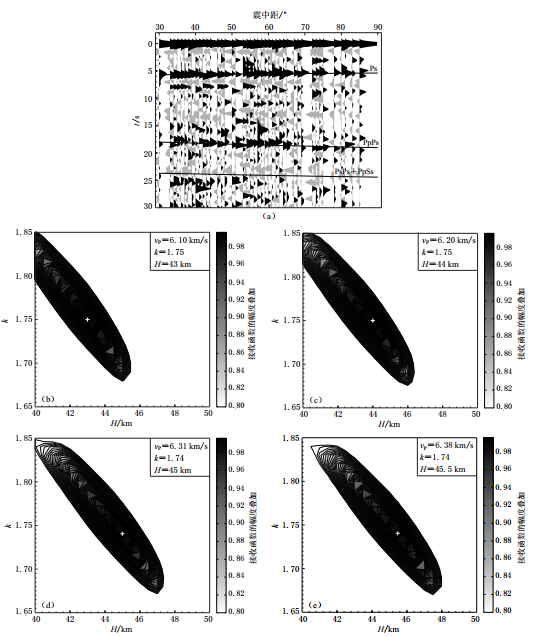
为进一步检验实际资料处理中vPP对H-k结果的影响,我们以位于甘肃省境内的天水台资料为例,选用了天水台2009—2010年震中距为30°—90°、 P波初动清晰、 信噪比较高的142条地震记录,利用0.1—5 Hz的巴特沃斯带通滤波器进行滤波. 采用时间域反褶积方法计算接收函数(Ligorría,Ammon,1999),计算中取高斯因子为2.5的滤波器. 根据以上资料计算的接收函数如图 6a所示.
![]() 图 6 不同vPP值对应的天水台实际资料处理结果(a) 天水台观测接收函数; (b), (c), (d)和(e)分别表示vPP为6.10, 6.20, 6.31, 6.38 km/s时H-k的搜索叠加结果Figure 6. Example of TSS station with different vPP(a) Observed receiver functions; (b) H-k stacking results with vPP=6.10 km/s; (c) H-k stacking results with vPP=6.20 km/s; (d) H-k stacking results with vPP=6.31 km/s; (e) H-k stacking results with vPP=6.38 km/s
图 6 不同vPP值对应的天水台实际资料处理结果(a) 天水台观测接收函数; (b), (c), (d)和(e)分别表示vPP为6.10, 6.20, 6.31, 6.38 km/s时H-k的搜索叠加结果Figure 6. Example of TSS station with different vPP(a) Observed receiver functions; (b) H-k stacking results with vPP=6.10 km/s; (c) H-k stacking results with vPP=6.20 km/s; (d) H-k stacking results with vPP=6.31 km/s; (e) H-k stacking results with vPP=6.38 km/s参考IASP91模型地壳平均速度值vPP=6.10 km/s,运用H-k方法搜索得到地壳厚度为43 km,波速比为1.75. 图 6b为根据该资料计算得到的H-k搜索结果.根据人工地震结果vPP=6.20 km/s(李清河,1991)、 面波频散曲线和接收函数联合(Shen et al,2011)确定的vPP=6.31 km/s以及区域地震波形反演结果vPP=6.38 km/s(李少华等,2012),得到了H和k分别为44 km、 45 km、 45.5 km和1.75、 1.74、 1.74(图 6c,d,e).结果列于表 1中.
表 1 天水台各模型的接收函数H-k方法搜索结果Table 1. H-k stacking results of TSS station for three different models
从表 1可看出,对于不同的P波速度,H-k方法的搜索结果有很大差别. 根据文中所选4种模型的vPP值可看出,当vPP偏离0.1 km/s时,H的最大偏离值为1 km,k的偏离值最大为0.1. vPP的变化与H正相关,与k负相关. 该结果与数值试验结果一致.
4. 讨论与结论
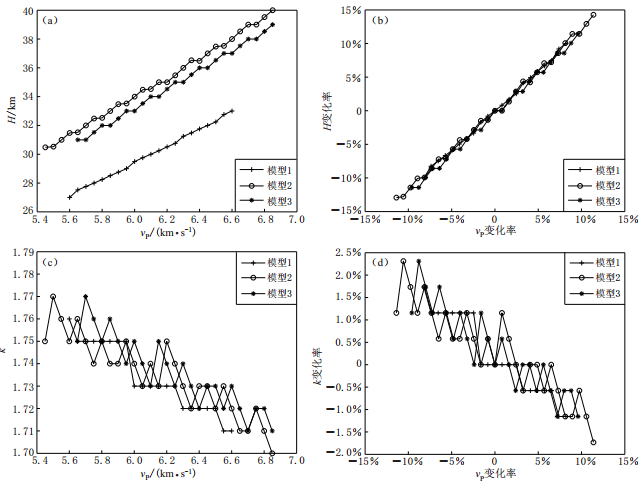
本文通过理论计算和数值试验,分析讨论了vPP对接收函数H-k搜索叠加结果的影响. 结果表明,P波速度的变化对接收函数H-k搜索结果中的地壳厚度H的影响比较大,而对波速比k的影响较小. 其中,vPP的变化与H正相关,与k负相关. 对比前两组数值试验可知,vPP对H的影响与地壳结构也有关. 对于本文的模型1,当vPP改变0.1 km/s时,H的最大偏离值约为0.5 km; 后两组地壳模型中,当vPP改变0.1 km/s,H的最大偏离值约为1 km. 3组模型中波速比k对vPP的变化均不敏感. 根据3组模型的对比可知(图 7),模型2和模型3中,vPP对H和k的影响变化趋势基本一致. 相对于模型1,模型2和模型3对于vPP的变化表现得更为敏感,即vPP对H的影响与地壳结构的复杂性也有关系,地壳结构越复杂,vPP的变化对H的影响越大. 特别是当vPP偏离超过5%时,所引起的地壳厚度H的变化会超过5 km,k的变化也可能超过0.01,会造成结果的不可靠,甚至错误.
![]() 图 7 3种模型中vPP及vPP变化率对H-k结果的影响(a) H与vPP关系; (b) H变化率与vPP变化率关系; (c) k值与vPP关系; (d) k变化率与vPP变化率关系Figure 7. The influence of vPP and variation rate of vPP on the H-k results for the three models(a) H versus vPP; (b) The variation rate of H versus the variation rate of vPP; (c) k versus vPP; (d) The variation rate of k versus the variation rate of vPP
图 7 3种模型中vPP及vPP变化率对H-k结果的影响(a) H与vPP关系; (b) H变化率与vPP变化率关系; (c) k值与vPP关系; (d) k变化率与vPP变化率关系Figure 7. The influence of vPP and variation rate of vPP on the H-k results for the three models(a) H versus vPP; (b) The variation rate of H versus the variation rate of vPP; (c) k versus vPP; (d) The variation rate of k versus the variation rate of vPP天水台实际资料处理结果也表明,对于不同的P波速度,H-k方法的搜索结果也有很大差别. 文中所选的4种不同方法所确定的vPP导致H与k最大的差别分别为2.5 km和0.1. 在研究区域或者局部速度结构时,这种差别已经不可忽视. 因此在运用H-k方法时,对vPP的选择要谨慎,尽量多地收集研究区已有的vPP结果,尽可能选取人工地震结果或利用面波频散结果进行约束,这样可以保证结果的合理性. 此外,接收函数H-k方法主要是运用多次波信息对H和k进行约束,对于多次波不清晰的资料,H-k方法有很大局限性.
-
![]()
图 1 单层模型中Ps, PpPs, PpSs+PsPs震相射线路径(左)及接收函数(右)示意图
Figure 1. Ray paths of Ps, PpPs and PpSs+PsPs (left panel) and synthetic receiver functions (right panel) for one-layer simple model
![]()
图 2 数值试验的理论地壳模型
(a) 单层模型; (b) 双层模型; (c) 含梯度带的双层模型
Figure 2. Three theoretical crustal models for numerical test
(a) One-layered model; (b) Two-layered model; (c) Two-layered model with a gradient structure
![]()
图 3 单层模型数值试验结果
(a) 理论接收函数; (b)、 (c)和(d)分别表示vPP为预设值、 小于预设值0.3 km/s和大于预设值0.3 km/s时H-k方法的搜索结果. 白色“+”为数据计算得到的结果, 黑色圆点表示预设模型; (e)和(f)分别表示数值模拟试验中地壳厚度H和波速比k随vPP的变化
Figure 3. Numerical test for the one-layer model
(a) Theoretical receiver functions; (b--d) H-k stacking results with default vPP, smaller vPP (0.3 km/s less than default vPP ) and larger vPP (0.3 km/s larger than default vPP), respectively. The white crosses represent the calculated values, black dots represent the default values, gray bars represent the stacking amplitude of receiver functions;(e) H versus vPP in numerical tests; (f) k versus vPP in numerical tests
![]()
图 4 双层模型数值试验结果
(a) 理论接收函数; (b)、 (c)和(d)分别表示vPP为预设值、 小于预设值0.3 km/s和大于预设值0.3 km/s时H-k方法的搜索结果.白色“+”为数据计算得到的结果, 黑色圆点表示预设模型; (e)和(f)分别表示数值模拟试验中地壳厚度H和波速比k随vPP的变化
Figure 4. Numerical test for the two-layered model
(a) Theoretical receiver functions; (b--d) H-k stacking results with default vPP, smaller vPP (0.3 km/s less than default vPP ) and larger vPP (0.3 km/s larger than default vPP), respectively. The white crosses represent the calculated values, black dots represent the default values, gray bars represent the stacking amplitude of receiver functions; (e) H versus vPP in numerical tests; (f) k versus vPP in numerical tests
![]()
图 5 存在一低速梯度带的双层模型数值试验结果
(a) 理论接收函数; (b)、 (c)和(d)分别表示vPP为预设值、 小于预设值0.3 km/s和大于预设值0.3 km/s时 H-k方法的搜索结果. 白色“+”为数据计算得到的结果, 黑色圆点表示预设模型; (e)和(f)分别 表示数值模拟试验中地壳厚度H和波速比k随vPP的变化
Figure 5. Numerical test for the two-layered model with a gradient structure
(a) Theoretical receiver functions; (b--d) H-k stacking results with default vPP, smaller vPP (0.3 km/s less than default vPP ) and larger vPP (0.3 km/s larger than default vPP), respectively. The white crosses represent the calculated values, black dots represent the default values, gray bars represent the stacking amplitude of receiver functions; (e) H versus vPP in numerical tests; (f) k versus vPP in numerical tests
![]()
图 6 不同vPP值对应的天水台实际资料处理结果
(a) 天水台观测接收函数; (b), (c), (d)和(e)分别表示vPP为6.10, 6.20, 6.31, 6.38 km/s时H-k的搜索叠加结果
Figure 6. Example of TSS station with different vPP
(a) Observed receiver functions; (b) H-k stacking results with vPP=6.10 km/s; (c) H-k stacking results with vPP=6.20 km/s; (d) H-k stacking results with vPP=6.31 km/s; (e) H-k stacking results with vPP=6.38 km/s
![]()
图 7 3种模型中vPP及vPP变化率对H-k结果的影响
(a) H与vPP关系; (b) H变化率与vPP变化率关系; (c) k值与vPP关系; (d) k变化率与vPP变化率关系
Figure 7. The influence of vPP and variation rate of vPP on the H-k results for the three models
(a) H versus vPP; (b) The variation rate of H versus the variation rate of vPP; (c) k versus vPP; (d) The variation rate of k versus the variation rate of vPP
表 1 天水台各模型的接收函数H-k方法搜索结果
Table 1 H-k stacking results of TSS station for three different models
 下载: 导出CSV
-
葛粲, 郑勇, 熊熊. 2011. 华北地区地壳厚度与泊松比研究[J]. 地球物理学报, 54(10): 2538-2548. Ge C, Zheng Y, Xiong X. 2011. Study of crustal thickness and Poisson ratio of the North China craton[J]. Chinese Journal of Geophysics, 54(10): 2538-2548 (in Chinese).
郭震, 唐有彩, 陈永顺, 宁杰远, 冯永革, 岳汉. 2012. 华北克拉通东部地壳和上地幔结构的接收函数研究[J]. 地球物理学报, 55(11): 3591-3600. Guo Z, Tang Y C, Chen Y S, Ning J Y, Feng Y G, Yue H. 2012. A study on crustal and upper mantle structures in east part of North China craton using receiver functions[J]. Chinese Journal of Geophysics, 55(11): 3591-3600 (in Chinese).
黄海波, 丘学林, 胥颐, 曾钢平. 2011. 利用远震接收函数方法研究南海西沙群岛下方地壳结构[J]. 地球物理学报, 54(11): 2788-2798. Huang H B, Qiu X L, Xu Y, Zeng G P. 2011. Crustal structure beneath the Xisha Islands of the South China Sea simulated by the teleseismic receiver function method[J]. Chinese Journal of Geophysics, 54(11): 2788-2798 (in Chinese).
李清河. 1991. 天水地区S波速度结构[J]. 西北地震学报, 13(增刊): 48-54. Li Q H. 1991. The velocity structure of S-waves in Tianshui area[J]. Northwestern Seismological Journal, 13(Suppl.): 48-54 (in Chinese).
李少华, 王彦宾, 梁子斌, 何少林, 曾文浩. 2012.甘肃东南部地壳速度结构的区域地震波形反演[J]. 地球物理学报, 55(4): 1186-1197. Li S H, Wang Y B, Liang Z B, He S L, Zeng W H. 2012. Crustal structure in southeastern Gansu from regional seismic waveform inversion[J]. Chinese Journal of Geophysics, 55(4): 1186-1197 (in Chinese).
李永华, 吴庆举, 安张辉, 田小波, 曾融生, 张瑞青, 李红光. 2006. 青藏高原东北缘地壳S波速度结构与泊松比及其意义[J]. 地球物理学报, 49(5): 1359-1368. Li Y H, Wu Q J, An Z H, Tian X B, Zeng R S, Zhang R Q, Li H G. 2006. The Poisson ratio and crustal structure across the NE Tibetan Plateau determined from receiver functions[J]. Chinese Journal of Geophysics, 49(5): 1359-1368 (in Chinese).
刘琼林, 王椿镛, 姚志祥, 常利军, 楼海. 2011. 华北克拉通中西部地区地壳厚度与波速比研究[J]. 地球物理学报, 54(9): 2213-2224. Liu Q L, Wang C Y, Yao Z X, Chang L J, Lou H. 2011. Study on crustal thickness and velocity ratio in mid-western North China craton[J]. Chinese Journal of Geophysics, 54(9): 2213-2224 (in Chinese).
刘文学, 刘贵忠, 周刚, 李欣, 张慧民, 徐恒垒. 2011. 新疆和周边地区地壳厚度和vP/vS比值变化的接收函数约束[J]. 地球物理学报, 54(8): 2034-2041. Liu W X, Liu G Z, Zhou G, Li X, Zhang H M, Xu H L. 2011. Crustal thickness and vP/vS ratio variations of Xinjing and surrounding regions constrained by receiver function stacking[J]. Chinese Journal of Geophysics, 54(8): 2034-2041 (in Chinese).
沈旭章, 梅秀萍, 杨辉. 2011. 汶川地震破裂带地壳速度结构研究[J]. 地球物理学进展, 26(2): 477-488. Shen X Z, Mei X P, Yang H. 2011. Study on the crustal structures beneath Wenchuan earthquake rupture zone[J]. Progress in Geophysics, 26(2): 477-488 (in Chinese).
王峻, 刘启元, 陈九辉, 李顺成, 郭飚, 李昱. 2009. 首都圈地区的地壳厚度及泊松比[J]. 地球物理学报, 52(1): 57-66. Wang J, Liu Q Y, Chen J H, Li S C, Guo B, Li Y. 2009. The crustal thickness and Poisson's ratio beneath the Capital Circle region[J]. Chinese Journal of Geophysics, 52(1): 57-66 (in Chinese).
查小惠, 孙长青, 李聪. 2013. 倾斜界面和各向异性地层对H-k搜索结果的影响[J]. 地球物理学进展, 28(1): 121-131. Zha X H, Sun C Q, Li C. 2013. The effects of dipping interface and anisotropic layer on the result of H-k method[J]. Progress in Geophysics, 28(1): 121-131 (in Chinese).
Aki K, Richards P G. 2002. Quantitative Seismology[M]. 2nd ed. Sausalito: University Science Books: 146-202.
Langston C A. 1979. Structure under Mount Rainier, Washington, inferred from teleseismic body waves[J]. J Geophys Res, 84(B9): 4749-4762.
Ligorría J P, Ammon C J. 1999. Iterative deconvolution and receiver-function estimation[J]. Bull Seismol Soc Am, 89(5): 1395-1400.
Lombardi D, Braunmiller J, Kissling E. 2007. Moho depth and Poisson's ratio in the Western-Central Alps from receiver functions[J]. Geophys J Int, 173(1): 249-264. doi:10.1111/j.1365-246X.2007.03706.x.
Ma Y L, Zhou H L. 2007. Crustal thicknesses and Poisson's ratios in China by joint analysis of teleseismic receiver functions and Rayleigh wave dispersion[J]. Geophys Res Lett, 34(12): L12304. doi:10.1029/2007GL029848.
Pan S Z, Niu F L. 2011. Large contrasts in crustal structure and composition between the Ordos Plateau and the NE Tibetan Plateau from receiver function analysis[J]. Earth Planet Sci Lett, 303(3/4): 291-298.
Ramesh D S, King R, Yuan X. 2002. Receiver function analysis of the North American crust and upper mantle[J]. Geophys J Int, 150(1): 91-108.
Ramesh D S, Kawakatsu H, Watada S, Yuan X. 2005. Receiver function images of the central Chugoku region in the Japanese islands using Hi-net data[J]. Earth Planets Space, 57(4): 271-280.
Shen X Z, Mei X P, Zhang Y S. 2011. The crustal and upper-mantle structures beneath the northeastern margin of Tibet[J]. Bull Seismol Soc Am, 101(6): 2782-2795. doi:10.1785/0120100112.
Tomlinson J P, Denton P, Maguire P K H, Booth D C. 2006. Analysis of the crustal velocity structure of the British Isles using teleseismic receiver functions[J]. Geophys J Int, 167(1): 223-237.
Wang P, Wang L S, Mi N, Liu J H, Li H, Yu D Y, Xu M J, Wang X C, Guo Z W. 2010. Crustal thickness and average vP/vS ratio variations in southwest Yunnan, China, from teleseismic receiver functions[J]. J Geophys Res, 115(B11): B11308. doi:10.1029/2009JB006651.
Yang H Y, Hu J F, Li G Q, Zhao H, Wen L M. 2011. Analysis of the crustal thickness and Poisson's ratio in eastern Tibet from teleseismic receiver functions[J]. Geophy J Int, 186(3): 1380-1386. doi:10.1111/j.1365-246X.2011.05118.
Zhu L P, Kanamori H. 2000. Moho depth variation in southern California from teleseismic receiver function[J]. J Geophs Res, 105(B2): 2969-2980.
-
期刊类型引用(7)
1. 黄俊杰,刘少林,杨顶辉,李孟洋,宋汉杰,汪文帅. 程函方程的接收函数走时反演方法研究青藏高原东南缘莫霍面深度. 地球物理学报. 2025(05): 1767-1781 .  百度学术
百度学术
2. 李姗姗,李晓东,张小飞,单晓琳,刘青山. 利用远震接收函数计算库尔勒地震台下方地壳厚度和泊松比. 地震地磁观测与研究. 2023(02): 27-34 . 百度学术
3. 李海艳,蔡辉腾,金星,姚华建,李培,徐嘉隽,林琛,任丛荣. 利用远震P波接收函数研究中国福建地区地壳厚度和泊松比. 地球物理学报. 2021(03): 805-822 . 百度学术
4. 查小惠,吕坚,鲍志诚,董非非,肖孟仁,江春亮. 接收函数H-k叠加方法研究综述. CT理论与应用研究. 2020(03): 369-379 . 百度学术
5. 李翠芹,郑建常,沈旭章,李媛,戴宗辉. 乳山震群震源区地壳速度结构初步研究. 地震工程学报. 2020(06): 1534-1539 . 百度学术
6. 钱辉,李海兵,刘栋梁,薛光琦,吴珍汉. 羌塘及南缘地区的地壳结构. 地质学报. 2016(08): 1715-1724 . 百度学术
7. Yutao Shi,Yuan Gao,Honglin Jing. Crustal thickness and v_P/v_S ratio in Shanxi Graben, China. Earthquake Science. 2014(06): 589-597 . 必应学术
其他类型引用(7)


计量
- 文章访问数: 689
- HTML全文浏览量: 291
- PDF下载量: 26
- 被引次数: 14
