

Azimuthal anisotropy of Rayleigh wave in Qinling and its adjacent areas
-
摘要: 除了使用前人提取的面波频散曲线外, 还从秦岭及周边地区布设的59个宽频流动地震台的数据和中国地震局及各省局台网的数据中筛选出的地震事件波形和台站间噪声互相关格林函数中提取瑞雷波群速度频散曲线. 利用二维面波层析成像反演获得了瑞雷波周期为10—50 s的各向同性群速度及方位各向异性分布. 结果显示: 周期为10 s的各向同性群速度和方位各向异性分布与各构造单元存在明显的对应关系; 周期为10—50 s的面波在四川盆地和鄂尔多斯盆地内的快波方向多为近NS向. 与前人研究结果不同的是, 本文得到的秦岭、 大巴山构造带周期为10—50 s的面波快波方向均与山脉走向近似平行, 且与SKS波分析得到的快波方向一致. 这表明秦岭和大巴山之下整个岩石圈的快波方向都与山脉走向平行, 预示着秦岭和大巴山整个地壳, 甚至岩石圈发生了类似的变形. 由于四川盆地和鄂尔多斯盆地面波快波方向与SKS波结果差别较大, 推测青藏高原隆升扩展对这两个盆地的地壳基本无影响, 但对其岩石圈上地幔却产生了重大影响.Abstract: We retrieved Rayleigh-wave group velocity dispersion from earthquake waveforms and inter-station Green’s functions cross-correlated from noises recorded by our 59 portable broadband seismic stations and hundreds of national and provincial stations of China Earthquake Administration in Qinling and its adjacent areas. Using the dispersion data and the previously published Rayleigh wave dispersions, we invert for isotropic group velocities and azimuthal anisotropies beneath Qinling and its adjacent areas for the periods of 10—50 s by 2-D surface wave tomography. The results show that the distribution of isotropic group velocities and the azimuthal anisotropies in the period of 10 s is obviously correlated with the crustal tectonics in the entire study region. The fast-propagation direction for the Rayleigh waves in the periods of 10—50 s beneath the Sichuan and Ordos basins are mostly near N-S. Unlike previous studies, the fast direction for all the periods from 10 s to 50 s beneath Qinling and Daba mountains and adjacent areas is near E-W which is nearly parallel to the strike of the regional tectonics. The fast-propagation direction from surface waves are consistent with that by previous SKS splitting analyses beneath the Qinling and Daba mountains, indicating that the deformation at the depths of the whole crust beneath the Qinling and Daba mountains are similar, even down to the lithospheric base. However, the Rayleigh wave fast-propagation directions beneath Sichuan and Ordos basins are different from fast-wave directions inferred from previous SKS analyses, indicating that the uplifting and extending of Tibetan Plateau did not reform the crust but the lithospheric upper mantle beneath the two basins.
-
Keywords:
- Rayleigh waves /
- group velocity /
- azimuthal anisotropy /
- crust /
- Qinling
-
引言
对地震波速各向异性的分析是了解地壳与上地幔运动和变形的有效方法之一(Backus, 1965,1970; Christensen,Salisbury,1979; Royden et al,1997; Griot et al,1998; Sharma,2002; Crampin,Chastin,2003; Marone,Romanowicz,2007; Zhao,Xue,2010). 地壳结构(如矿物排列)或构造的定向一般被认为是导致地壳波速各向异性的主要原因,故地壳快波方向通常与构造的走向平行(Okaya et al,1995; 张国苓等,2010; Polat et al,2012). 而在地幔中,橄榄岩晶格优势取向往往被认为是导致波速各向异性的主要原因(Mackenzie,1972; Leven et al,1981; Silver,Chan,1991; Vinnik et al,1992).
地震波速各向异性通常分为由横波分裂确定的剪切波各向异性和由面波速度确定的面波各向异性. 由于某周期的面波速度反映的是某深度以上结构的平均信息,故面波各向异性研究可以给出各向异性所在的深度范围. 面波各向异性又可以分为面波偏振各向异性和面波方位各向异性. 面波偏振各向异性是通过对比由瑞雷波和勒夫波反演确定的S波垂直分量与水平分量之间的差异而获得的. 对于同一区域,勒夫波的观测数据数量和质量往往都低于瑞雷波,且两种面波对S波的敏感度也不同,从而使面波偏振各向异性结果的可靠性一般较差,故这种分析应用相对较少. 面波方位各向异性反映的是面波群速度或相速度在各向异性介质中对传播方向的依赖性. 基阶面波方位各向异性被发现(McEvilly,1964)后,确认了瑞雷波快波方向与现今板块构造和板块运动的相关性(Tanimoto,Anderson, 1984,1985; Montagner,Nataf,1986; 张中杰,2002; Trampert,Woodhouse,2003). 由于勒夫波对方位的依赖性比瑞雷波要小(Smith,Dahlen,1973; 刘希强等,1998; Silveira,Stutzmann,2002),本文将对瑞雷波的方位各向异性进行研究.
秦岭位于长期稳定的鄂尔多斯盆地与四川盆地之间,西邻青藏高原(图 1). 鄂尔多斯盆地与四川盆地分属华北和华南两个不同的块体. 秦岭造山带是从晚古生代晚期开始,并在中新生代强烈的陆内造山作用下形成的(张国伟等,2001). 鉴于面波方位各向异性与地壳构造和板块构造间存在明显的关系,因此对秦岭地区开展面波方位各向异性研究不但有助于深入了解秦岭造山带的形成机制,也有益于进一步了解青藏高原隆升扩展对该区域的影响机制.
![]() 图 1 秦岭及周边地区地貌和构造简图图中黑线表示构造线(引自任纪舜, 2003), 灰线表示河流Figure 1. Topography and simplified tectonic map of Qinling and its adjacent areasBlack lines represent delineation of blocks (after Ren, 2003), and gray lines represent rivers
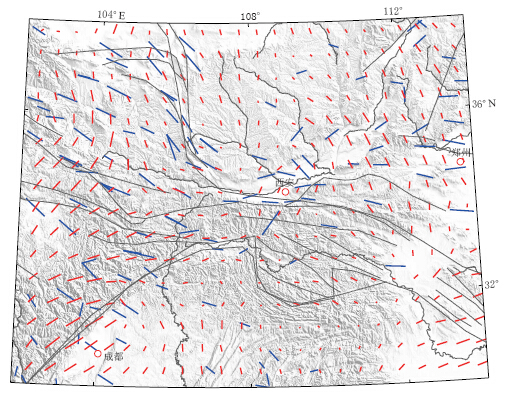
图 1 秦岭及周边地区地貌和构造简图图中黑线表示构造线(引自任纪舜, 2003), 灰线表示河流Figure 1. Topography and simplified tectonic map of Qinling and its adjacent areasBlack lines represent delineation of blocks (after Ren, 2003), and gray lines represent rivers前人对秦岭及其周边地区的各向异性进行了研究,但得到的各种结果差别明显. SKS波分裂结果(王椿镛等,2007; 常利军等, 2008a,b,2009,2011; 胡亚轩等,2011; 王琼等,2013)表明,秦岭造山带及其周边地区快波方向基本为近EW向,而四川盆地西缘S波分裂快波方向以NE向为主(石玉涛等,2013)(图 2). 部分远震瑞雷波研究(Su et al,2008; 易桂喜等,2010)显示,周期为20—120 s的面波快波在秦岭及周边地区都为近NS向(图 2),该快波方向与SKS分裂各向异性结果明显不同,且与近EW走向的秦岭山脉走向近似垂直. 黄忠贤(2011)的结果(图 2)则显示,瑞雷波快波方向在秦岭及附近存在明显的侧向变化. 例如,以大约109°E为界,周期为14.6—31.6 s的面波快波方向在东部为近NS向,而西部为近EW向; 但周期为63.0—79.4 s的面波快波方向却与此正好相反. 综上所述,前人在秦岭及周边地区的各向异性研究表明,面波方位各向异性与体波方位各向异性结果不同,且不同面波间也存在一定差别.
![]() 图 2 前人获得的秦岭及周边地区各向异性快波方向分布图中蓝色和红色的细线段分别表示SKS波(王椿镛等, 2007; 常利军等, 2008a, b, 2009, 2011; 胡亚轩等, 2011; 王琼等, 2013)和S波(石玉涛等, 2013)分裂快波方向; 紫粗线段表示黄忠贤(2011), 其中紫色线段1, 2和3分别表示周期为11.6 s、 14.6—31.6 s和63.0—79.4 s的快波方向, 紫色线段4表示所示区域所有周期快波方向. 绿色粗线表示Su等(2008)和易桂喜等(2010)的瑞雷波快波方向研究结果. 图中表示快波方向线段的长度不代表各向异性的强弱Figure 2. Published anisotropy results in Qinling and its adjacent areasBlue and red thin lines represent fast-propagation directions respectively from SKS (Wang et al, 2007; Chang et al, 2008a, b, 2009, 2011; Hu et al, 2011; Wang et al, 2013) and S (Shi et al, 2013) splitting; thick lines are from Rayleigh-wave azimuth anisotropy studies, such as purple thick lines from Huang (2011), green thick lines from Su et al (2008)和Yi et al (2010). Purple lines with labels of “1” to “3” represents fast directions respectively for periods of 11.6 s, 14.6—31.6 s, 63.0—79.4 s and purple line 4 represents fast directions for all periods of the region. The length of the above lines do not represent anisotropy strength
图 2 前人获得的秦岭及周边地区各向异性快波方向分布图中蓝色和红色的细线段分别表示SKS波(王椿镛等, 2007; 常利军等, 2008a, b, 2009, 2011; 胡亚轩等, 2011; 王琼等, 2013)和S波(石玉涛等, 2013)分裂快波方向; 紫粗线段表示黄忠贤(2011), 其中紫色线段1, 2和3分别表示周期为11.6 s、 14.6—31.6 s和63.0—79.4 s的快波方向, 紫色线段4表示所示区域所有周期快波方向. 绿色粗线表示Su等(2008)和易桂喜等(2010)的瑞雷波快波方向研究结果. 图中表示快波方向线段的长度不代表各向异性的强弱Figure 2. Published anisotropy results in Qinling and its adjacent areasBlue and red thin lines represent fast-propagation directions respectively from SKS (Wang et al, 2007; Chang et al, 2008a, b, 2009, 2011; Hu et al, 2011; Wang et al, 2013) and S (Shi et al, 2013) splitting; thick lines are from Rayleigh-wave azimuth anisotropy studies, such as purple thick lines from Huang (2011), green thick lines from Su et al (2008)和Yi et al (2010). Purple lines with labels of “1” to “3” represents fast directions respectively for periods of 11.6 s, 14.6—31.6 s, 63.0—79.4 s and purple line 4 represents fast directions for all periods of the region. The length of the above lines do not represent anisotropy strength为深入分析该地区各向异性分布,中国地质科学院和中国地质科学院地质力学研究所于2011年在三维地质填图试点工作中启动了对秦岭及周边地区进行流动宽频地震观测研究. 本文利用三维地质填图试点于2011年起获得的数据以及中国地震局及相关省局固定台观测的秦岭及周边地区地震事件波形数据和台站噪声互相关格林函数,以期对秦岭及周边地区瑞雷波方位各向异性进行深入研究.
1. 数据及其分析方法
1.1 观测数据
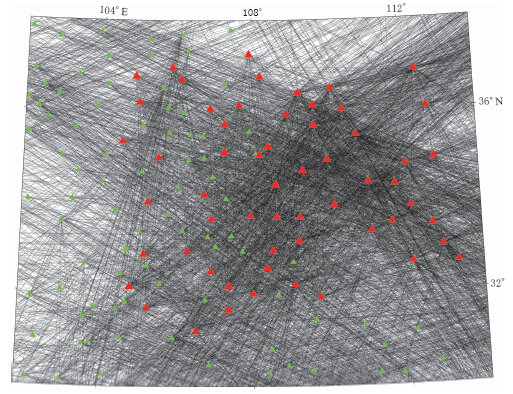
本文使用了2011年11月—2012年12月中国地质科学院和中国地质科学院地质力学研究所三维地质填图试点工作在秦岭及其周边地区布设的59个流动宽频地震台(图 3)数据,并搜集了分别由中国地震台网中心和中国地震台网备份中心提供的中国地震局及各省局在该区及周边地区的581个固定地震台记录的地震事件数据和降采样率连续数据(郑秀芬等,2009; Zheng et al,2010). 由于垂直分量上的瑞雷波不受探头NS方向误差和勒夫波的影响,故这里只使用垂直分量的地震数据. 我们不仅使用USGS或中国地震台网中心发布的地震事件目录截取的地震事件波形,还利用噪声互相关技术(Shapiro,Campillo,2004; Bensen et al,2007; 赵琳等,2011)从连续数据中提取台站间格林函数.
![]() 图 3 研究区的台站分布和射线覆盖(T=20 s)红色三角形为流动地震台, 绿色三角形为中国地震局及其各省局固定地震台Figure 3. Stations and path coverage in the study region for a period of 20 sRed triangles represent portable seismic stations, green triangles represent permanent seismic stations of national and provincial stations of China Earthquake Administration
图 3 研究区的台站分布和射线覆盖(T=20 s)红色三角形为流动地震台, 绿色三角形为中国地震局及其各省局固定地震台Figure 3. Stations and path coverage in the study region for a period of 20 sRed triangles represent portable seismic stations, green triangles represent permanent seismic stations of national and provincial stations of China Earthquake Administration参照Feng等(2004,2011)介绍的面波频散分析步骤,利用多重滤波技术(multiple filtering technique,简写为MFT)(Dziewonski et al,1969)对所有事件波形和互相关格林函数进行了分析. 在该过程中,首先用相匹配滤波方法(Herrin,Goforth,1977)从波形中去除体波、 高阶面波和噪声; 然后在多重滤波时频分析过程中,实现高斯滤波器的宽度参数随频率和震中距的变化而变化,以此保证群速度频散曲线在频率域和时间域具有相似的精度. 在读取面波频散数据过程中没有使用通常所用的滤波周期,而是使用了瞬时周期,这样可以使所得到的频散曲线更为准确合理(Nyman,Landisman, 1977). 数据分析中使用的是参照上述步骤对Herrmann和Ammon(2002)时频分析软件修改后的软件(Feng et al,2004).
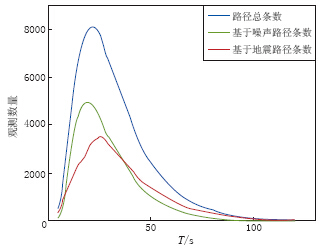
除了使用本文分析的频散曲线外,这里还使用了Feng和An(2010)以及Feng等(2011)的面波频散曲线,总计使用了9891条瑞雷波群速度频散曲线. 各周期面波数量如图 4所示,其中周期为20 s群速度值主要来自于台站间噪声互相关格林函数; 而周期为40—50 s群速度值主要来自于地震事件波形数据. 在所有周期中,周期为22 s的群速度值最多,总计8098个. 周期为20 s面波路径分布见图 3. 从图 3可以看出,其射线对整个研究区形成了比较稠密且交叉良好的覆盖.
1.2 面波方位各向异性
对于地震射线上任意一点i,任意周期T的面波传播速度U可以表示为该点传播方位角φ的函数(Thurston,1964),即

式中,Ui0表示各向同性波速,Ai1和Bi1表示方位角为2φ的各向异性系数,Ai2和Bi2表示方位角为4φ的各向异性系数. 由于面波存在频散特性(即面波的波速随频率或周期的变化而变化),故系数Ui0,Ai1,Bi1,Ai2和Bi2都是周期的函数. 瑞雷波速度各向异性对2φ方位角比较敏感,而勒夫波速度各向异性对4φ方位角比较敏感(Montagner,Jobert,1988). 若只考虑瑞雷波,那么面波速度公式中的4φ项则可以忽略(Montagner,Tanimoto,1991).
对于一条面波传播路径来说,某周期面波观测速度Uobs可以表示为沿射线路径的积分:

式中,Ul为路径上某点l的速度,L为射线的总长度. 为计算方便,通常把研究区离散化为单元网格,那么式(2)中的积分可表示为每个单元中速度与该单元中射线长度的叠加:

式中,n表示总单元数,i为单元序号,li表示第i个单元内射线路径的长度. 将式(1)略去4φ项后代入到式(3)中,可得

式中: Uobs,li,L,φ均为已知量; Ui0,Ai1和Bi1为第i个网格中的3个未知量. 也就是说,任意一条射线的观测速度均可以表示为研究区所有网格各向同性速度Ui0和各向异性系数Ai1和Bi1的线性函数.
对于每个群速度观测均可以建立如式(4)所示的线性方程,把一个周期所有方程合起来可以形成如下方程组:

式中,d是包含观测速度值的向量,G是包含射线在各网格中的长度和传播方位等信息的矩阵,m是包含各网格各项同性速度和各项异性系数的向量(是待求量). 利用公式求解m是一个线性反演问题,但是由于矩阵G通常是一个大型稀疏病态矩阵,因此需要在线性反演中引入先验约束条件. 我们在反演中加入了平滑约束条件F,使得相邻网格的模型参数趋于一致. 为此,公式中的线性方程组变为

其中,F是平滑矩阵,λ是平衡观测数据拟合与模型平滑之间的权重. λ越大,模型越平滑,但观测数据拟合误差越大; λ越小,模型越不平滑,但观测数据拟合误差越小. 基于既保证观测数据拟合误差不能太大,又要保证反演模型较为合理的原则,本文通过试错法确定了λ值.
将研究区划分为0.5°×0.5°的网格单元. 利用最小二乘QR分解(LSQR)共轭梯度方法(Paige,Saunders, 1982a,b)反演获得了10—50 s范围内16个周期瑞雷波群速度各向同性速度Ui0和方位各向异性Ai1,Bi1. 然后,根据下式(Smith,Dahlen,1973)获得各向异性的快波方向Θ和强度Λ:

1.3 模型分辨率
This page contains the following errors:
error on line 1 at column 1: Start tag expected, '<' not foundBelow is a rendering of the page up to the first error.
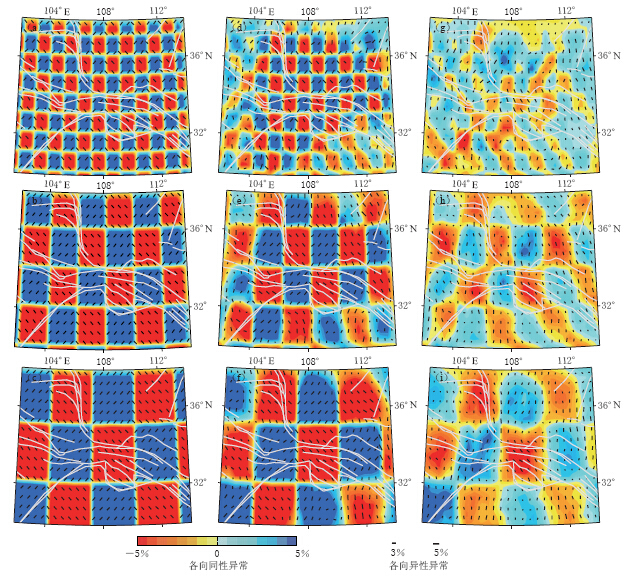
![]() 图 5 检测板测试结果(a)-(c)为理论输入模型; (d)-(f)为利用周期10 s观测的输出模型; (g)-(i)为利用周期50 s观测的输出模型. 从顶部至底部3排子图分别表示对于异常大小1°, 2°和3°的测试. 彩色阴影为各向同性群速度异常, 黑色短线表示各向异性的强度与快波方向. 所有异常均相对于区域平均群速度值Figure 5. Checkerboard tests(a)-(c) are input models; (d)-(f) are output models in a period of 10 s using observation paths; (g)-(i) are output models in a period of 50 s using observation paths. The three rows of subfigures from top to bottom are the tests respectively with anomaly sizes of 1°, 2° and 3°. Color shades represent isotropic group velocity anomalies, black bars represent anisotropy strength and fast wave directions. All relative anomalies are relative to regional average group velocity
图 5 检测板测试结果(a)-(c)为理论输入模型; (d)-(f)为利用周期10 s观测的输出模型; (g)-(i)为利用周期50 s观测的输出模型. 从顶部至底部3排子图分别表示对于异常大小1°, 2°和3°的测试. 彩色阴影为各向同性群速度异常, 黑色短线表示各向异性的强度与快波方向. 所有异常均相对于区域平均群速度值Figure 5. Checkerboard tests(a)-(c) are input models; (d)-(f) are output models in a period of 10 s using observation paths; (g)-(i) are output models in a period of 50 s using observation paths. The three rows of subfigures from top to bottom are the tests respectively with anomaly sizes of 1°, 2° and 3°. Color shades represent isotropic group velocity anomalies, black bars represent anisotropy strength and fast wave directions. All relative anomalies are relative to regional average group velocityThis page contains the following errors:
error on line 1 at column 1: Start tag expected, '<' not foundBelow is a rendering of the page up to the first error.
图 5显示了利用周期为10 s和50 s分别对3组不同尺寸棋盘格模型的检测板测试结果. 测试结果表明,反演输出模型的横向分辨率与周期密切相关. 周期为10 s时,反演模型可以恢复整个研究区2°(图 5e)和3°(图 5f)棋盘格各向同性和各向异性的异常; 在研究区中心的秦岭及周边可以恢复1°(图 5d)的棋盘格异常. 即对于10 s周期数据,除了研究区中心的分辨率可达0.5°(棋盘格尺寸的1/2)以外,其余地区的分辨率为1°. 周期为50 s时,尺寸为1°的棋盘格(图 5g)除了研究区中心的各向同性异常以外,其它地区无论是各向同性异常幅值还是各向异性的快波方向都难以很好地恢复; 而尺寸为2°(图 5h)的棋盘格异常虽然各向同性波速异常在整个研究区都被较好地恢复,但各向异性快波方向和幅值都只在研究区中心被较好地恢复; 尺寸为3°(图 5i)的棋盘格异常除了在研究区边缘以外都能被很好地恢复. 因此对于50 s周期,各向同性分辨率在研究区中心可达0.5°,在整个研究区可达1°; 各向异性分辨率在研究区中心可达1°,在研究区周边可达1.5°.
总体而言,在秦岭及周边地区,周期为10—50 s的面波各向同性异常水平尺度大于等于50 km都是可靠的; 对于各向异性异常,周期为10 s的水平尺度大于等于50 km的异常是可靠的,周期为50 s的水平尺度大于等于100 km的异常是可靠的.
2. 结果
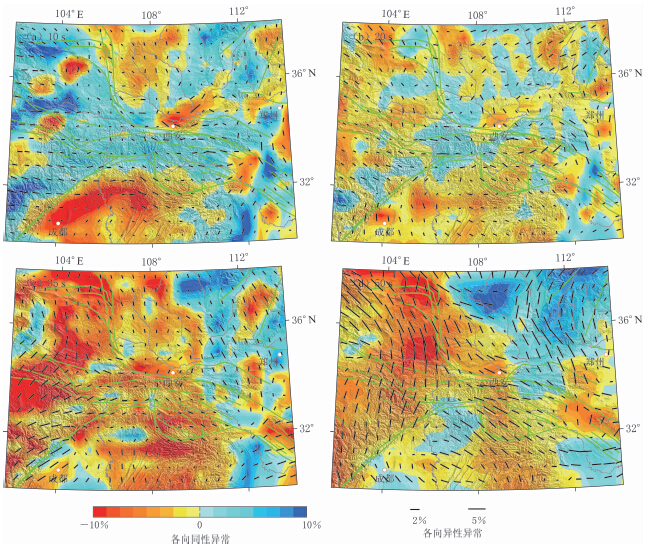
图 6给出了各周期的面波波速和各向异性分布. 周期为10 s的瑞雷波主要反映数千米深度内地壳浅层的速度结构特征. 图 6a显示了10 s面波群速度异常和各向异性分布. 结果表示,各向同性群速度异常分布与盆山地貌单元具有明显的对应关系. 其中秦岭造山带及青藏高原东缘山区表现为高速异常,而在四川盆地和鄂尔多斯盆地多数区域则表现为低速异常,其中渭河(地堑)盆地速度值最低. 通过山区与盆地异常对比可以看出,盆地的低速异常与盆地沉积层较厚有关,而山区的高速异常则与沉积层较薄、 基底较浅有关.
![]() 图 6 研究区周期为10, 20, 35和50 s各向同性速度和各向异性分布绿色线段表示研究区主要断层构造线, 彩色阴影表示各向同性群速度异常, 黑色线段表示 各向异性的强度与快波方向, 灰线表示河流. 所有异常均相对于区域平均群速度值Figure 6. Distribution of velocity and anisotropy of Rayleigh-wave at the periods of 10 s, 20 s, 35 s and 50 sGreen lines represent main fault structure lines, color shades represent isotropic group velocity anomalies, black bars represent anisotropy strength and fast wave directions, and gray line represents rivers. All relative anomalies are relative to regional average group velocity
图 6 研究区周期为10, 20, 35和50 s各向同性速度和各向异性分布绿色线段表示研究区主要断层构造线, 彩色阴影表示各向同性群速度异常, 黑色线段表示 各向异性的强度与快波方向, 灰线表示河流. 所有异常均相对于区域平均群速度值Figure 6. Distribution of velocity and anisotropy of Rayleigh-wave at the periods of 10 s, 20 s, 35 s and 50 sGreen lines represent main fault structure lines, color shades represent isotropic group velocity anomalies, black bars represent anisotropy strength and fast wave directions, and gray line represents rivers. All relative anomalies are relative to regional average group velocity整个研究区内包括多个独立的构造单元,相互作用复杂,各向异性强度和快波方向横向变化较大. 秦岭造山带、 四川盆地西北部以及鄂尔多斯盆地东南的渭河地堑的各向异性较强; 四川盆地内部和鄂尔多斯盆地内部各向异性较弱,但鄂尔多斯盆地的各向异性比四川盆地稍强. 秦岭造山带及其邻近的多数区域(如鄂尔多斯南缘、 四川盆地西侧和北缘及大巴山地区)的快波方向为EW向或近EW向,这与秦岭造山带的走向近似平行. 位于鄂尔多斯盆地东南的渭河地堑,快波方向与地堑的NE走向一致; 研究区东部快波方向表现为近NS向. 由上可见,研究区内周期为10 s面波各向异性强度和快波方向的变化与大地构造单元间也存在明显关系.
周期为20 s的群速度主要反映中、 上地壳(以上地壳为主)的平均速度结构. 由于不同周期群速度分布反映了不同深度范围内的平均速度特征,因此如果短周期的速度异常形态与长周期相似,则说明在该周期内所反映的穿透深度范围内的速度异常具有一致性; 如果短周期速度异常形态与长周期速度异常形态相差较大,则说明该周期新增加的穿透深度范围内速度结构发生了明显变化. 图 6b显示了周期为20 s的面波群速度异常和各向异性分布. 周期为20 s与10 s的各向同性速度异常及异常分布样式差别明显. 这些差别反映了10 km左右(约上地壳)的结构信息. 周期为20 s的各向同性速度在多数区域内表现为负异常,且与大地构造的关系不明显. 这说明了山区和盆地在沉积层以下的岩性和结构没有随大地构造的不同而出现明显的横向变化.
快波方向在秦岭和大巴山地区仍表现为近EW向. 四川盆地东部地区为近EW向,而西部地区却变为近NS向,但与之相邻的巴颜喀拉地块却仍以近EW向为主. 阿拉善地区和研究区东部的华北平原的快波方向以NS向居多,但两者之间的鄂尔多斯盆地内部快波方向规律性不强,或者说各向异性弱.
周期为35 s的群速度主要反映中、 上地壳的平均速度结构,也包括一定的下地壳信息. 图 6c显示了研究区周期为35 s的面波群速度异常和各向异性分布. 该周期的各向同性速度在研究区绝大多数地区内表现为低速异常,而东部地区多表现为高速异常. 这种异常分布可能是由于东部地区比西部地区的地壳薄有关. 例如处于东部边缘的华北平原地壳厚度不足30 km(嘉世旭,张先康,2005),该区周期为35 s面波波速包括了部分上地幔的信息. 四川盆地和鄂尔多斯盆地地壳深度介于青藏高原厚地壳与东部平原薄地壳之间,其各向同性速度也介于二者之间. 这种各向同性速度分布与郑现等(2012)得到的总体分布基本一致.
四川盆地和鄂尔多斯盆地内部各向异性弱于其边缘,这反映了两个盆地内部在历史上经受的构造作用比周围地区较弱. 快波方向在四川盆地、 鄂尔多斯盆地、 阿拉善地块及研究区东部(如华北平原)的快波方向以近NS向为主; 而在秦岭和大巴山地区中、 东部表现为EW方向,大巴山地区西部及四川盆地以西的巴颜喀拉地块表现为NE向.
周期为50 s的群速度反映上地幔顶部及以上的平均速度结构. 图 6d显示了50 s面波群速度异常和各向异性分布. 该周期的各向同性在青藏高原的巴颜喀拉地块、 阿拉善地块和秦岭造山带及其附近地区表现出的低速异常与该区域地壳较厚有关. 秦岭和大巴山中东部的快波方向仍为近EW向,这与鄂尔多斯盆地、 四川盆地及其以西地区的快波方向(近NS向)不一致说明秦岭造山带在上地幔顶部仍存在EW向的各向异性.
综合以上结果可以看出,本文得到的位于秦岭周边的四川盆地和鄂尔多斯盆地的快波方向与前人研究结果(苏伟等,2008; 易桂喜等,2010; 黄忠贤,2011)基本近似,但在秦岭和大巴山地区,本文得到的结果与前人研究结果具有明显差别. 本文得到的周期为10 s的快波方向为近EW向,与苏伟等(2008)和黄忠贤(2011)获得的该周期瑞雷波快波方向结果不一致; 我们所得到的周期为20 s和35 s结果与苏伟等(2008)和易桂喜等(2010)利用瑞雷波频散得到的相应周期的结果不一致,而与黄忠贤(2011)利用瑞雷波面波频散得到的相应周期的部分区域的部分结果一致.
本文结果显示秦岭和大巴山地区整个地壳的快波方向基本与其山脉走向平行,该方向与前人利用SKS所得到的快波方向一致(图 7). 具体地讲,本文利用面波得到的地壳和上地幔顶部的快波方向与前人利用SKS得到的代表整个岩石圈平均各向异性的快波方向一致,因此可以认为,秦岭和大巴山地区整个地壳和岩石圈及其内部各层的快波方向均与山脉走向一致. 由于波速各向异性可能与深部结构或构造定向有关,因此该各向异性特征说明了秦岭和大巴山地区在形成过程中,其变形不单纯局限在地壳,而是整个岩石圈.
![]() 图 7 SKS波与周期为35 s的瑞雷波快波方向对比图图中红色短线表示瑞雷波快波方向,蓝色短线表示前人利用SKS波得到的快波方向 (王椿镛等,2007; Su et al,2008; 常利军等, 2008a,b,2009,2011; 易桂喜等, 2010; 胡亚轩等,2011; 黄忠贤,2011; 石玉涛等,2013; 王琼等,2013)Figure 7. Comparison of Rayleigh fast direction in the period of 35 s with SKS fast directionRed bars represent fast directions of Rayleigh wave; blue bars represent fast directions of SKS (after Wang et al,2007; Su et al,2008; Chang et al, 2008a,b,2009,2011; Yi et al,2010; Hu et al, 2011; Huang,2011; Shi et al, 2013; Wang et al, 2013)
图 7 SKS波与周期为35 s的瑞雷波快波方向对比图图中红色短线表示瑞雷波快波方向,蓝色短线表示前人利用SKS波得到的快波方向 (王椿镛等,2007; Su et al,2008; 常利军等, 2008a,b,2009,2011; 易桂喜等, 2010; 胡亚轩等,2011; 黄忠贤,2011; 石玉涛等,2013; 王琼等,2013)Figure 7. Comparison of Rayleigh fast direction in the period of 35 s with SKS fast directionRed bars represent fast directions of Rayleigh wave; blue bars represent fast directions of SKS (after Wang et al,2007; Su et al,2008; Chang et al, 2008a,b,2009,2011; Yi et al,2010; Hu et al, 2011; Huang,2011; Shi et al, 2013; Wang et al, 2013)鄂尔多斯盆地和四川盆地是中国大陆为数不多的保持长期稳定的克拉通地貌,并拥有稳定和相对较厚的岩石圈(An,Shi,2006). 该地区的面波方位各向异性结果显示两个盆地内部的各向异性明显弱于其周边区域,这说明在很长时间内块体间的相互作用对这两个盆地内部的影响较小,这与两个盆地在较长时间稳定是一致的. 两个盆地下面快波方向多为近NS向,这与利用SKS波获得的岩石圈快波方向近EW向差别较大(图 7),因此可以认为四川盆地与鄂尔多斯盆地的地壳和岩石圈上地幔各向异性性质不同.
地壳与上地幔各向异性的不同说明该区域曾经历了不同的地球动力学环境. 由于SKS波得到的体波各向异性方向与整个研究区现今板块运动方向近似,据此推测两个盆地上地幔的各向异性与现今动力学环境有关,那么即可推测两个盆地地壳的各向异性应该与地壳形成时的动力学环境有关. 鉴于两个盆地地壳各向异性与现今地球动力学环境没有明显关系,那么我们可以认为新生代发生的青藏高原隆升扩展对这两个盆地的地壳基本没有什么影响,却对两个盆地的岩石圈上地幔产生了重大影响,并决定了其各向异性分布.
3. 结论
本文利用瑞雷波频散曲线反演得到了秦岭及其周边地区周期为10—50 s各向同性群速度和快波方向分布. 结果显示: 四川盆地和鄂尔多斯盆地的快波方向多为近NS向,该结果与前人面波研究结果基本吻合; 但秦岭和大巴山地区的快波方向与前人结果有一定差别. 秦岭及其周边周期为10—50 s的面波快波方向基本为近EW向,该方向与秦岭山脉的走向基本平行,与地壳构造走向平行. 该面波快波方向在秦岭及其附近地区与SKS波结果一致,但在四川盆地和鄂尔多斯盆地则明显不同.
考虑到利用面波得到的地壳和上地幔顶部的快波方向与利用SKS波得到的代表整个岩石圈平均各向异性的快波方向一致,因此可以认为,秦岭和大巴山地区整个地壳和岩石圈及其内部各层的快波方向均与山脉走向一致. 这可能说明了秦岭和大巴山地区在形成过程中,其变形不单纯局限在地壳,而是整个岩石圈. 前人SKS波分析得到的鄂尔多斯盆地和四川盆地地区岩石圈快波方向为近EW向,但本文瑞雷波快波方向在该区为近NS向,两者差别较大. 由于SKS波得到的快波方向与研究区现今板块运动方向近似,据此推测两个盆地上地幔的各向异性与现今动力学环境有关,因而这两个盆地地壳的各向异性就应该与地壳形成时的动力学环境有关. 具体说来,新生代发生的青藏高原隆升扩展对这两个盆地的地壳基本无影响,却对两个盆地的岩石圈上地幔产生了重大影响.
中国地质科学院地质力学研究所、 北京大学地空学院陈永顺研究组和甘肃省地震局沈旭章研究组参加野外流动地震台阵布设和数据采集,中国地震局台网中心和数据备份中心为本文提供了数据,审稿专家对本文提出了宝贵的意见,在此一并表示感谢.
-
![]()
图 1 秦岭及周边地区地貌和构造简图
图中黑线表示构造线(引自任纪舜, 2003), 灰线表示河流
Figure 1. Topography and simplified tectonic map of Qinling and its adjacent areas
Black lines represent delineation of blocks (after Ren, 2003), and gray lines represent rivers
![]()
图 2 前人获得的秦岭及周边地区各向异性快波方向分布
图中蓝色和红色的细线段分别表示SKS波(王椿镛等, 2007; 常利军等, 2008a, b, 2009, 2011; 胡亚轩等, 2011; 王琼等, 2013)和S波(石玉涛等, 2013)分裂快波方向; 紫粗线段表示黄忠贤(2011), 其中紫色线段1, 2和3分别表示周期为11.6 s、 14.6—31.6 s和63.0—79.4 s的快波方向, 紫色线段4表示所示区域所有周期快波方向. 绿色粗线表示Su等(2008)和易桂喜等(2010)的瑞雷波快波方向研究结果. 图中表示快波方向线段的长度不代表各向异性的强弱
Figure 2. Published anisotropy results in Qinling and its adjacent areas
Blue and red thin lines represent fast-propagation directions respectively from SKS (Wang et al, 2007; Chang et al, 2008a, b, 2009, 2011; Hu et al, 2011; Wang et al, 2013) and S (Shi et al, 2013) splitting; thick lines are from Rayleigh-wave azimuth anisotropy studies, such as purple thick lines from Huang (2011), green thick lines from Su et al (2008)和Yi et al (2010). Purple lines with labels of “1” to “3” represents fast directions respectively for periods of 11.6 s, 14.6—31.6 s, 63.0—79.4 s and purple line 4 represents fast directions for all periods of the region. The length of the above lines do not represent anisotropy strength
![]()
图 3 研究区的台站分布和射线覆盖(T=20 s)
红色三角形为流动地震台, 绿色三角形为中国地震局及其各省局固定地震台
Figure 3. Stations and path coverage in the study region for a period of 20 s
Red triangles represent portable seismic stations, green triangles represent permanent seismic stations of national and provincial stations of China Earthquake Administration
![]()
图 5 检测板测试结果
(a)-(c)为理论输入模型; (d)-(f)为利用周期10 s观测的输出模型; (g)-(i)为利用周期50 s观测的输出模型. 从顶部至底部3排子图分别表示对于异常大小1°, 2°和3°的测试. 彩色阴影为各向同性群速度异常, 黑色短线表示各向异性的强度与快波方向. 所有异常均相对于区域平均群速度值
Figure 5. Checkerboard tests
(a)-(c) are input models; (d)-(f) are output models in a period of 10 s using observation paths; (g)-(i) are output models in a period of 50 s using observation paths. The three rows of subfigures from top to bottom are the tests respectively with anomaly sizes of 1°, 2° and 3°. Color shades represent isotropic group velocity anomalies, black bars represent anisotropy strength and fast wave directions. All relative anomalies are relative to regional average group velocity
![]()
图 6 研究区周期为10, 20, 35和50 s各向同性速度和各向异性分布
绿色线段表示研究区主要断层构造线, 彩色阴影表示各向同性群速度异常, 黑色线段表示 各向异性的强度与快波方向, 灰线表示河流. 所有异常均相对于区域平均群速度值
Figure 6. Distribution of velocity and anisotropy of Rayleigh-wave at the periods of 10 s, 20 s, 35 s and 50 s
Green lines represent main fault structure lines, color shades represent isotropic group velocity anomalies, black bars represent anisotropy strength and fast wave directions, and gray line represents rivers. All relative anomalies are relative to regional average group velocity
![]()
图 7 SKS波与周期为35 s的瑞雷波快波方向对比图
图中红色短线表示瑞雷波快波方向,蓝色短线表示前人利用SKS波得到的快波方向 (王椿镛等,2007; Su et al,2008; 常利军等, 2008a,b,2009,2011; 易桂喜等, 2010; 胡亚轩等,2011; 黄忠贤,2011; 石玉涛等,2013; 王琼等,2013)
Figure 7. Comparison of Rayleigh fast direction in the period of 35 s with SKS fast direction
Red bars represent fast directions of Rayleigh wave; blue bars represent fast directions of SKS (after Wang et al,2007; Su et al,2008; Chang et al, 2008a,b,2009,2011; Yi et al,2010; Hu et al, 2011; Huang,2011; Shi et al, 2013; Wang et al, 2013)
-
常利军, 王椿槦, 丁志峰. 2008a. 四川及邻区上地幔各向异性研究[J]. 中国科学: D辑, 38(12): 1589-1599. Chang L J, Wang C Y, Ding Z F. 2008a. Seismic anisotropy of upper mantle in Sichuan and adjacent regions[J]. Science in China: Series D, 51(12): 1683-1693.
常利军, 王椿镛, 丁志峰, 周民都, 杨建思, 徐智强, 姜旭东, 郑秀芬. 2008b. 青藏高原东北缘上地幔各向异性研究[J]. 地球物理学报, 51(2): 431-438. Chang L J, Wang C Y, Ding Z F, Zhou M D, Yang J S, Xu Z Q, Jing X D, Zheng X F. 2008b. Seismic anisotropy of upper mantle in the northeastern margin of the Tibetan Plateau[J]. Chinese Journal of Geophysics, 51(2): 431-438 (in Chinese).
常利军, 王椿槦, 丁志峰. 2009. 中国东部上地幔各向异性研究[J]. 中国科学: D辑, 39(9): 1169-1178. Chang L J, Wang C Y, Ding Z F. 2009. Seismic anisotropy of upper mantle in eastern China[J]. Science in China: Series D, 52(6): 774-783.
常利军, 王椿镛, 丁志峰. 2011. 鄂尔多斯块体及周缘上地幔各向异性研究[J]. 中国科学: 地球科学, 41(5): 686-699. Chang L J, Wang C Y, Ding Z F. 2011. Upper mantle anisotropy in the Ordos block and its margins[J]. Science China: Earth Science, 54(6): 888-900.
冯梅, 安美建. 2013. 反演模型分辨率的估算方法[J]. CT 理论与应用研究, 22(4): 587-604. Feng M, An M J. 2013. How to determine spatial resolution for an inverse problem[J]. CT Theory and Applications, 22(4): 587-604 (in Chinese).
胡亚轩, 崔笃信, 季灵运, 郝明. 2011. 鄂尔多斯块体及其周缘上地幔各向异性分析研究[J]. 地球物理学报, 54(6): 1549-1558. Hu Y X, Cui D X, Ji L Y, Hao M. 2011. Seismic anisotropy of upper mantle in Ordos block and adjacent regions[J]. Chinese Journal of Geophysics, 54(6): 1549-1558 (in Chinese).
黄忠贤. 2011. 华北地区地壳上地幔速度各向异性研究[J]. 地球物理学报, 54(3): 681-691. Huang Z X. 2011. Velocity anisotropy in the crust and upper mantle of North China[J]. Chinese Journal of Geophysics, 54(3): 681-691.
嘉世旭, 张先康. 2005. 华北不同构造块体地壳结构及其对比研究[J]. 地球物理学报, 48(3): 611-620. Jia S X, Zhang X K. 2005. Crustal structure and comparison of different tectonic blocks in North China[J]. Chinese Journal of Geophysics, 48(3): 611-620 (in Chinese).
刘希强, 周蕙兰, 郑治真. 1998. 地震各向异性研究进展[J]. 地震研究, 21(2): 185-195. Liu X Q, Zhou H L, Zheng Z Z. 1998. Progress in research on the seismic anisotropy[J]. Journal of Seismological Research, 21(2): 185-195 (in Chinese).
任纪舜. 2003. 新一代大地构造图: 中国及邻区大地构造图(1: 5000000)[J]. 地球学报, 24(1): 1-2. Ren J S. 2003. A new tectonic map of China: Tectonic map of China (1: 5000000)[J]. Acta Geoscientia Sinice, 24(1): 1-2 (in Chinese).
石玉涛, 高原, 张永久, 王辉, 姚志祥. 2013. 松潘-甘孜地块东部、 川滇地块北部与四川盆地西部的地壳剪切波分裂[J]. 地球物理学报, 56(2): 481-494. Shi Y T, Gao Y, Zhang Y J, Wang H, Yao Z X. 2013. Shear-wave splitting in the crust in Eastren Songpan-Garzê block, Sichuan-Yunnan block and western Sichuan Basin[J]. Chinese Journal of Geophysics, 56(2): 481-494 (in Chinese).
苏伟, 王椿镛, 黄忠贤. 2008. 青藏高原及邻区的Rayleigh面波的方位各向异性[J]. 中国科学: D辑, 38(6): 674-682. Su W, Wang C Y, Huang Z X. 2008. azimuthal anisotropy of Rayleigh waves beneath the Tibetan Plateau and adjacent areas[J]. Science in China: Series D, 51(12): 1717-1725.
王琼, 高原, 石玉涛, 吴晶. 2013. 青藏高原东北缘上地幔地震各向异性: 来自SKS、 PKS和SKKS震相分裂的证据[J]. 地球物理学报, 56(3): 892-905. Wang Q, Gao Y, Shi Y T, Wu J. 2013. Seismic anisotropy in the uppermost mantle beneath the northeastern margin of Qinghai-Tibet plateau: Evidence from shear wave splitting of SKS, PKS and SKKS[J]. Chinese Journal of Geophy-sics, 56(3): 892-905 (in Chinese).
王椿镛, 常利军, 吕智勇, 秦嘉政, 苏伟, Silver P, Flesch L. 2007. 青藏高原东部上地幔各向异性及相关的壳幔耦合型式[J]. 中国科学: D辑, 37(4): 495-503. Wang C Y, Chang L J, Lü Z Y, Qin J Z, Su W, Silver P, Flesch L. 2007. Seismic anisotropy of upper mantle in eastern Tibetan Plateau and related crust-mantle coupling pattern[J]. Science in China: Series D, 50(8): 1150-1160.
易桂喜, 姚华建, 朱介寿, van der Hilst R D. 2010. 用Rayleigh面波方位各向异性研究中国大陆岩石圈变形特征[J]. 地球物理学报, 53(2): 256-268. Yi G X, Yao H J, Zhu J S, van der Hilst R D. 2010. Lithospheric deformation of continental China from Rayleigh wave azimuthal anisotropy[J]. Chinese Journal of Geophysics, 53(2): 256-268 (in Chinese).
张国苓, 杨晓松, 陈建业, 闫小兵. 2010. 中下地壳岩石弹性波各向异性的影响因素[J]. 地震地质, 32(2): 327-337. Zhang G L, Yang X S, Chen J Y, Yan X B. 2010. The influence factor of elastic anisotropy in middle to lower continental crust[J]. Seismology and Geology, 32(2): 327-337 (in Chinese).
张国伟, 张本仁, 袁学诚. 2001. 秦岭造山带与大陆动力学[M]. 北京: 科学出版社: 1-855. Zhang G W, Zhang B R, Yuan X C. 2001. Qinling Orogenic Belt and Continental Dynamics[M]. Beijing: Science Press: 1-855 (in Chinese).
张中杰. 2002. 地震各向异性研究进展[J]. 地球物理学进展, 17(2): 281-293. Zhang Z J. 2002. A review of the seismic anisotropy and its applications[J]. Progress in Geophysics, 17(2): 281-293.
赵琳, 安美建, 沈旭章, 代光辉, 田建雄. 2011. 云南地区的背景弹性波场分析[J]. 地震学报, 33(6): 723-734. Zhao L, An M J, Shen X Z, Dai G H, Tian J X. 2011. Analyses of the background weak seismic signals in Yunnan, China[J]. Acta Seismologica Sinica, 33(6): 723-734 (in Chinese).
郑现, 赵翠萍, 周连庆, 郑斯华. 2012. 中国大陆中东部地区基于背景噪声的瑞利波层析成像[J]. 地球物理学报, 55(6): 1919-1928. Zheng X, Zhao C P, Zhou L Q, Zheng S H. 2012. Rayleigh wave tomography from ambient noise in Central and Eastern Chinese mainland[J]. Chinese Journal of Geophysics, 55(6): 1919-1928 (in Chinese).
郑秀芬, 欧阳飚, 张东宁, 姚志祥, 梁建宏, 郑洁. 2009. "国家数字测震台网数据备份中心"技术系统建设及其对汶川大地震研究的数据支撑[J]. 地球物理学报, 52(5): 1412-1417. Zheng X F, Ouyang B, Zhang D N, Yao Z X, Liang J H, Zheng J. 2009. Technical system constrution of Dada Backup Centre for China Seimograph Network and the dada support to researches on the Wenchuan earthquake[J]. Chinese Journal of Geophysics, 52(5): 1412-1417 (in Chinese).
An M J, Shi Y L. 2006. Lithospheric thickness of the Chinese continent[J]. Phys Earth Planet Inter, 159(3/4): 257-266.
Backus G E. 1965. Possible forms of seismic anisotropy of the uppermost mantle under oceans[J]. J Geophys Res, 70(14): 3429-3439.
Backus G E. 1970. A geometrical picture of anisotropic elastic tensors[J]. Rev Geophys, 8(3): 633-671.
Bensen G D, Ritzwoller M H, Barmin M P, Levshin A L, Lin F, Moschetti M P, Shapiro N M, Yang Y. 2007. Processing seismic ambient noise data to obtain reliable broad-band surface wave dispersion measurements[J]. Geophys J Int, 169(3): 1239-1260.
Christensen N I, Salisbury M H. 1979. Seismic anisotropy in the oceanic upper mantle: Evidence from the bay of islands ophiolite complex[J]. J Geophys Res, 84(B9): 4601-4610.
Crampin S, Chastin S. 2003. A review of shear wave splitting in the crack-critical crust[J]. Geophys J Int, 155(1): 221-240.
Dziewonski A M, Anderson D L. 1981. Preliminary reference Earth model[J]. Phys Earth Planet Inter, 25(4): 297-356.
Dziewonski A, Bloch S, Landisman M. 1969. A technique for the analysis of transient seismic singnals[J]. Bull Seismol Soc Am, 59(1): 427-444.
Feng M, An M J. 2010. Lithospheric structure of the Chinese mainland determined from joint inversion of regional and teleseismic Rayleigh-wave group velocities[J]. J Geophys Res, 115(B6): B06317.
Feng M, Assumpção M, van der Lee S. 2004. Group-velocity tomography and lithospheric S-velocity structure of the South American continent[J]. Phys Earth Planet Inter, 147: 315-331.
Feng M, An M J, Zhao W J, Xue G Q, Mechie J, Zhao Y. 2011. Lithosphere structures of northeast Tibetan Plateau and their geodynamic implications[J]. J Geodyn, 52(5): 432-442.
Griot D A, Montagner J P, Tapponnier P. 1998. Phase velocity structure from Rayleigh and Love waves in Tibet and its neighboring regions[J]. J Geophys Res, 103(B9): 21215-21232.
Herrin E, Goforth T. 1977. Phase-matched filters: Application to the study of Rayleigh waves[J]. Bull Seismol Soc Am, 67(5): 1259-1275.
Herrmann R B, Ammon C J. 2002. Computer programs in seismology version 3.20: Surface waves, receiver functions, and crustal structure[CP/OL]. [2013-09-21]. http://mnw.eas.slu.edu/People/RBHerrmann/.
Inoue H, Fukao Y, Tanabe K, Ogata Y. 1990. Whole mantle P-wave travel time tomography[J]. Phys Earth Planet Inter, 59(4): 294-328.
Lebedev S, Nolet G. 2003. Upper mantle beneath Southeast Asia from S velocity tomography[J]. J Geophys Res, 108(B1): 2048.
Leven J H, Jackson I, Ringwood A E. 1981. Upper mantle seismic anisotropy and lithospheric decoupling[J]. Nature, 289(5795): 234-239.
Mackenzie D B. 1972. Peridotite fabrics and velocity anisotropy in the Earth's mantle[J]. GSA, 132: 593-604.
Marone F, Romanowicz B. 2007. The depth distribution of azimuthal anisotropy in the continental upper mantle[J]. Nature, 447(7141): 198-201.
McEvilly T V. 1964. Central U.S. crust-upper mantle structure from Love and Rayleigh wave phase velocity inversion[J]. Bull Seismol Soc Am, 54(6A): 1997-2015.
Montagner J P, Nataf H C. 1986. A simple method for inverting the azimuthal anisotropy of surface waves[J]. J Geophys Res, 91(B1): 511-520.
Montagner J P, Jobert N. 1988. Vectorial tomography: Ⅱ. Application to the Indian Ocean[J]. Geophys J Int, 94(2): 309-344.
Montagner J P, Tanimoto T. 1991. Global upper mantle tomography of seismic velocities and anisotropies[J]. J Geophys Res, 96(B12): 20337-20351.
Nyman D C, Landisman M. 1977. The display-equalized filter for frequency-time analysis[J]. Bull Seismol Soc Am, 67(2): 393-404.
Okaya D A, Christensen N, Stanley D, Stern T, South Iland Geophysical Transect (SIGHT) Working Group. 1995. Crustal anisotropy in the vicinity of the Alpine Fault Zone, South Island, New Zealand[J]. New Zeal J Geol Geophys, 38(4): 579-583.
Paige C C, Saunders M. 1982a. LSQR: An algorithm for sparse linear equations and sparse least squares[J]. ACM Trans Math Software, 8(2): 43-71.
Paige C C, Saunders M. 1982b. Algorithm 583, LSQR: Sparse linear equations and least squares problems[J]. ACM Trans Math Software, 8(2): 195-209.
Polat G, Lebedev S, Readman P W, O'reilly B M, Hauser F. 2012. Anisotropic Rayleigh-wave tomography of Ireland's crust: Implications for crustal accretion and evolution within the Caledonian Orogen[J]. Geophys Res Lett, 39(4): L04302.
Royden L H, Burchfiel B C, King R W, Wang E, Chen Z L, Shen F, Liu Y P. 1997. Surface deformation and lower crustal flow in Eastern Tibet[J]. Science, 276(5313): 788-790.
Shapiro N M, Campillo M. 2004. Emergence of broadband Rayleigh waves from correlations of the ambient seismic noise[J]. Geophys Res Lett, 31(7): L07614.
Sharma M D. 2002. Group velocity along general direction in a general anisotropic medium[J]. Inter J Solid Struct, 39(12): 3277-3288.
Silveira G, Stutzmann E. 2002. Anisotropic tomography of the Atlantic Ocean[J]. Phys Earth Planet Inter, 132(4): 237-248.
Silver P G, Chan W W. 1991. Shear wave splitting and subcontinental mantle deformation[J]. J Geophys Res, 96(B10): 16429-16454.
Smith M L, Dahlen F A. 1973. The azimuthal dependence of Love and Rayleigh wave propagation in a slightly anisotropic medium[J]. J Geophys Res, 78(17): 3321-3333.
Su W, Wang C Y, Huang Z X. 2008. Azimuthal anisotropy of Rayleigh waves beneath the Tibetan Plateau and adjacent areas[J]. Science in China: Series D, 51(12): 1717-1725.
Tanimoto T, Anderson D L. 1984. Mapping convection in the mantle[J]. Geophys Res Lett, 11(4): 287-290.
Tanimoto T, Anderson D L. 1985. Lateral heterogeneity and azimuthal anisotropy of the upper mantle: Love and Rayleigh waves 100-250 s[J]. J Geophys Res, 90(B2): 1842-1858.
Thurston R N. 1964. Effective elastic coefficients for wave propagation in crystals under stress[J]. J Acoust Soc Amer, 37(2): 348-356.
Trampert J, Woodhouse J H. 2003. Global anisotropic phase velocity maps for fundamental mode surface waves between 40 and 150 s[J]. Geophys J Int, 154(1): 154-165.
Vinnik L P, Makeyeva L I, Milev A, Usenko A Y. 1992. Global patterns of azimuthal anisotropy and deformations in the continental mantle[J]. Geophys J Int, 111(3): 433-447.
Zhao L, Xue M. 2010. Mantle flow pattern and geodynamic cause of the North China Craton reactivation: Evidence from seismic anisotropy[J]. Geochem Geophys Geosyst, 11(7): Q07010.
Zheng X F, Yao Z X, Liang J H, Zheng J. 2010. The role played and opportunities provided by IGP DMC of China National Seismic Network in Wenchuan earthquake disaster relief and researches[J]. Bull Seismol Soc Am, 100(5B): 2866-2872.
 下载:
下载:


计量
- 文章访问数: 562
- HTML全文浏览量: 226
- PDF下载量: 19
