

Anomalous seismic activities in the Sichuan-Yunnan region and its adjacent areas before the Lushan MS7.0 earthquake by the pattern informatics method
-
摘要: 图像信息方法是一种基于统计物理学的地震预测方法. 该方法通过严格的统计检验给出地震活动状态显著偏离平均状态的地区(即显著平静或显著活跃的地区), 称为“地震热点”. 以往研究结果表明该方法是一个预测效能较高的中长期地震预测方法. 本文利用中国地震台网中心提供的1970年以来的地震目录, 在剔除余震、 选取完备震级的基础上, 基于前期研究工作结果中预测效能较高的计算参数, 即网格尺度为2°×2°、 预测时间窗为9年, 分析2008年汶川MS8.0地震后到2013年芦山MS7.0地震前川滇地区的图像信息演化过程. 结果表明, 2009—2010年间芦山MS7.0地震震中附近的鲜水河断裂带、 龙门山断裂带和安宁河断裂带交汇区(29°—31°N, 101°—105°E)存在明显的地震热点, 2011—2012年该地震热点缩小至(29°—31°N, 101°—103°E)范围, 2012年以后消失, 继而于2013年发生芦山MS7.0地震. 本文还对比研究了网格尺度为1°×1°时的图像信息演化过程, 结果显示2009—2010年芦山地震附近的新津—成都—德阳断裂南部、 龙泉山西缘断裂南段、 马边—盐津断裂带、 峨边断裂带、 天全—萦经断裂带(29°—30°N, 103°—104°E)也出现过地震热点, 2011年以后该热点消失, 2013年发生芦山MS7.0地震. 本文讨论了计算参数对预测结果的影响, 并根据目前存在的地震热点分析了川滇及附近地区今后强震发生的可能地点.Abstract: The Pattern Informatics (PI) method is a new approach for earthquake prediction based on statistical physics. This method can detect the regions where seismicity significantly deviates from the normal state (i.e., seismic quiescence or seismic activation), known as “seismic hotspots”, via strict statistical tests. Previous results show that PI is effective for medium-to long-term earthquake prediction. In this paper, after declustering and choosing completeness magnitude, the PI method was applied to earthquake catalogue from China Earthquake Networks Center since 1970, to detect the existence of seismic hotspots before the Lushan MS7.0 earthquake on April 20, 2013. Based on suitable parameters (with grid size of 2°×2° and forecast window of 9 years) with higher prediction efficiency according to the previous researches of western China, we obtained the evolution of PI anomaly during the period from Wenchuan MS8.0 earthquake to Sichuan Lushan MS7.0 earthquake. The results showed that obvious seismic hotspots appeared in the convergent region (29°—31°N, 101°—105°E) of the Xianshuihe, Longmenshan and An’ninghe faults from 2009 to 2010. These seismic hotspots shrank to the range of (29°—31°N, 101°—103°E) during the years of 2011—2012 and disappeared after 2012, then the 2013 Lushan MS7.0 earthquake occurred. In another evaluation of the evolution of PI anomaly by using a different set of calculation parameters (with grid size of 1°×1° and forecast window of 9 years), the results showed that there was a hotspot from 2009 to 2010 covering the southern Xinjin-Chengdu-Deyang fault, southern segment of Longquanshan western edge fault, Mabian-Yanjin fault, Ebian fault, and Tianquan-Yingjing fault (29°—30°N, 103°—104°E). After 2011, this hotspot disappeared and the Lushan MS7.0 earthquake occurred in 2013. We also discussed the potential seismic risk in the studied area as well as the influence of calculated parameters on the prediction efficiency.
-
-
![]()
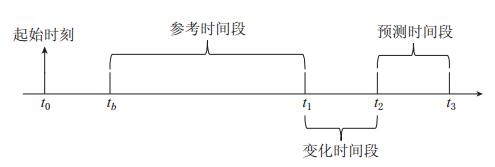
图 1 PI方法所选时刻示意图t0为研究资料的起始时刻,tb为以Δt为步长从t0时刻向t1时刻滑动的任意时刻,一般情况下取 t2-t1=t3-t2
Figure 1. Schematic diagram of time intervals for PI method t0 is initial time,tb is the moment sliding fromt0 to t1 with step interval Δt,where t2-t1=t3-t2
![]()
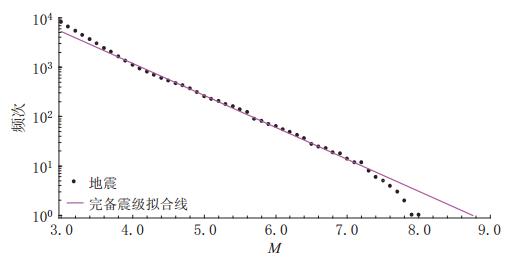
图 2 川滇地区1970年1月1日—2013年4月30日地震目录的完整性分析
Figure 2. Analysis of the seismic catalogue completeness in Sichuan-Yunnan region from 1 January 1970 to 30 April 2013
![]()
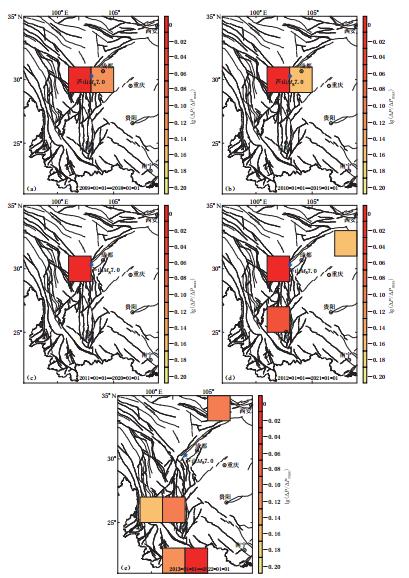
图 3 不同模型计算参数下的PI图像(网格为2°×2°)(a)-(e)分别为基于表1中模型①—⑤参数得到的计算结果,图中小方块为计算所得的热点,阈值w=-0.2
Figure 3. The PI anomalies computed with different model parameters(girds size 2°×2°)(a)-(e)are the results based on parameters of the models ①—⑤ in Table1,the colored boxes are the calculated hotspots,with threshold of -0.2. The asterisk denotes the location of Lushan MS7.0 earthquake
![]()
![]()
![]()
-
蒋长胜, 吴忠良. 2008. 对地震预测的一个统计物理算法在川滇地区的回溯性预测检验[J]. 中国科学: D辑, 38(7): 852-861. Jiang C S, Wu Z L. 2008. Retrospective forecasting test of a statistical physics model for earthquakes in Sichuan-Yunnan region[J]. Science in China: Series D, 38(7): 852-861 (in Chinese).
蒋长胜, 吴忠良, 马宏生, 周龙泉. 2009. PI算法用于川滇-安达曼-苏门答腊地区7.0级以上强震危险性预测的回溯性检验[J]. 地震学报, 31(3): 307-318. Jiang C S, Wu Z L, Ma H S, Zhou L Q. 2009. Sichuan-Yunnan versus Andaman-Sumatra: PI approach and retrospective forecast test[J]. Acta Seismologica Sinica, 31(3): 307-318 (in Chinese).
Chen C C, Rundle J B, Holliday J R, Nanjo K Z, Turcotte D L, Li S C, Tiampo K F. 2005. The 1999 Chi-Chi, Taiwan, earthquake as a typical example of seismic activation and quiescence[J]. Geophys Res Letts, 32(22): L22315. doi:10.1029/200567L023991.
Chen C C, Rundle J B, Li H C, Holliday J R, Nanjo K Z, Turcotte D L, Tiampo K F. 2006. From tornadoes to earthquakes: Forecast verification for binary events applied to the 1999 Chi-Chi, Taiwan, earthquake[J]. Terr Atmos Ocean Sci,17(3): 503-516.
Holliday J R, Nanjo K Z, Tiampo K F, Rundle J B, Turcotte D L. 2005. Earthquake forecasting and its verification[J]. Nonlinear Processes in Geophysics,12(6): 965-977.
Holliday J R, Rundle J B, Tiampo K F, Klein W, Donnellan A. 2006. Systematic procedural and sensitivity analysis of the pattern informatics method for forecasting large (M>5) earthquake events in southern California[J]. Pure Appl Geophys,163(11/12): 2433-2454.
Keilis-Borok V I, Knopoff L, Rotvain I M. 1980. Bursts of aftershocks, long-term precursors of strong earthquakes[J]. Nature,283(5744): 259-263.
Nanjo K Z, Rundle J B, Holliday J R, Turcotte D L. 2006a. Pattern informatics and its application for optimal forecasting of large earthquakes in Japan[J]. Pure Appl Geophys,163(11/12): 2417-2432.
Nanjo K Z, Holliday J R, Chen C C, Rundle J B, Turcotte D L. 2006b. Application of a modified pattern informatics method to forecasting the locations of future large earthquakes in the central Japan[J]. Tectonophysics,424(3/4): 351-366.
Rundle J B, Klein W, Tiampo K F, Gross S. 2000. Linear pattern dynamics in nonlinear threshold systems[J]. Phys Rev E,61(3): 2418-2432.
Rundle J B, Tiampo K F, Klein W, Sá Martins J S. 2002. Self-organization in leaky threshold systems: The influence of near-mean field dynamics and its implications for earthquakes, neurobiology, and forecasting[J]. Proc Natl Acad Sci,99(Suppl.1): 2514-2521.
Tiampo K F, Rundle J B, McGinnis S A, Klein W. 2002. Pattern dynamics and forecast methods in seismically active regions[J]. Pure Appl Geophys,159(10): 2429-2467.
Wu Y H, Chen C C, Rundle J B. 2008a. Detecting precursory earthquake migration patterns using the pattern informatics method[J]. Geophys Res Letts,35(19): L19304.
Wu Y H, Chen C C, Rundle J B. 2008b. Precursory seismic activation of the Pingtung (Taiwan) offshore doublet earthquakes on 26 December 2006: A pattern informatics analysis[J]. Terre Atmos Ocean Sci,19(6): 743-749.
Zhang Y X, Zhang X T, Yin X C, Wu Y J. 2009. Study on the forecast effects of PI method to the North and Southwest China[C]//Concurrency and Computation: Practice and Experience. New Jersey: John Wiley & Sons, Ltd.: 1559-1568.
Zhang Y X, Zhang X T, Wu Y J, Yin X C. 2013. Retrospective study on the predictability of pattern informatics to the Wenchuan M8.0 and Yutian M7.3 earthquakes[J]. Pure Appl Geophys,170(1/2): 197-208.
 下载:
下载:


计量
- 文章访问数: 531
- HTML全文浏览量: 212
- PDF下载量: 16
