

Analysis of terrain effect on the properties of ground motion
-
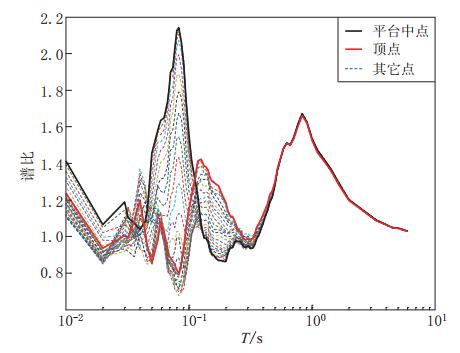
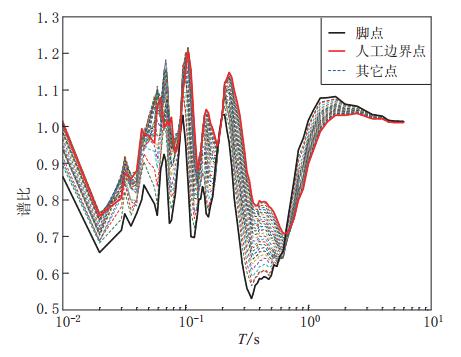
摘要: 采用基于ABAQUS平台的显式有限元动力学分析方法,结合人工黏弹性边界理论,研究了局部凸起地形对地震动特性(包括反应谱、峰值加速度、峰值速度和峰值位移等)的影响,分析了台地宽度对地形放大效应的影响.结果表明:凸起地形平台段空间点地震动受地形效应影响较大,在零阻尼条件下,其谱比曲线呈双峰特点,.8—0.9s的中长周期段谱比达到一个较大值1.6,在0.08—0.09s的高频段谱比超过2.0,且最大值出现在平台中点;对于凸起地形斜坡段,在大部分周期点处,顶点的谱比高于其它斜坡点,而且在周期超过0.4s的频段,斜坡段观测点的谱比表现出较明显的规律性,即越靠近顶点的观测点,其谱比值越大;坡底段地表不同观测点的谱比基本在脚点与计算边界点(人工边界点)对应的谱比值之间变化,在不同的频段均表现出较明显的规律性.凸起地形平台段宽度对地震动高频成分的放大效应具有较大影响,但只局限在一定的宽度范围内,随着宽度的增大,其对地形放大效应的影响逐渐减弱. 此外,台地宽度的变化对地震动峰值加速度的放大效应有一定的影响,而对峰值速度、峰值位移的放大效应的影响则不明显.Abstract: The explicit finite element analysis method combined with the artificial viscous-elastic boundary theory based on the platform ABAQUS is performed to evaluate the terrain effects on ground motion (such as the response spectrum, peak acceleration, peak velocity and peak displacement), and the influence of the terrain width on its amplification effects is studied. The results show that the ground motions on the platform are affected most seriously by the topography; in the zero damping conditions, the spectral ratio curves present the characteristics of double peaks,with their values being a higher value of 1.6 in the long period range of 0.8—0.9 s and exceeding 2 in the high-frequency range of 0.08—0.09 s, and the maximum ratio appearing at the midpoint of the platform. For the slope section, as to most natural periods of response spectrum, the spectral ratios of the vertices are higher than the other surface points on theslope.Inaddition,inthenatural period beyond 0.4 s, the spectral ratios of the spatial points on the slope show some regularity: the closer to the vertex the observation point, the greater the spectral ratio.Spectral ratios of different observation points on the bottom change between spectral ratios corresponding to basic foot point and those to the boundary point,ortheartificial boundary point, which is obvious in different frequency bands. The width of terrain imposes significant influence on its amplification effects on high-frequency componentsofgroundmotion.However, such influenceislimited in some range of width, and with the increase of width, the influence of width on the topographic amplification effects becomes weak. In addition, the width of terrain influences the amplification effect on the peak acceleration of ground motion to some extent, while its influences on the amplification effects on thepeakground velocity and peak ground displacement are not distinct.
-
-
![]()
图 3 黏弹性边界计算结果与理论解比较(a)水平向;(b)竖直向
Figure 3. Comparison of viscous-elastic boundary calculated results with the theoretical solutions(a)Horizontal;(b)Vertical
![]()
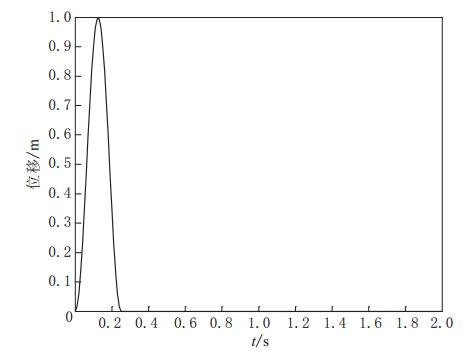
图 4 脉冲输入与输出位移对比图
Figure 4. Comparison of displacement between input and output for a pulse
![]()
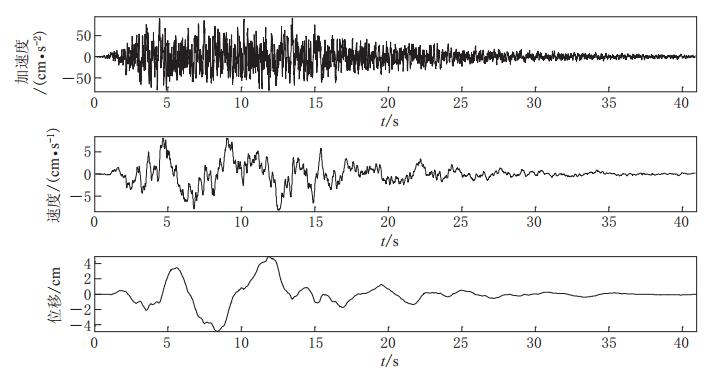
图 5 人工地震动样本的加速度、速度和位移曲线
Figure 5. Acceleration,velocity and displacement curves of artificial ground motion samples
![]()
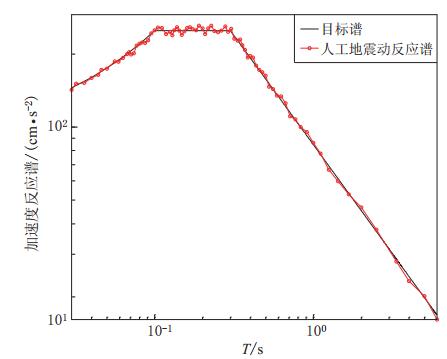
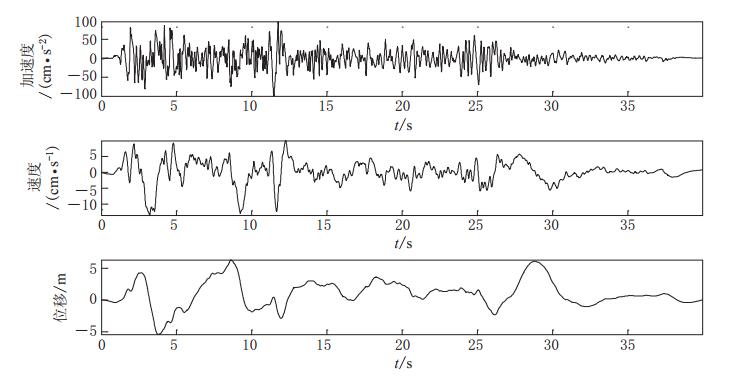
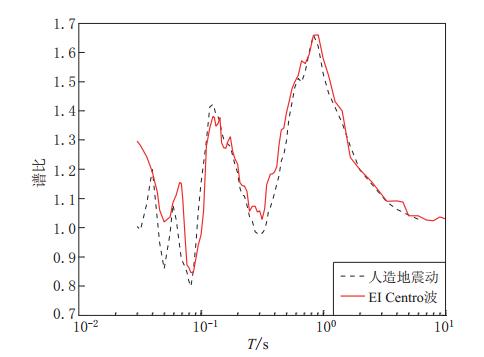
图 7 模拟ElCentro波所得的地震动样本
Figure 7. El Centro wave simulated ground motions resulting sample
![]()
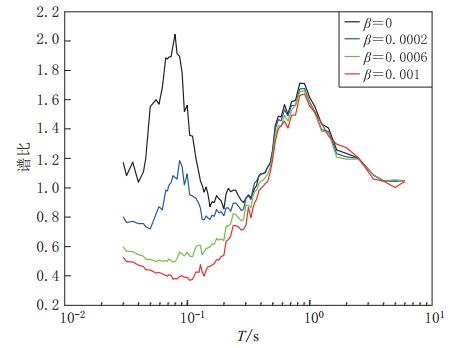
图 10 平台段地表点的谱比曲线图
Figure 10. Spectral ratio chart of the surface point on the platform
![]()
图 11 斜坡段地表点的谱比曲线图
Figure 11. Spectral ratio chart of surface point on the slope section
![]()
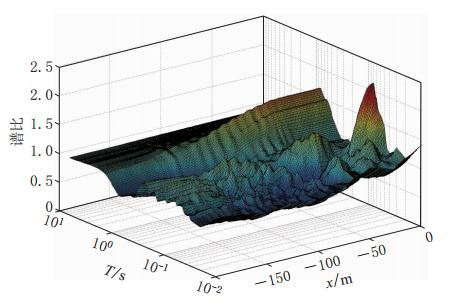
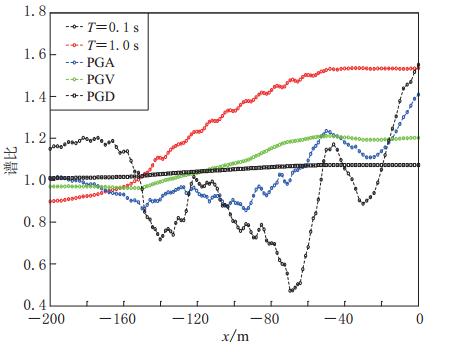
图 13 不同周期点的谱比随距离的变化
Figure 13. Change of spectral ratio of different cycle points with the distance
![]()
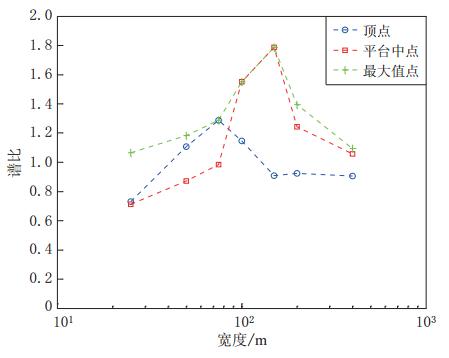
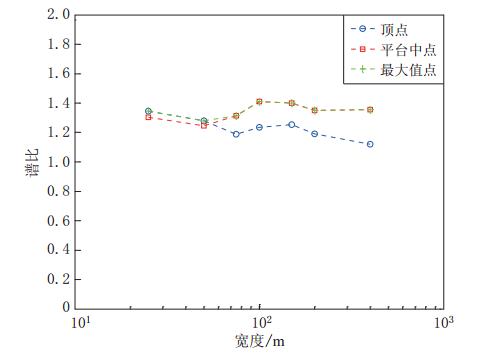
图 15 周期0.1 s处谱比随宽度的变化
Figure 15. Changes of spectral ratio of 0.1 s cycle point with the width
![]()
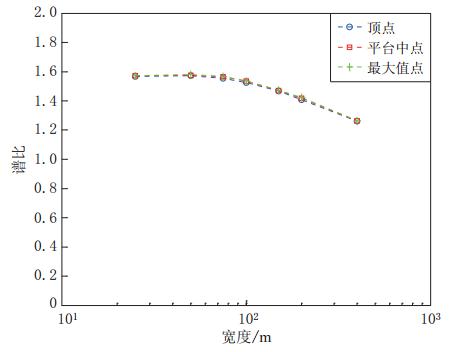
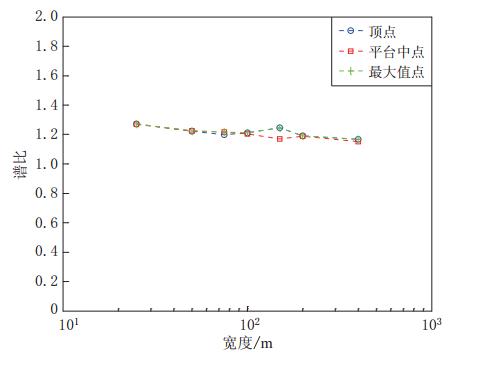
图 16 周期1.0 s处谱比随宽度的变化
Figure 16. Change of spectral ratio of 1.0 s cycle point with the width
![]()
图 17 峰值加速度放大倍数随宽度的变化图
Figure 17. Change of peak ground acceleration magnification with the width
![]()
图 18 峰值速度放大倍数随宽度的变化
Figure 18. Change of peak ground velocity magnification with the width
-
中华人民共和国建设部. 2010. GB50011-2010建筑抗震设计规范[S]. 北京: 中国建筑工业出版社, 21. Ministry of Construction of the People’s Republic of China. 2010. GB50011-2010 Code for Seismic Design of Buildings[S]. Beijing: China Building Industry Press, 21 (in Chinese).
 下载:
下载:


计量
- 文章访问数: 549
- HTML全文浏览量: 244
- PDF下载量: 15
