

Relative locations among the 2006, 2009 and 2013 North Korean underground nuclear tests
-
摘要: 采用双差定位方法, 对朝鲜2006年、2009年和2013年的3次核试验进行相对定位.根据19个区域地震台和8个远震台的垂直分量波形资料, 计算了多种震相(P波、S波和LR波等)的互相关时差, 并由测量时差反演两两核爆的相对空间位置, 通过随机生成部分台站组合进行扰动实验以估算定位的不确定度.结果表明, 相对于朝鲜2009年核试验, 2013年核试验位于其南257 m、西385 m, 2006年核试验位于其南503 m、东2589 m.当扰动实验中随机选取的台站数目为20个时, 在95%置信度下, 朝鲜2013年和2006年核试验相对于2009年核试验的地表定位结果的不确定度约为150 m.Abstract: The relative locations among the 9 October 2006, 25 May 2009, and 12 February 2013 North Korean underground nuclear tests are estimated by the double-difference location algorithm, using the relative times of P signals as well as those of S and LR signals.And location uncertainties are analyzed by bootstrap method.The relative times are measured with cross-correlation technique, using vertical waveform data recorded at 19 regional and 8 teleseismic stations.The results show that the 2013 test locates 257 m south and 385 m west relative to the 2009 test with about 150 m uncertainty estimated with 20 stations resampling at 95% confidence level, and the 2006 test is about 503 m south and 2589 m east to the 2009 test with the same uncertainty.
-
-
![]()
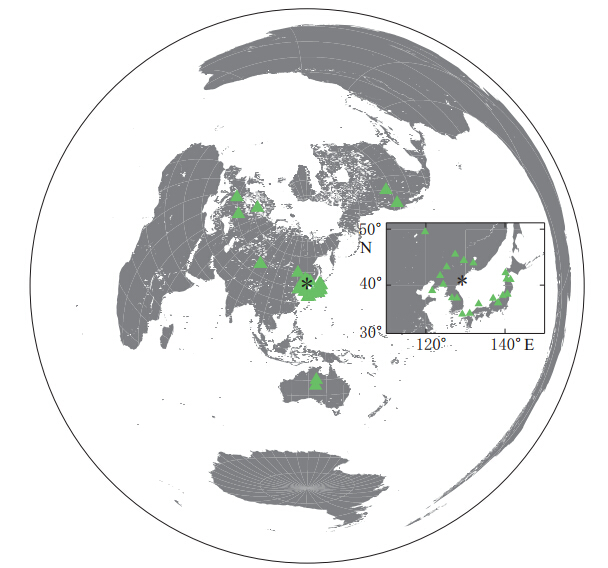
图 1 朝鲜核试验场和分析台站的分布 星号表示核试验位置,三角形表示地震台站.其中子图为区域台站分布
Figure 1. Nuclear test site and seismic stations in North Korea.The asterisk st and s for test site and triangles for stations.The subplot gives the distribution of regional stations
![]()
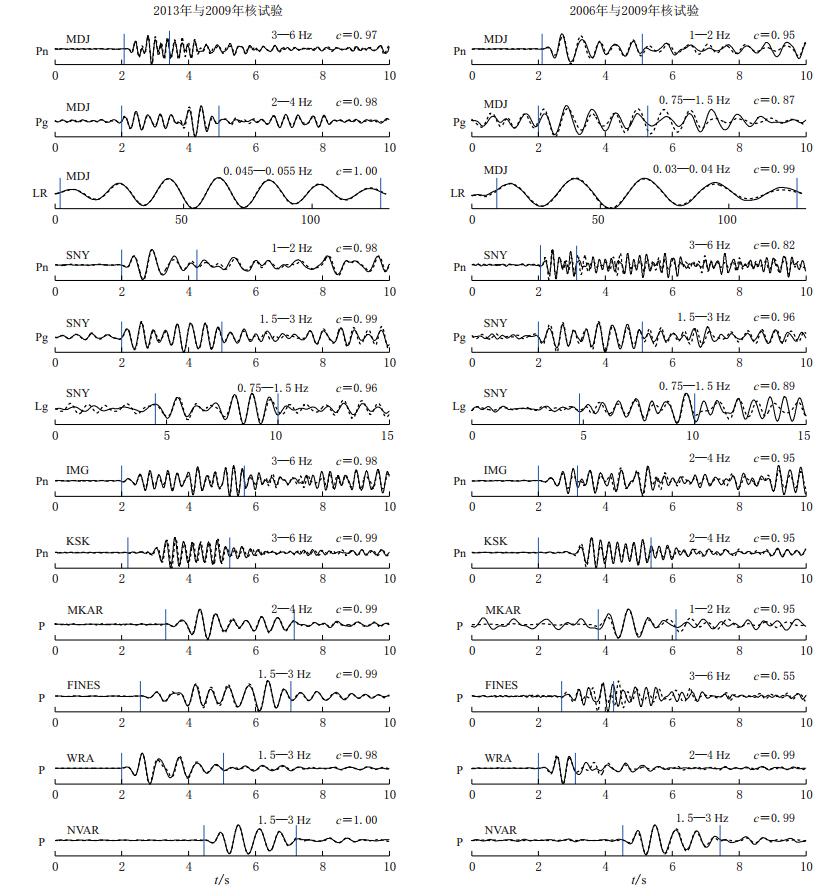
图 2 部分台站震相到时差测量.各子图中两条竖线表示计算波形相关系数的信号窗口,右侧数值给出滤波频带以及按照到时差测量结果对齐时波形的相关系数.粗虚线表示2009年核试验波形
Figure 2. Measurement of relative arrival times for some phases.In each subplot,signal window is set by two vertical lines,and waveforms with thick dashed line are the records of 2009 test and those with thin line are the records of 2013 test(left) and 2006 test(right).The correlative coefficient between each pair of waveforms aligned according to the relative arrival time and the filtering b and are showed on the right side of each subplot
![]()
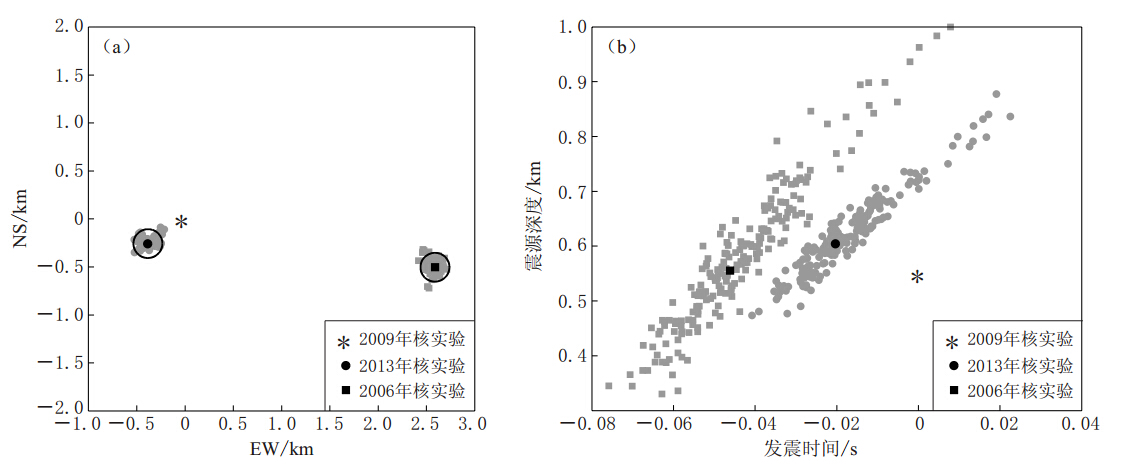
图 3 朝鲜3次核试验的相对定位结果(a)震中相对位置;(b)震源深度和发震时间.深色符号表示根据所有27个台站的定位结果,浅色符号表示随机根据其中20个台站的定位结果,圆圈表示统计的95%置信度范围.图(b)中横坐标发震时间为相对于初始参数的校正量
Figure 3. Relative locations for the three nuclear tests in North Korea(a)Relative epicenter;(b)Focal depth and origin time where the dark points are located using all of the 27 stations and the grey symbols are located using r and om 20 stations,with 95% confidence level in the dark circles.The horizontal axis in subplot(b)is the correction of occurrence time for the initial value
![]()
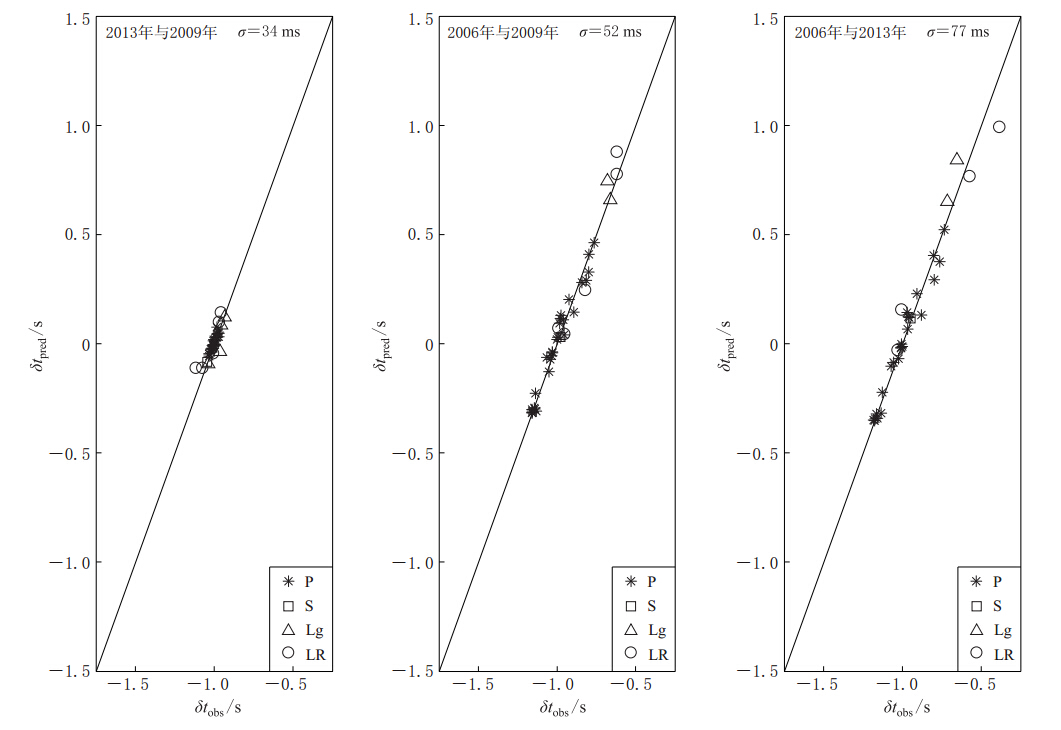
图 4 震相到时差实际观测值(δtobs)与理论值(δtpred)比较.σ为残差的标准方差
Figure 4. Comparison of observed relative arrival times with theoretical ones,where σ is st and ard deviation of the residuals
表 1 不同震相到时差测量结果及其与理论值的残差
Table 1 Relative arrival times for different phases and their residuals

 下载: 导出CSV
表 2 朝鲜3次核试验初始震源参数及相对定位结果
Table 2 Initial source parameters and relative locations for the three nuclear tests in North Korea
 下载: 导出CSV
-
国地震局地球物理研究所. 1980. 震相走时便查表[M]. 北京: 地震出版社: 2-4. Institute of Geophysics, State Seismological Bureau. 1980. Look-up Table for Travel Time of Seismic Phase[M]. Beijing: Seismological Press: 2-4 (in Chinese).
Blamey C, Gibbs P G. 1968. The epicentres and origin times of some large explosions[J]. Geophys J Int, 16 (1): 1-7.
Douglas A. 1967. Joint epicentre determination[J]. Nature, 215 (5096): 47-48.
Evernden J F. 1969. Identification of earthquakes and explosions by use of teleseismic data[J]. J Geophys Res, 74 (15): 3828-3856.
Fisk M D. 2002. Accurate locations of nuclear explosions at the Lop Nor test site using alignment of seismograms and IKONOS satellite imagery[J]. Bull Seismol Soc Am, 92 (8): 2911-2925.
Lilwall R C, Marshall P D. 1986. Body Wave Magnitudes and Locations of Soviet Underground Explosions at the Novaya Zemlya Test Site[R]. AWRE Report O17/86, HMSO, London.
Marshall P D, Bache T C, Lilwall R C. 1984. Body Wave Magnitudes and Locations of Soviet Underground Explosions at the Semipalatinsk Test Site[R]. AWRE Report O16/84, HMSO, London.
Marshall P D, Lilwall R C, Warburton P J. 1985. Body Wave Magnitudes and Locations of French Underground Explosions at the Mururoa Test Site[R]. AWRE Report O12/85, HMSO, London.
Murphy J R, Kohl B C, Stevens J L, Bennett T J, Israelsson H G. 2010. Exploitation of the IMS and other data for a comprehensive, advanced analysis of the North Korean nuclear tests[C]//Proceedings of the 2010 Monitoring Research Review: Ground-Based Nuclear Explosion Monitoring Technologies. Orlando, Florido: National Nuclear Security Administration, LA-UR-10-05578, 1 : 456-465.
Selby N D. 2010. Relative locations of the October 2006 and May 2009 DPRK announced nuclear tests using International Monitoring System Seismometer Arrays[J]. Bull Seismol Soc Am, 100 (4): 1779-1784.
Schaff D P, Bokelmann G H R, Ellsworth W L, Zanzerkia E, Waldhauser F, Beroza G C. 2004. Optimizing correlation techniques for improved earthquake location[J]. Bull Seismol Soc Am, 94 (2): 705-721.
Waldhauser F, Ellswort W L. 2000. A double-difference earthquake location algorithm: Method and application to the Northern Hayward fault, California[J]. Bull Seismol Soc Am, 90 (6): 1353-1368.
Wen L X, Long H. 2010. High-precision location of North Korea's 2009 nuclear test[J]. Seism Res Lett, 81 (1): 26-29.
计量
- 文章访问数: 578
- HTML全文浏览量: 264
- PDF下载量: 14
