

SKS splitting analysis of seismic anisotropy beneath mid-eastern Africa
-
摘要: 利用非洲台阵(Africa Array)最新的地震记录,通过测量远震SKS震相的分裂参数,详细分析了非洲中东部地区地球介质各向异性可能的成因,包括随应力场变化定向排布的裂隙和岩浆透镜体,以及橄榄石晶格的定向排布等. 结果表明,现今上地幔流动导致的橄榄石晶格定向排布是其各向异性的主要成因,该结果与250 km深度的地幔流动模型一致. 对于少数台站出现的异常结果,则尝试用D″各向异性和双层各向异性模型来解释,并在此基础上讨论了D″各向异性的研究意义.Abstract: Mid-eastern Africa is a tectonically complex region due to the presence of Tanzania craton,several paleothrust belts and shear zones. The magmatism is active and researchers believe the existence of a mantle plume. Mechanisms and structures controlling the tectonics and geodynamics in mid-eastern Africa remain unclear and the interpretations for origins of anisotropy have not converged. In this paper,by taking advantage of the most recent seismic data of Africa Array,seismic anisotropy beneath mid-eastern Africa is analyzed with teleseismic SKS splitting measurements; we try to explain the sources of anisotropy in a variety of scenarios,such as cracks,magma-filled lenses and LPO (lattice-preferred orientation) of olivine fabrics. Fast polarization patterns at most stations are consistent with tomography based on mantle flow model at the depth of 250 km,inferring that the dominant source of anisotropy beneath this region is LPO of olivine fabrics produced by dislocation creep in the asthenosphere. We attempt to interpret anomalous rose diagrams with D″ anisotropy and double-layered anisotropy. We also discuss the significance for the research of D″ anisotropy.
-
Keywords:
- mid-eastern Africa /
- mantle /
- anisotropy /
- shear wave splitting
-
-
![]()
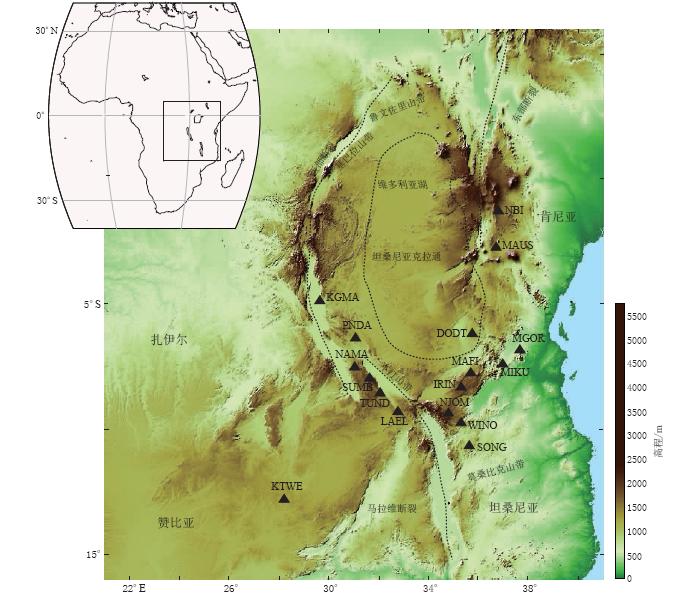
图 1 非洲中东部地区地形图以及本文使用的非洲台阵部分台站(三角形)分布
Figure 1. Topographic map of mid-eastern Africa and distribution of Africa Array stations(triangles)
![]()
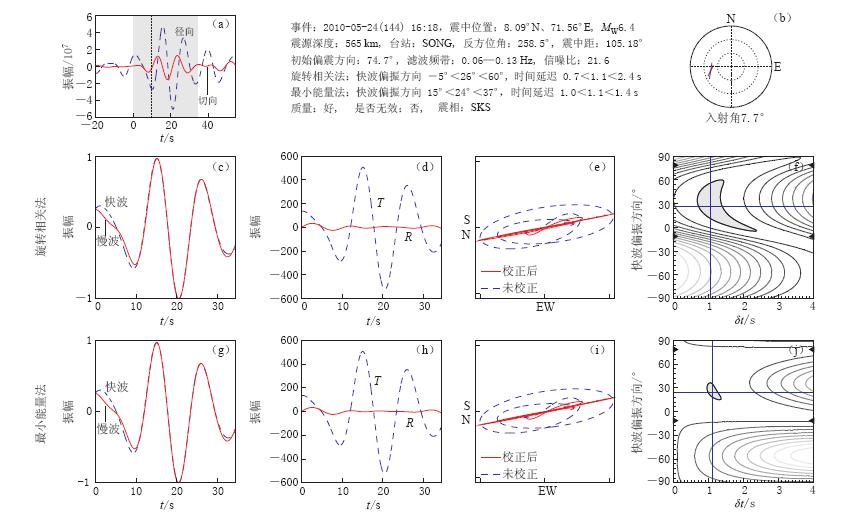
图 2 SONG台站得到的“好”(good)的剪切波分裂分析结果 (a)灰色区域为所选取的用于SKS分析的时间窗;(b)事件的反方位角分布;(c)利用旋转相关法得到的归一化快慢波波形对比;(d)利用旋转相关法得到的径向分量(R)与切向分量(T)的波形对比;(e)利用旋转相关法分析前后的水平质点运动图对比;(f)互相关系数关于快轴方向与走时差的分布;(g)利用最小能量法得到的归一化快慢波波形对比;(h)利用最小能量法得到的径向分量(R)与切向分量(T)的波形对比;(i)利用最小能量法分析前后的水平质点运动图对比;(j)切向分量能量关于快轴方向与走时差的分布
Figure 2. An example illustrating “good” measurement of SKS waveform recorded by the station SONG (a)Shaded area illustrates selected time window for SKS splitting analysis;(b)Back-azimuthal distribution of the event;(c)Comparison of normalized fast and slow waveforms with rotation correlation(RC)method;(d)Comparison ofR andT components with RC method;(e)Horizontal particle motion before and after utilizing RC method;(f)Distribution of correlation coefficients with respect to delay time and fast axis;(g)Comparison of normalized fast and slow waveforms with minimum energy(SC)method;(h)Comparison ofR andT component with SC method;(i)Horizontal particle motion before and after utilizing SC method;(j)Distribution of transverse energy with respect to delay time and fast axis
![]()
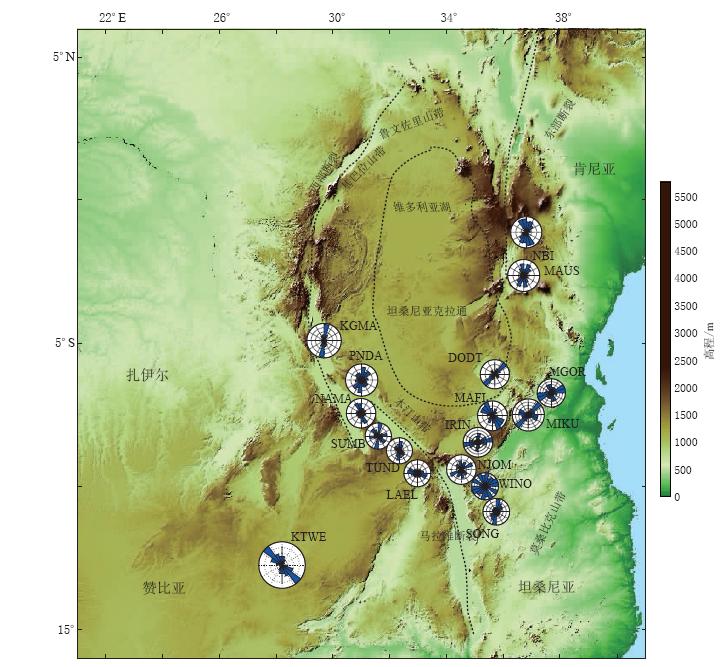
图 3 非洲台阵各台站剪切波分裂分析结果
Figure 3. Rose diagrams at stations of Africa Array illustrating the fast directions measured in this study
![]()
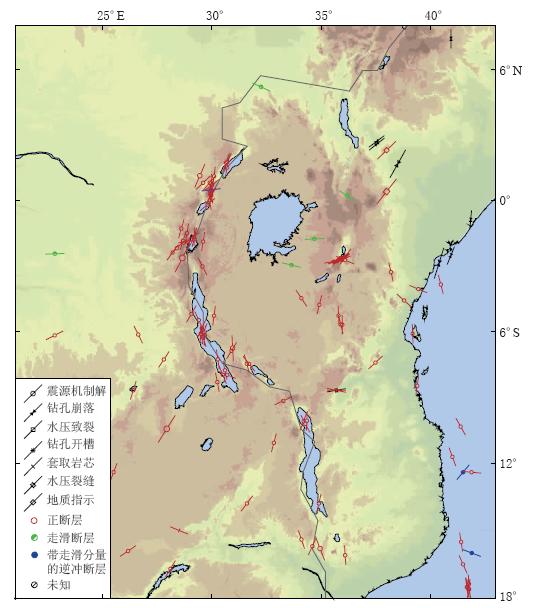
图 4 世界应力场分布图(引自Heidbachet al,2009) 不同符号表示利用不同的方法得到的水平主压应力方向.详细说明请参考www. world-stress-map.org
Figure 4. 2008 world stress map(afterHeidbachet al,2009) Downloaded from GFZ-Potsdam. Different symbols illustrate results from different methods. For more details,please see www. world-stress-map.org
![]()
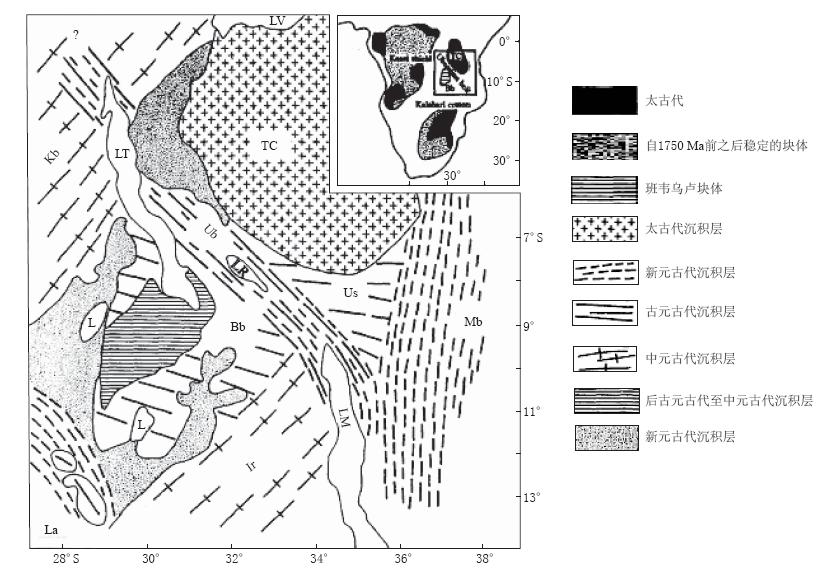
图 5 非洲中东部地区的地表断层出露(引自Lenoiret al,1994) TC: 坦桑尼亚克拉通; Ub: 本汀山带; Us: 乌萨加拉山带; Bb: 班韦乌卢块体; Kb: 基巴拉山带; Ir: 艾露麦得山带; Mb: 莫桑比克造山带; La: 鲁非尼安弧; LT: 坦噶尼喀湖; LV: 维多利亚湖; LR: 鲁夸湖; LM: 马拉维湖; L: 其它湖.更为详细的说明请参考原文
Figure 5. Geological outline of mid-eastern Africa showing the surface outcrops(afterLenoiret al,1994) TC: Archaean Tanzanian craton; Ub: Ubendian belt; Us: Usagaran belt; Bb: Bangweulu block; Kb: Kibaran belt; Ir: Irumide belt; Mb: Mozambique belt; La: Lufilian arc; LT: Lake Tanganyika; LV: Lake Victoria; LR: Lake Rukwa; LM: Lake Malawi; L: other lakes. For more details,please see the original paper
![]()
图 6 本文剪切波分裂分析结果与Forte等(2010)250 km深度处地幔流动模型的对比
Figure 6. Comparison of the results presented in this study with the mantle flow(blue arrows) model at the depth of 250 km from Forte et al(2010)
![]()
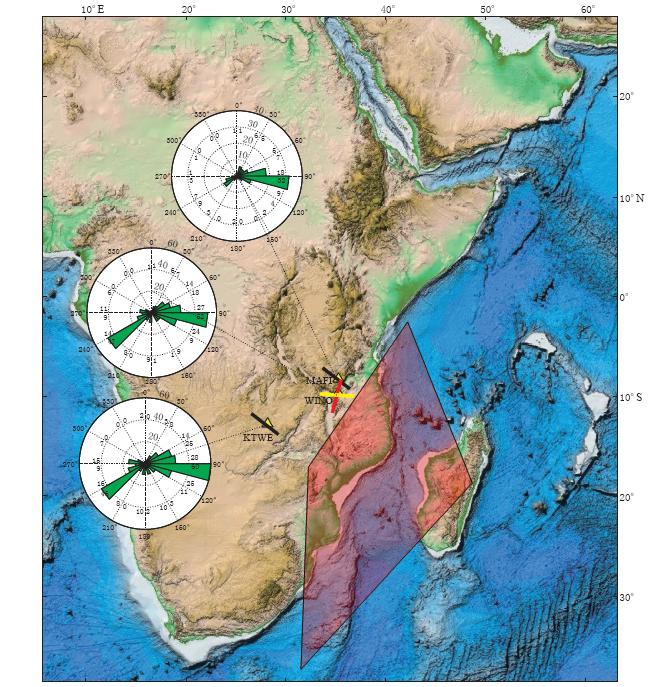
图 7 D″各向异性示意图 图中红色区域为D″各向异性可能存在的区域(Lynner,Long,2012);玫瑰图表示KTWE、WINO和MAFI等3个台站所记录到事件的反方位角分布;红色短棒表示WINO台站下层快轴方向,黄色短棒表示上层快轴,黑色短棒表示MAFI和KTWE台站快轴方向
Figure 7. Illustration of D″ anisotropy The red-shaded region denotes the location of possible D″ anisotropy(Lynner,Long,2012). Rose diagrams illustrate back-azimuth coverage of the stations KTWE,WINO and MAFI. Red bars at WINO indicate lower layer fast direction,while yellow bars correspond with upper layer. Black bars at MAFI and KTWE measure fast directions
![]()
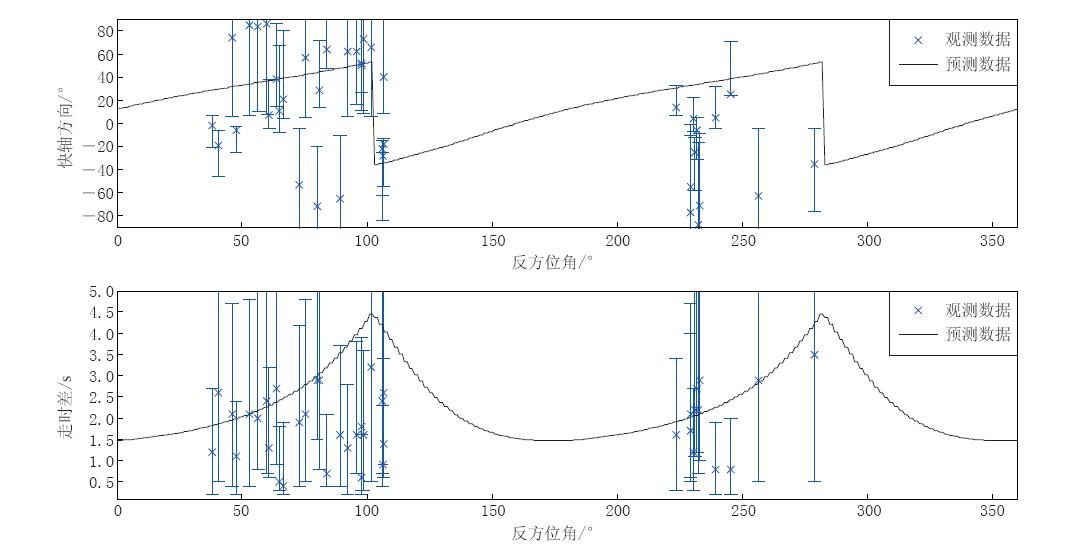
图 8 WINO台站的视分裂参数拟合结果
Figure 8. Fitness of apparent splitting parameters of the station WINO Blue crosses represent observed data with error bars,while black lines illustrate predicted data
![]()
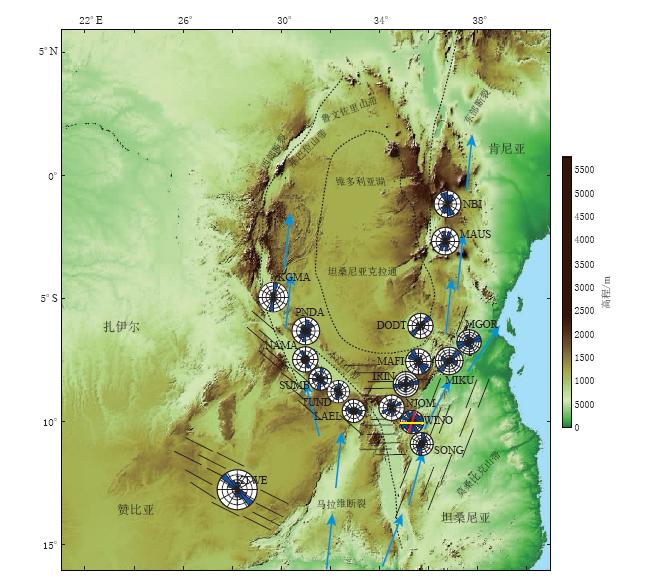
图 9 非洲中东部地区各向异性的主导因素示意图 玫瑰图表示各台站的快轴方向.蓝色箭头表示地幔流动模型(Forteet al,2010),黑色细线表示地表断层出露(Lenoiret al,1994)
Figure 9. The dominant origins of seismic anisotropy in middle-eastern African region Rose diagrams illustrate the fast directions measured in this study. Light blue arrows indicate mantle flow model(Forteet al,2010) and thin black lines are surface outcrops(Lenoiret al,1994)
-
Kendall J M, Silver P G. 1998. Investigating causes of D″ anisotropy[G]//Gurnis M, Wysession M E, Knittle E, Buffett B A eds. The Core-Mantle Boundary Region. Washington: American Geophysical Union: 97-118.
Nicolas A, Christensen N I. 1987. Formation of anisotropy in upper mantle peridotites: A review[G]//Fuchs K, Froidevaux C eds. Composition, Structure and Dynamics of the Lithosphere-Asthenosphere System. Washington: AGU, 16: 111-123.
-
期刊类型引用(9)
1. 张小艳, 郝金来, 高星, 王伟. 基于恢复地震数据获取震级、震源机制及破裂过程的评价——以2013年四川芦山M_W6.6地震为例. 地球物理学报. 2020(06): 2262-2273 .  百度学术
百度学术
2. 张蕙, 梁向军. 用CAP方法测定山西地区地震震源深度. 山西地震. 2019(02): 22-24+41 . 百度学术
3. 李启雷, 李玉丽, 刘文邦. 2018年5月6日称多5.3级地震序列重定位及发震构造分析. 地震地磁观测与研究. 2019(03): 1-6 . 百度学术
4. 柳莹, 李江, 黄涛, 马军. 复杂地震背景下新疆高土石坝抗震设计与应用实践. 水利水电技术. 2019(12): 80-89 . 百度学术
5. 赵艳红, 张帆, 苏亚梅. 内蒙古测震台网台站布局对地震定位的影响. 地震地磁观测与研究. 2018(04): 88-95 . 百度学术
6. 李锋, 李迎春, 李强, 冯志生, 王俊菲. 2016年10月20日射阳M_S4.4地震的震源机制与地震序列的时空分布特征. 地震学报. 2017(05): 659-668+818 . 本站查看
7. 王树忠, 贾昊东. 2013年内蒙古通辽5.3级地震震源断层三维特征反演. 华北地震科学. 2017(04): 70-74 . 百度学术
8. 田小慧, 金春华, 何秋菊. 海原地震带中东段几次小震震源机制解研究. 高原地震. 2016(02): 1-6+11 . 百度学术
9. 郑建常, 林眉, 王鹏, 徐长朋. CAP方法反演震源机制的误差分析:以胶东半岛两次显著中等地震为例. 地球物理学报. 2015(02): 453-462 . 百度学术
其他类型引用(1)
 下载:
下载:


计量
- 文章访问数: 624
- HTML全文浏览量: 270
- PDF下载量: 8
- 被引次数: 10
