

A study on 660 km discontinuity beneath northeast China
-
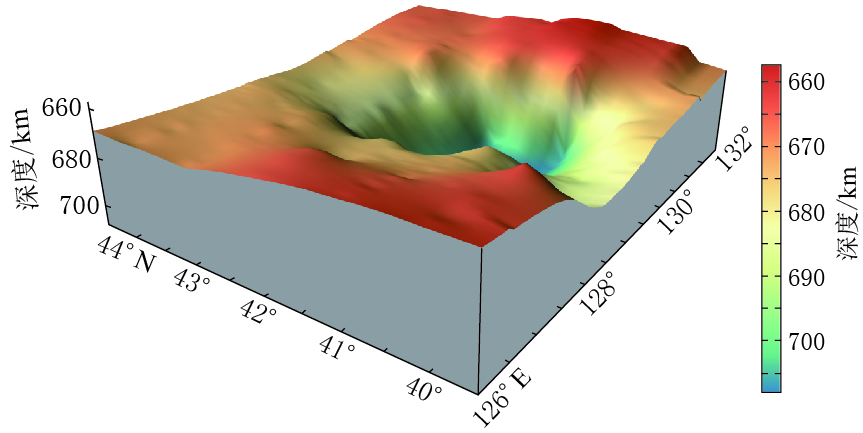
摘要: 围绕中国东北地区下方俯冲的西太平洋板块是停滞在地幔过渡带内水平向西伸展, 还是穿透660 km间断面直接进入下地幔, 始终是一个具有争议的问题. 本文基于P--SV转换波对速度间断面的敏感性, 利用中国数字地震台网在东北地区布设的136个固定地震台站记录到的远震波形数据, 通过提取台站下方的接收函数并采用共转换点(CCP)叠加技术, 得到了该区域660 km间断面的起伏变化图像. 结果显示, 东北地区下方660 km间断面下沉幅度超过20 km的区域主要集中在44°N以南、 东西跨度约400 km的范围内. 660 km间断面的下沉表明西北太平洋板块俯冲到了中国东北地区下方, 在较小区域范围内观测到的较大深度异常可能暗示着俯冲板片穿透660 km间断面直接进入了下地幔.Abstract: It is highly debated on whether the subduction Pacific slab becomes stagnant in the transition zone and extends horizontally or it penetrates into the lower mantle when the leading of the Pacific slab reaches to a depth of 660 km beneath northeast China. Taking advantage of the sensitivity of P--SV conversions to the velocity discontinuities, we employ receiver function method to constrain the topography variation of the 660 km discontinuity beneath northeast China using common conversion point (CCP) stacking. The teleseismic data recorded by 136 permanent stations operated by CDSN in northeast China are used in this study. Our results show that the 660 km discontinuity deepening more than 20 km was observed in the region to the south of 44°N with length about 400 km in the east-west direction. The local depression of the 660 km discontinuity supports that the Pacific subduction slab has reached northeast China and it may penetrates into the lower mantle locally.
-
Keywords:
- northeast China /
- subduction slab /
- receiver function /
- CCP stacking /
- 660 km discontinuity
-
-
![]()
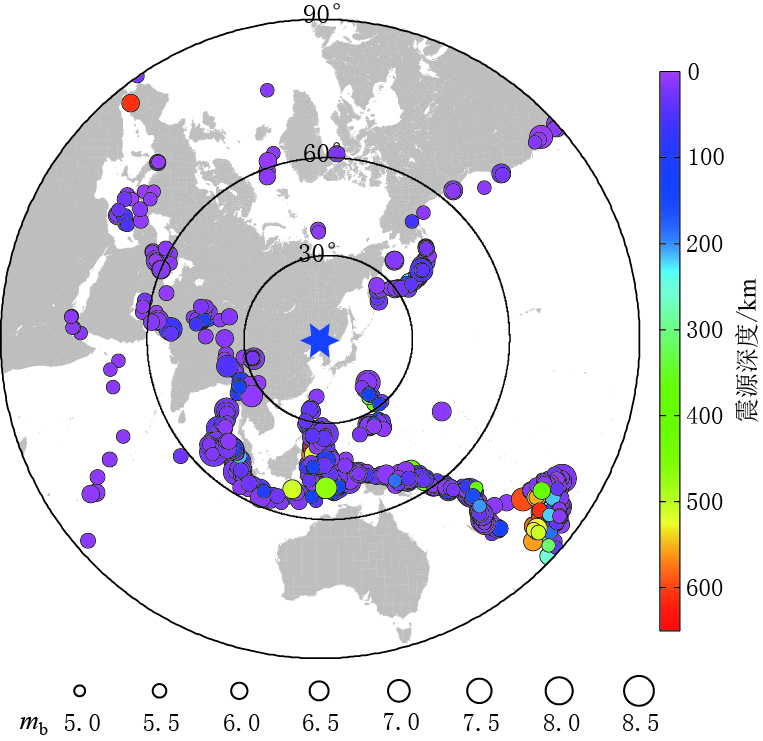
图 1 本文所用地震台站及剖面位置分布示意图
黑色三角形为本文中所使用的固定台站; 4条红色直线为共转换点(common converted point,简写为CCP)剖面,青色倒三角形为其中心位置;红色三角形为长白山火山; 十字形为P660s的穿透点位置; 白色虚线为俯冲板块等深线(引自Gudmundsson, Sambrige,1988)
Figure 1. Distribution of the seismic stations and locations of the profiles
Black triangles denote the permanent seismic stations used in this study.The red lines with its names on the side denote the locations of four CCP profiles and the cyan inverted triangles are their midpoints.The red triangle shows the location of the Changbaishan volcano.The crosses denote piercing pointsof P660s.The white dashed lines are the depth contours of the subduction slab (after Gudmundsson,Sambrige,1988)
![]()
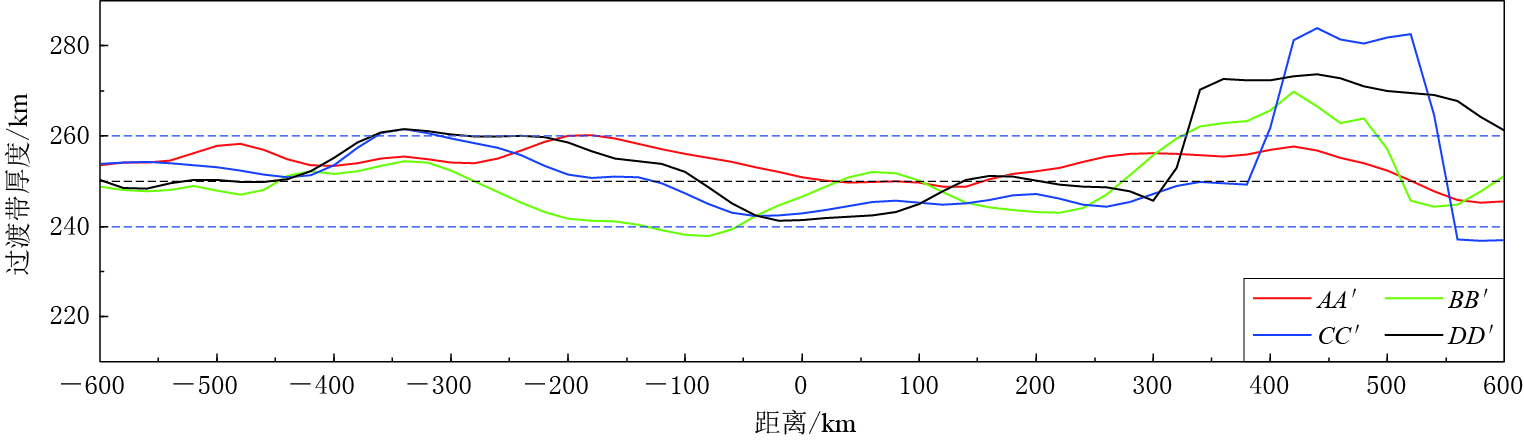
图 3 CCP叠加剖面图
红色倒三角形表示分布在距剖面30 km范围内的地震台站;黑点表示发生在剖面两侧各50 km范围内的深震事件位置
Figure 3. Common conversion point images for the four CCP profiles
The red inverted triangles show the stations within 30 km away from the profile.The horizontal direction denotes distance along profile with its midpoint as 0 km,and the vertical direction denotes depth in the profile.The black dots denote the deep seismic events located 50 km away from the profile; the depths of 410 km and 660 km are indicated as two dashed lines,respectively
-
张瑞青. 2010. 基于三重震相研究青藏高原和西北太平洋俯冲带上地幔过渡带速度结构[D]. 北京: 中国地震局地球物理研究所: 70. Zhang R Q. 2010. Seismic Velocity Models in the Transition Zone Beneath Tibet and Northeast Pacific Subduction Zone by Triplicate Waveform[D]. Beijing: Institute of Geophysics, China Earthquake Administration: 70 (in Chinese).
Elsasser W M. 1967. Convection and stress propagation in the upper mantle[G]//Runcorn S K eds. Hoboken, New York: Wiley-Sons: 223-246. The Application of Modern Physics to the Earth and Planetary Interiors
Yamanaka Y. 1993. Unified Model of the State of Stress in Subducting Slab[D]. Tokyo: University of Tokyo: 16-106.
 下载:
下载:


计量
- 文章访问数: 601
- HTML全文浏览量: 233
- PDF下载量: 25
