

Characteristics of P wave velocity structure changes before and after impoundment in Nuozhadu reservoir,Pu’er,Yunnan
-
摘要: 基于云南省糯扎渡水库台网17个台站所记录到的2009年11月至2014年9月期间的5 247次地震的P波绝对到时资料和相对到时资料,以及波形互相关得到的相对到时资料,采用双差地震层析成像方法联合反演了糯扎渡水库库区蓄水前和蓄水后2011年11月30日至2012年12月31日及2013年1月1日至2014年9月30日这3个阶段的震源参数和三维P波速度结构。结果显示:糯扎渡水库蓄水后,水库库区地震的发生频次增多,经重定位后的震源深度大多在10 km以内,尤其以5 km以内的居多,与前人得到的水库诱发地震震源深度小于10 km的结果基本吻合;随着蓄水量的增加,库水沿断层渗透,孔隙压力变化导致地震增多的区域延伸至左岸支库黑江和库区回水至库区中段的澜沧江段,并进一步向威远江和小黑江延伸,这些区域的P波速度降低;整体的水库渗水作用最大深度不超过7 km。Abstract: Using both absolute arrival time, relative arrival time and waveform correlation data of Nuozhadu reservoir earthquake events, we obtained seismic relocation and 3D P wave velocity structure of three periods by double-difference seismic tomography method. The results show that after the reservoir impoundment, a large number of earthquakes occurred at the reservoir area, and the aftershocks after relocation is mostly located at the depth within 10 km, especially in the range of less than 5 km, which is basically consistent with the previous result that the depth of reservoir-induced earthquake is less than 10 km. With the increase of water storage, the reservoir water penetrates along the fault, the pore pressure changes, which causes earthquakes-increased-area to extend to the Heihe river and the middle part of the Lancangjiang river, and further to the Weiyuanjiang and the Xiaoheijiang rivers. The P wave velocity in these regions is reduced. The maximum depth of the overall reservoir seepage is less than 7 km.
-
陈章立. 2018. 中国地震局水库地震监测预测及研究会议(贵阳)报告.
-
![]()
图 1 研究区域地质构造、所用台站及网格节点划分分布图
F1:南汀河断裂;F2:汗母坝断裂;F3:澜沧江断裂;F4:谦六断裂;F5:平掌寨断裂;F6:白马山断裂;F7:酒房断裂;F8:李子箐断裂;F9:麻栗坪断裂;F10:肖塘断裂;F11:帮东断裂;F12:无量山断裂;F13:把边江断裂;F14:阿墨江断裂;F15:木戛—谦迈断裂;F16:澜沧—勐遮断裂;F17:孟连断裂;F18:万达包断裂;F19:南麻断裂;F20:窝拖寨断裂
Figure 1. Geological tectonic settings,seismic stations used in this study and grid nodes division in the studied area
F1:Nantinghe fault;F2:Hanmuba fault;F3:Lancangjiang fault;F4:Qianliu fault;F5:Pingzhangzhai fault;F6:Baimashan fault;F7:Jiufang fault;F8:Liziqing fault;F9:Maliping fault;F10:Xiaotang fault;F11:Bangdong fault;F12:Wuliangshan fault;F13:Babianjiang fault;F14:Amojiang fault;F15:Muga-Qianmai fault;F16:Lancang-Mengzhe fault;F17:Menglian fault;F18:Wandabao fault;F19:Nanma fault;F20:Wotuozhai fault
![]()
图 4 蓄水前后3个时段P波二维射线分布图
(a) 蓄水前;(b) 蓄水后第一阶段;(c) 蓄水后第二阶段
Figure 4. Distribution of 2-D P wave ray paths for the three intervals
(a) Before the water storage in reservoir;(b) The first stage after water storage;(c) The second stage after water storage
![]()
图 5 蓄水前后3个时段不同模型下的观测走时与理论走时的均方根拟合差变化
(a) 蓄水前;(b) 蓄水后第一阶段;(c) 蓄水后第二阶段
Figure 5. The root-mean-square misfit improvement between observation travel times and theoretical ones based on 1D model (upper panels) and 3D model (lower panels)
(a) Before the water storage in reservoir;(b) The first stage after water storage;(c) The second stage after water storage
![]()
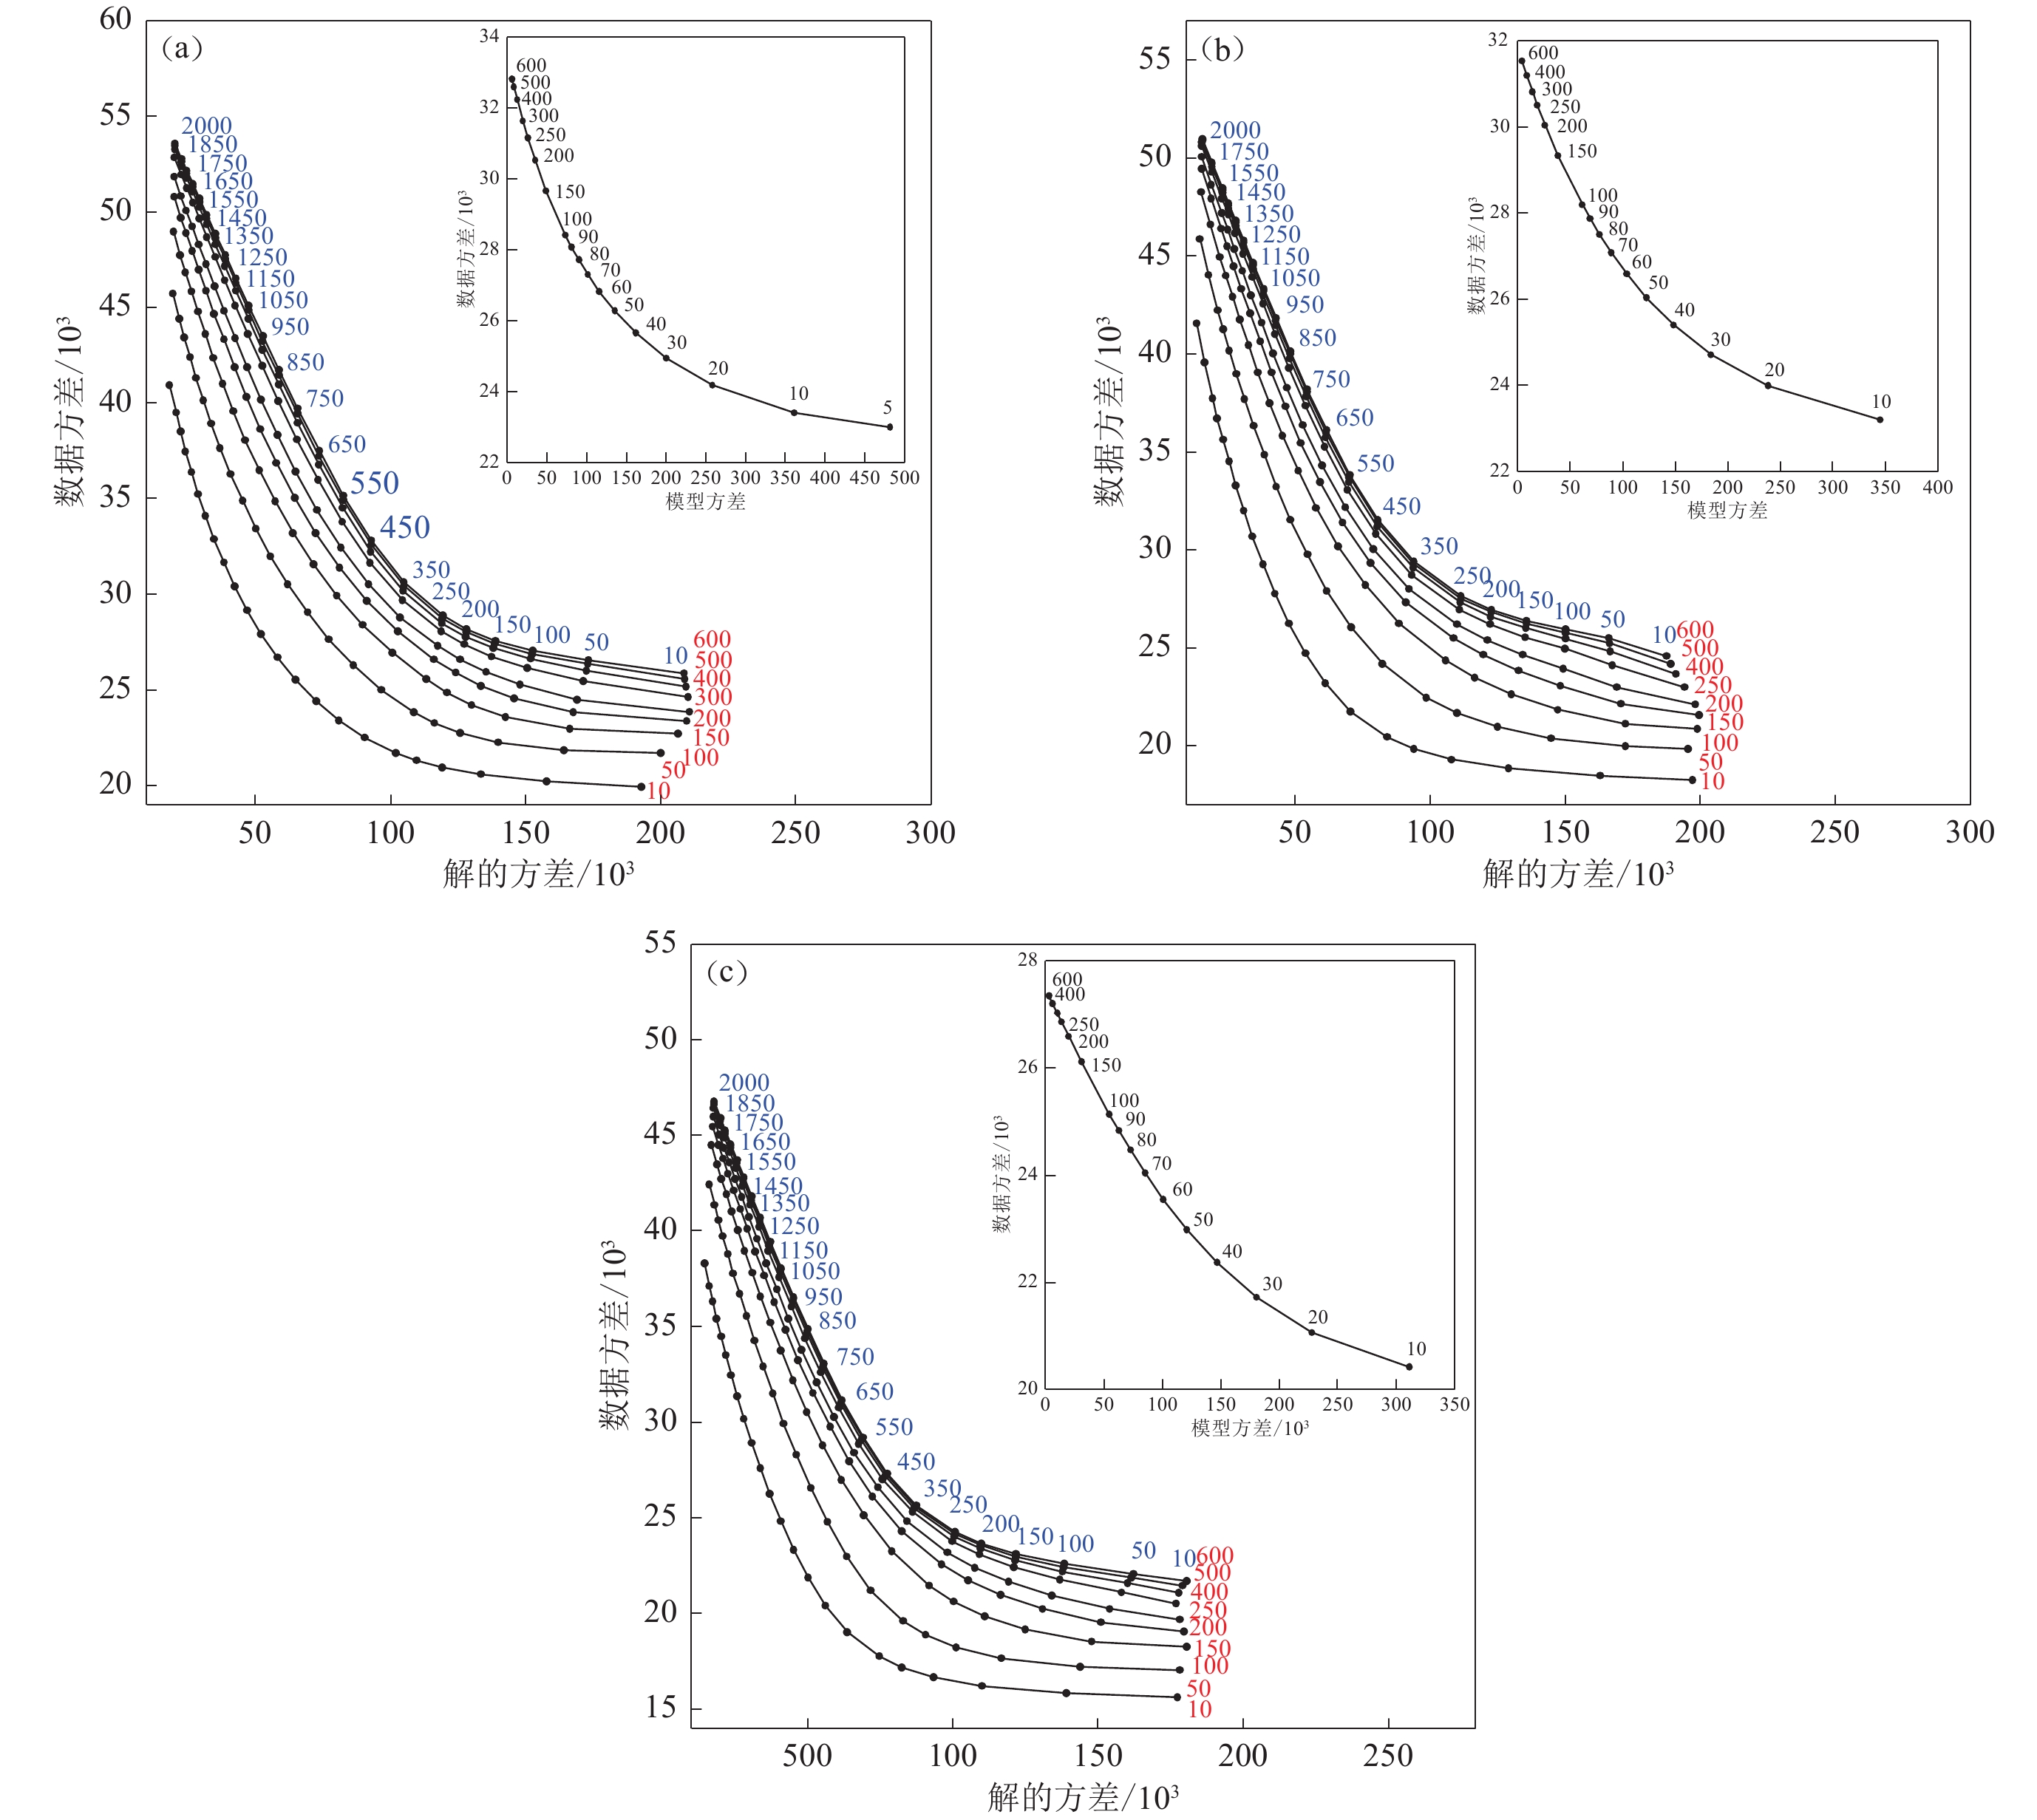
图 6 蓄水前后3个时段内不同平滑权重和不同阻尼参数的权重曲线
各子图分别为相应时段内,不同平滑权重(红色数字)和不同阻尼参数(蓝色数字)的解的方差和数据方差的均衡曲线。右上角小图分别为相应时段内,阻尼参数为450时,使用不同平滑权重参数得到的模型方差与数据方差的均衡曲线 (a) 蓄水前;(b) 蓄水后第一阶段;(c) 蓄水后第二阶段
Figure 6. Trade-off curves of smoothing weight parameters and damping parameters
The sub-figures are are trade-off curves of solution variance and data variance for different smoothing weight parameters (red numbers) and damping parameters (blue numbers)in corresponding intervals. The insets at the top-right corner are trade-off curve of slowness model variance and data variance for a set of smoothing weight parameters in the case of damping parameter 450 in corresponding intervals (a) Before the water storage in reservoir;(b) The first stage after water storage;(c) The second stage after water storage
![]()
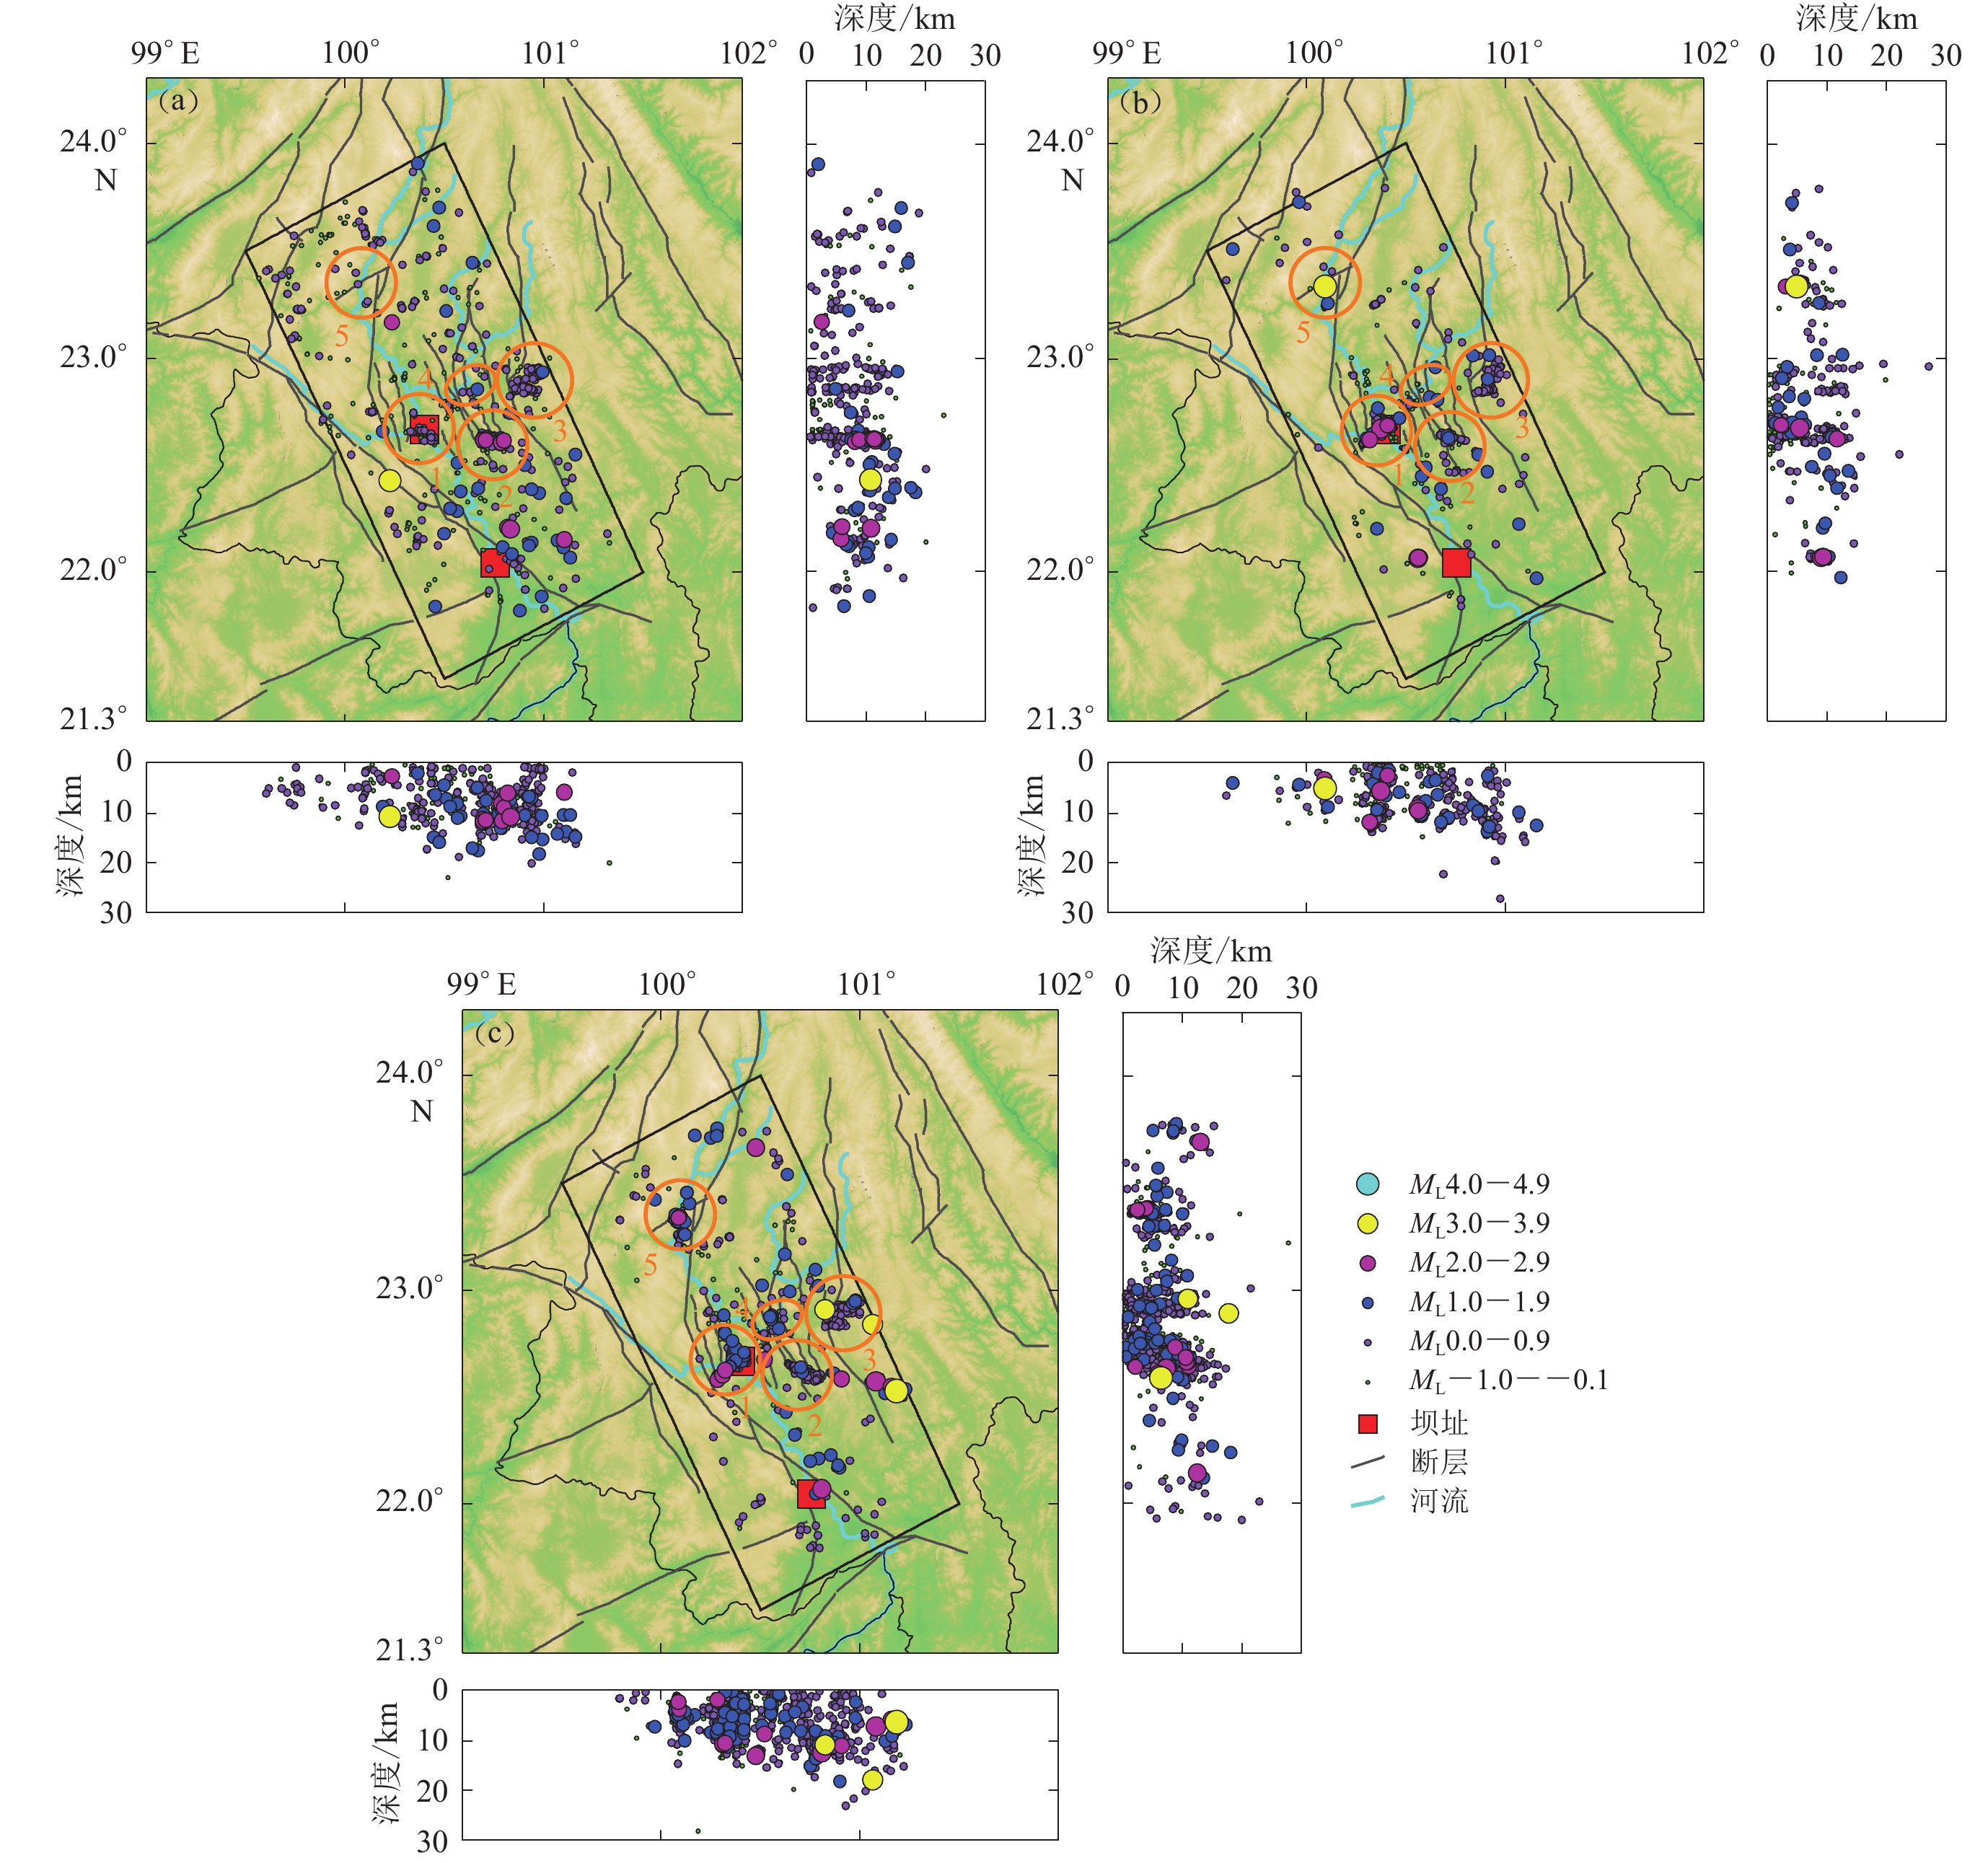
图 7 蓄水前后3个时段重定位后的地震分布图
(a) 蓄水前;(b) 蓄水后第一阶段;(c) 蓄水后第二阶段
Figure 7. Distribution of relocated events for the three intervals
(a) Before the water storage in reservoir;(b) The first stage after water storage;(c) The second stage after water storage
![]()
图 8 蓄水前后3个时段不同深度z处的P波速度棋盘测试结果
(a) 蓄水前;(b) 蓄水后第一阶段;(c) 蓄水后第二阶段
Figure 8. Checkboard resolution test of P wave velocity at different depth z for the three intervals
(a) Before the water storage in reservoir;(b) The first stage after water storage;(c) The second stage after water storage
![]()
图 9 蓄水前后3个时段不同深度z的P波速度和地震分布
(a) 蓄水前;(b) 蓄水后第一阶段;(c) 蓄水后第二阶段
Figure 9. Distribution of P-wave velocity and earthquakes at different depths z for the three intervals
(a) Before the water storage in reservoir;(b) The first stage after water storage;(c) The second stage after water storage
![]()
图 10 不同时段不同深度z的P波速度差变化
(a) 蓄水后第一阶段的P波速度减去蓄水前的P波速度;(b) 蓄水后第二阶段的P波速度减去第一阶段的P波速度
Figure 10. The P-wave velocity difference at different depth z for different intervals
(a) The P-wave velocity difference between intervals 2 and 1;(b) The P-wave velocity different between ntervals 3 and 2
![]()
图 11 蓄水前后3个时段的P波速度沿垂直剖面AA′,BB′,CC′,DD′的分布图(剖面位置见图1)
(a) 蓄水前;(b) 蓄水后第一阶段;(c) 蓄水后第二阶段
Figure 11. P-wave velocity distribution along the cross sections AA′,BB′,CC′,DD′ for the three intervals
(a) Before the water storage in reservoir;(b) The first stage after water storage;(c) The second stage after water storage
表 1 一维P波速度模型
Table 1 1-D P wave velocity model
深度/km vP/(km·s−1) 0 4.746 2 5.243 5 5.629 7 5.826 10 5.915 12 6.014 15 6.181 17 6.301 20 6.370 25 6.483 30 6.710  下载: 导出CSV
-
曹颖,徐彦,叶建庆,李丹宁. 2014. 澜沧江流域小湾、糯扎渡水库台网震级完备性初探[J]. 地震研究,37(3):400–405. Cao Y,Xu Y,Ye J Q,Li D N. 2014. Preliminary study on completeness of magnitude for the Xiaowan and Nuozhadu Reservoir Seismic Networks in Lancang River basin[J]. Journal of Seismological Research,37(3):400–405 (in Chinese).
曹颖,叶建庆,李丹宁,付虹,李涛,周青云. 2015. 云南省糯扎渡水库蓄水前后地震活动性研究[J]. 地震研究,38(2):189–195. Cao Y,Ye J Q,Li D N,Fu H,Li T,Zhou Q Y. 2015. Study of seismicity in Nuozhadu Reservoir area before and after the water storage[J]. Journal of Seismological Research,38(2):189–195 (in Chinese).
陈飞. 2017. 利用面波与重力的联合反演确定中国大陆三维岩石圈速度结构[D]. 合肥: 中国科学技术大学: 30–38. Chen F. 2017. Lithospheric Shear Wave Tomography of Continental China by Joint Inversion of Surface-Wave and Satellite Gra-vity Data[D]. Hefei: University of Science and Technology of China: 30–38 (in Chinese).
邓文泽,陈九辉,郭飚,刘启元,李顺成,李昱,尹昕忠,齐少华. 2014. 龙门山断裂带精细速度结构的双差层析成像研究[J]. 地球物理学报,57(4):1101–1110. Deng W Z,Chen J H,Guo B,Liu Q Y,Li S C,Li Y,Yin X Z,Qi S H. 2014. Fine velocity structure of the Longmenshan fault zone by double-difference tomography[J]. Chinese Journal of Geophysics,57(4):1101–1110 (in Chinese).
郭贵安,冯锐. 1992. 新丰江水库三维速度结构和震源参数的联合反演[J]. 地球物理学报,35(3):331–342. doi: 10.3321/j.issn:0001-5733.1992.03.007 Guo G A,Feng R. 1992. The joint inversion of 3-D velocity structure and source parameters in Xinfengjiang reservoir[J]. Chinese Journal of Geophysics,35(3):331–342 (in Chinese).
李海鸥,徐锡伟,马文涛. 2011. 天祝—古浪地区双差地震层析成像与古浪地震构造探讨[J]. 地震学报,33(2):156–164. doi: 10.3969/j.issn.0253-3782.2011.02.004 Li H O,Xu X W,Ma W T. 2011. Double-difference tomography in Tianzhu-Gulang region and discussion on seismotectonics of 1927 Gulang M8.0 earthquake[J]. Acta Seismologica Sinica,33(2):156–164 (in Chinese).
吕子强,郑建常,张刚,张书建,于澄,颜启. 2016. 濮阳地震集中区双差层析成像研究[J]. 地震研究,39(2):255–260. doi: 10.3969/j.issn.1000-0666.2016.02.011 Lü Z Q,Zheng J C,Zhang G,Zhang S J,Yu C,Yan Q. 2016. Research on velocity structure in Puyang clustered earthquakes area by double-difference tomography[J]. Journal of Seismological Research,39(2):255–260 (in Chinese).
孟令飞. 2016. 云南糯扎渡水库蓄水前后地震活动和剪切波分裂研究[D]. 昆明: 云南大学: 34–73. Meng L F. 2016. Seismic Activity and Shear-Wave Splitting Before and After Impoundment in Nuozhadu Reservoir[D]. Kunming: Yunnan University: 34–73 (in Chinese).
王亮,周龙泉,黄金水,焦明若,梁一婧,杨牧萍. 2015. 紫坪铺水库地区震源位置和速度结构的联合反演[J]. 地震地质,37(3):748–764. doi: 10.3969/j.issn.0253-4967.2015.03.007 Wang L,Zhou L Q,Huang J S,Jiao M R,Liang Y J,Yang M P. 2015. Simultaneous inversion of earthquake hypocenters and velocity structure in Zipingpu reservoir area[J]. Seismology and Geology,37(3):748–764 (in Chinese).
王小娜,于湘伟,章文波. 2015. 芦山震区地壳三维P波速度精细结构及地震重定位研究[J]. 地球物理学报,58(4):1179–1193. Wang X N,Yu X W,Zhang W B. 2015. 3D P-wave velocity structure of the crust and relocation of earthquakes in the Lushan source area[J]. Chinese Journal of Geophysics,58(4):1179–1193 (in Chinese).
魏植生. 1993. 糯扎渡水电站水库诱发地震预测[J]. 云南水电技术,(1):33–40. Wei Z S. 1993. Reservoir induced earthquake prediction of Nuozhadu hydropower station[J]. Yunnan Hydropower Technology,(1):33–40 (in Chinese).
夏磊,木永军. 2014. 糯扎渡电站蓄水初期地震活动研究[J]. 华东科技,(1):9–10. doi: 10.3969/j.issn.1006-8465.2014.07.003 Xia L,Mu Y J. 2014. Study on seismic activity at the initial stage of water storage in Nuozhadu hydropower station[J]. East China Science &Technology,(1):9–10 (in Chinese).
叶秀薇,黄元敏,刘吉平. 2016. 新丰江地区地壳P波三维速度结构及活动构造研究[J]. 中国地震,32(3):465–476. doi: 10.3969/j.issn.1001-4683.2016.03.003 Ye X W,Huang Y M,Liu J P. 2016. 3D P-wave velocity structure and active tectonics in the Xinfengjiang area of Guang-dong[J]. Earthquake Research in China,32(3):465–476 (in Chinese).
于湘伟,陈运泰,张怀. 2010. 京津唐地区地壳三维P波速度结构与地震活动性分析[J]. 地球物理学报,53(8):1817–1828. doi: 10.3969/j.issn.0001-5733.2010.08.007 Yu X W,Chen Y T,Zhang H. 2010. Three-dimensional crustal P-wave velocity structure and seismicity analysis in Beijing-Tianjin-Tangshan region[J]. Chinese Journal of Geophysics,53(8):1817–1828 (in Chinese).
钟羽云,张震峰,阚宝祥. 2010. 温州珊溪水库地震重新定位与速度结构联合反演[J]. 中国地震,26(3):265–272. doi: 10.3969/j.issn.1001-4683.2010.03.002 ZhongY Y,Zhang Z F,Kan B X. 2010. Simultaneous inversion of earthquake relocation and velocity structure in the Shanxi-reservoir,Wenzhou[J]. Earthquake Research in China,26(3):265–272 (in Chinese).
Du W X,Thurber C H,Eberhart-Phillips D. 2004. Earthquake relocation using cross-correlation time delay estimates verified with the bispectrum method[J]. Bull Seismol Soc Am,94(3):856–866. doi: 10.1785/0120030084
Okada T,Umino N,Matsuzawa T,Nakajima J,Uchida N,Nakayama T,Hirahara S,Sato T,Hori S,Kono T,Yabe Y,Ariyoshi K,Gamage S,Shimizu J,Suganomata J,Kita S,Yui S,Arao M,Hondo S,Mizukami T,Tsushima H,Yaginuma T,Hasegawa A,Asano Y,Zhang H J,Thurber C. 2005. Aftershock distribution and 3D seismic velocity structure in and around the focal area of the 2004 mid Niigata prefecture earthquake obtained by applying double-difference tomography to dense temporary seismic network data[J]. Earth Planets Space,57(5):435–440. doi: 10.1186/BF03351830
Pei S P,Su J R,Zhang H J,Sun Y S,Toksöz M N,Wang Z,Gao X,Jing L Z,He J K. 2010. Three-dimensional seismic velocity structure across the 2008 Wenchuan MS8.0 earthquake,Sichuan,China[J]. Tectonophysics,491(1/2/3/4):211–217.
Simpson D W. 1986. Annual review of earth and planetary sciences[J]. Triggered Earthquakes,14:21–42.
Thurber C H. 1992. Hypocenter-velocity structure coupling in local earthquake tomography[J]. Physics Earth Planet Interiors,75(1/2/3):55–62.
Thurber C H,Zhang H J,Brocher T,Langenheim V. 2009. Regional three-dimensional seismic velocity model of the crust and uppermost mantle of northern California[J]. J Geophy Res,114(B1):B01304.
Waldhauser F. 2001. HypoDD: A Program to Compute Double-Difference Hypocenter Locations: USGS Open-File Report[R]. Virginia: USGS: 01–113.
Waldhauser F,Ellsworth W L. 2000. A double-difference earthquake location algorithm:Method and application to the northern Hayward fault,California[J]. Bull Seismol Soc Am,90(6):1353–1368. doi: 10.1785/0120000006
Waldhauser F,Ellsworth W L. 2002. Fault structure and mechanics of the Hayward fault,California,from double-difference earthquake locations[J]. J Geophys Res,107(B3):2054. doi: 10.1029/2000JB000084
Zhang H J,Thurber C H. 2003. Double-difference tomography:The method and its application to the Hayward fault,California[J]. Bull Seismol Soc Am,93(5):1875–1889. doi: 10.1785/0120020190
Zhang H J,Thurber C H,Shelly D,Ide S,Beroza G C,Hasegawa A. 2004. High-resolution subducting-slab structure beneath northern Honshu,Japan,revealed by double-difference tomography[J]. Geology,32(4):361–364. doi: 10.1130/G20261.2
Zhang H J,Thurber C H. 2006. Development and applications of double-difference seismic tomography[J]. Pure Appl Geophys,163(2/3):373–403.
Zhang H J,Sarkar S,Toksöz M N,Kuleli H S,AI-Kindy F. 2009a. Passive seismic tomography using induced seismicity at a petroleum field in Oman[J]. Geophysics,74(6):WCB57–WCB69. doi: 10.1190/1.3253059
Zhang H J,Thurber C H,Bedrosian P. 2009b. Joint inversion for vP,vS,and vP/vS at SAFOD,Parkfield,California[J]. Geochem Geophy Geosyst,10(11):Q11002. doi: 10.1029/2009GC002709
-
期刊类型引用(2)
1. 朱涛,郭颖星. 上地幔剪切波各向异性约束下的中国大陆岩石圈底部的剪切拖曳力和应变率. 地球物理学报. 2021(08): 2684-2700 .  百度学术
百度学术
2. 曹付阳,杨树新,姚瑞. 地幔对流及其对岩石圈作用的研究进展. 科学技术与工程. 2020(14): 5443-5456 . 百度学术
其他类型引用(1)


计量
- 文章访问数: 1350
- HTML全文浏览量: 894
- PDF下载量: 62
- 被引次数: 3
