

A preliminary study on the characteristics and mechanism of the May 2021 MS6.4 Yangbi earthquake sequence,Yunnan,China
-
摘要: 2021年5月21日21时48分在滇西苍山西麓漾濞地区发生MS6.4 (MW6.1)强震,相关地震活动表现为一个典型的前震−主震−余震序列。本研究分别就该地震序列的构造背景、M1.0以上地震的双差定位、主要地震的矩张量反演和破裂传播方向、应力场反演及断层滑动趋势以及潮汐作用等方面进行了初步分析。矩张量反演结果表明,矩心深度为6.0 km。根据断层破裂传播方向分析结果及精定位余震分布判定,主震震源断层产状为走向137°,倾角75°,滑动角−167°,破裂沿南东向单侧扩展,右旋走滑含正断层分量。漾濞地震序列发生在红河断裂带北段延伸方向上的乔后—巍山断裂附近,但主震震源断层及主要余震的分布在走向和位置上均明显偏离已知的乔后—巍山断裂。地震序列受一个发育程度不高、含多级雁列构造的北西向为主、北东向为次的共轭走滑断层系统(本文称为“漾濞断层”)所控制,整体上沿北西向断层展布,主震与部分强余震为北西向断层活动所致,但中强前震和多数余震为北东向断层活动所致。中强震的断层破裂均为单侧扩展,北西向断层主要表现为南东向破裂扩展,而北东向断层沿两个方向破裂扩展,相邻地震还存在往返破裂现象。对截至5月23日所发生的M>4.0前震和余震进行了全矩张量反演。利用漾濞地震震中15 km范围内20多个MW>3.4余震的比较可靠的震源机制解反演了该区的应力场,结果显示:主应力形状比φ=(σ2-σ3)/(σ1-σ3)为0.46±0.17;最大主应力轴的方位角为188.0°±9.0°,倾伏角为12.4°±7.0°;中间主应力轴近直立,倾伏角为72.1°±11.3°;最小主应力轴的方位角为280.3°±7.0°,倾伏角为10.4°±12.0°。本文还对理论潮汐应变及应力进行了分析,结果表明,该地震序列受潮汐调制作用十分明显。5月18日18时及19日20时开始的两组前震群的首个主要地震以及5月21日晚发生的主震均发生在潮汐体应变和库仑应力的峰值附近,余震活动也与潮汐有明显的相关性。综合主要地震震源机制解、前震及余震分布、潮汐调制特征、基于应力场反演的断层滑动趋势分析以及滇西北地区以往类似地震活动研究结果,本文初步推断:漾濞地震受深部流体作用的影响明显,5月18日18时开始的第一次前震活动高潮从北西向断层的一个拉张性断层阶区开始,最大前震的震源断层为北东向断层,随后向北西方向迁移;19日20时开始的第二次前震活动高潮集中在主震震源附近。这些地震的触发及深部流体作用共同促进了北西向断层的活动,但主震的发生受深部流体作用为主。Abstract: The MS6.4 (MW6.1) earthquake occurred on May 21, 2021 in Yangbi county, Yunnan, China is the main shock of a typical foreshock-mainshock-aftershock sequence. This research carried out a preliminary study focusing on tectonic background, double-difference hypocenter location, moment tensor and rupture directivity of major earthquakes, stress field and fault slip-tendency, as well as tidal effect. According to the results of moment tensor inversion and rupture directivity of the main shock and the distribution of aftershocks, it is determined that the source faults of the main shock has strike 137°, dip 75°, rake −167°. The centroid depth of the main shock is 6.0 km, and the fault ruptured unilaterally toward the south-east direction, showing pure double-couple mechanism with dominant right-lateral strike-slip and minor normal components. Relocated hypocenters show that the Yangbi earthquake sequence is located near, but significantly departs from the well-known Qiaohou-Weishan fault in the northern segment of the Honghe fault zone, demonstrating an unmapped NW-trending strike-slip fault (we named “Yangbi fault” in this paper) with some small scale conjugate faults of NE-trending. The hypocenters are distributed along the NW-trending major fault, but also exhibit clusters along the NE-trending faults. The strongest foreshocks and most of the major aftershocks were caused by rupture of NE-trending source faults. All major earthquakes show a unilateral rupture directivity. We have obtained reliable mechanism solutions of more than 20 events with MW>3.4 in the focused area (within 15 km of the center of the Yangbi earthquake sequence), which enabled us to be able to invert the mean stress field in the area. The principal stress shape ratio φ=(σ2-σ3)/(σ1-σ3) is 0.46±0.17; the (azimuth, plunge) of the maximum, intermediate, and minimum principal stress axes are (188.0°±9.0°, 12.4°±7.0°), (50°±45°, 72.1°±11.3°), and (280.3°±7.0°, 10.4°±12.0°), respectively. Through theoretical tidal strain and stress analysis, it is found that this seismic sequence is significantly affected by tidal modulation. The first major earthquakes of the foreshock clusters that began at 18:00−20:00 on May 18 and 19 and the main shock occurred near the peaks of tidal volumetric strain and Coulomb failure stress. Based on the focal mechanism solutions of the main earthquakes, the distributions of foreshocks and aftershocks, the facts of tidal modulation, the rupture directivity of major earthquakes, fault slip-tendency analysis, and the results of previous studies on similar seismic activities in northwestern Yunnan, we preliminarily suggest that the Yangbi earthquake sequence is significantly affected by the action of deep fluids. The first foreshock activity climax at 18:00 on 18 May, in a tensile fault step (should be permeable channel) area of the NW-trending fault, likely initiated along NE-trending faults (greater slip-tendency) by deep overpressure fluid, and then migrated to the northwest. The second climax of foreshock activity that began at night on the 19 May was concentrated near the hypocenter of the main shock. The triggering of these foreshocks and the action of deep fluid jointly promoted the activity of the NW-trending fault (smaller slip-tendency), but the main shock was mainly promoted by the action of deep fluid.
-
引言
波动方程数值模拟是深入研究地震波传播规律的有效方法,而有限元法是模拟地震波在地球介质中传播最常用的方法之一,特别是对复杂介质进行数值模拟时.采用有限元法对连续介质进行空间离散会对地震波传播的数值解引入频散误差,这是因为用离散代替连续会引起精度上的误差,使得具有不同频率的地震波表现为不同的相速度,从而导致波场发生频散(董良国,李培明,2004),这类误差可以通过数值频散(网格频散)来描述.数值频散程度直接决定着地震波的数值模拟效果,因此压制数值频散对提高正演模拟精度具有非常重要的作用.为此,Mullen和Belytschko(1982)采用双线性四边形单元和线性三角形单元在网格布局、质量矩阵等方面对二维声波方程的频散问题进行研究,得出了矩形网格比三角形网格具有更高精度的结论;Abboud和Pinsky(1992)对三维声波方程有限元法数值频散进行相应研究,得到了最优网格离散的方法;Liu等(1994)分析了有限元不规则网格中波动的频散特性,结果显示当使用不恰当的单元时会导致相速度大于介质的真实速度; Christon(1999)研究了质量矩阵对频散的影响,并采用集中质量矩阵与一致质量矩阵的线性组合来压制数值频散;房营光和莫海鸿(2000)采用含有频率的高阶位移函数对有限元网格中波动的频散与稳定性条件进行了改进;De Basabe和Sen(2007)通过数值求解方法对高阶四边形谱元法进行了分析,并且证明高阶谱元法能够较好地压制数值频散;Seriani和Oliveira(2008)分析了弹性波谱元法数值模拟中的频散,结果表明高阶谱元法能够较好地压制数值频散;薛东川和王尚旭(2008)研究了一致质量矩阵和集中质量矩阵对数值频散的影响,并采用二者的组合形式来压制数值频散,最终得到当速度为2.5—4.0 km/s时最优组合系数为0.5.
在前人研究成果的基础上,本文将采用4节点四边形单元和集中质量矩阵得到二维声波方程的数值频散函数,以此来分析影响数值频散的因素,以期从理论和数值模拟实例上证明空间采样间隔、网格的纵横长度比、入射方向、地震波频率以及地层速度等因素对有限元法数值频散的影响,为提高声波方程有限元数值模拟精度及降低计算成本等提供参考.
1. 有限元算法频散的理论分析
1.1 集中质量矩阵双线性插值有限元算法声波方程数值模拟的频散函数
我们使用伽勒金(Galerkin)法求解二维标量波动方程,得到有限元方程组(杜世通,1982)为

式中,K e和Me分别为单元刚度矩阵和单元一致质量矩阵,ue为单元节点位移列向量.单元刚度矩阵和单元一致质量矩阵均为实对称且正定.计算出每一个单元的刚度矩阵和一致质量矩阵后,将其集成为总体的刚度矩阵 K和一致质量矩阵 M,得到整体有限元方程组

其中 u 为所有节点位移列向量.采用4节点四边形单元时,相应的形函数为

一旦确定了形函数,式(1)中单元刚度矩阵和单元一致质量矩阵的表达式可变为

式中,c为介质的真实速度,N T=[N1,N2,N3,N4].
采用等参单元和高斯(Gauss)数值积分,单元刚度矩阵和单元一致质量矩阵可具体表示为(Mullen,Belytschko,1982;徐世浙,1994)

其中γ=Δz/Δx,Δx为横向采样间隔,Δz为纵向采样间隔.
在采用有限元算法进行地震波数值模拟时,为了避免矩阵求逆的大量运算,一般采用单元集中质量矩阵代替单元一致质量矩阵.单元集中质量矩阵表示为

如图1所示,节点(m,n)处的坐标为(m>Δx,nΔz).根据平面波理论得到该节点(m,n)处的位移值为(孙成禹,2007)

式中,A为振幅,k为波数,ω为角频率,θ为平面波传播方向与x轴的夹角.相速度cp为

采用单元集中质量矩阵,得到节点(m,n)处的位移与周围相关节点的位移关系(推导过程,详见附录)为

将式(9)代入式(11),得到

其中

再将式(10)代入式(12),得到

式(13)即为集中质量矩阵双线性插值有限元算法声波方程数值模拟的频散函数.利用该式可以对集中质量矩阵双线性插值有限元算法在地震波数值模拟中的频散特征进行分析.显然,对同一频率而言,若cp/c值远大于或远小于1,则会发生严重的频散,若cp/c值为1,则不存在频散.
1.2 网格纵横长度比及地震波传播方向对频散的影响
图2和图3分别给出了频散随平面波传播方向和网格纵横长度比γ的变化情况,且均假定kΔx=π/2.由图2和图3可见:① 当γ值小于或等于某一常数γ′时(图3中γ′约为0.4),随着θ的增加,频散逐渐减小;当γ值大于γ′时,随着θ的增加,频散先增加,后减小(图3);② 对同一入射角而言,单元网格纵横长度比越小,cp/c值越大,也就是说频散越弱;值得注意的是,当θ值为0°(即平面波沿水平方向传播)时,频散不随γ而改变(图3);③ 当单元网格纵横长度比值γ为1且θ为45°时,频散最为严重(图2);④ 减小γ值对压制大角度(波传播方向与x轴的夹角)传播的地震波的数值频散效果更为显著(图3);⑤ 采用集中质量矩阵进行地震波数值模拟时,相速度小于地层真实速度,即频散误差滞后于真实信号(图2,3);⑥ 在不同的传播方向上,相速度不相同(图2),这说明各向同性连续介质经离散化后会表现为频散各向异性,且其性质与单元尺寸的比值γ以及传播方向有关.
![]() 图 2 频散cp/c随平面波传播方向θ的变化Figure 2. Variation of dispersion cp/c with the propagation direction θ
图 2 频散cp/c随平面波传播方向θ的变化Figure 2. Variation of dispersion cp/c with the propagation direction θ![]() 图 3 频数cp/c随网格纵横长度比γ的变化Figure 3. Variation of dispersion cp/c with the ratio of vertical to horizontal γ
图 3 频数cp/c随网格纵横长度比γ的变化Figure 3. Variation of dispersion cp/c with the ratio of vertical to horizontal γ根据上述分析可知,减小网格的纵横长度比可以减弱数值频散,然而对于传播方向不同的地震波,其减弱程度是不一样的.
1.3 空间采样间隔对频散的影响
取奈奎斯特(Nyquist)频率时,kΔx的值等于π,因此当我们计算cp/c时,kΔx的取值范围为0—π(Liu,Sen,2009).
图4给出了θ取不同值时,cp/c随kΔx的变化情况.可以看出:① 频散随kΔx 的增加而增强,即网格越大,频散越严重;② 当kΔx≤0.333时,cp/c值大于0.995,此时可以忽略频散误差. 换言之,若要有效地压制数值频散,单元网格的最大边长应小于或等于λ/20(λ为震源峰值频率所对应的波长);③ 当kΔx值接近于0时,cp/c值接近于1,此时频散几乎不受波传播方向及单元网格纵横长度比的影响;④ 由图2可看出,在γ=1的情况下,当0°≤θ≤45°时,频散随θ值的增加而增强,当45°<θ≤90°时,频散随θ值的增加而减弱. 其中当θ=45°时,频散最为严重,并且频散以θ=45°为对称.因此,对于同一kΔx而言,θ取45°时数值频散最严重,然后依次为30°、20°、0°.由于其对称性,θ=30°与θ=60°以及θ=0°与θ=90°对应的曲线重合;⑤ 当γ=0.4时,频散随θ值的增加而减弱(图3),出现图4b所示结果. 因此在采用集中质量矩阵双线性插值有限元算法进行地震波数值模拟时,根据所选震源子波的峰值频率以及地层的速度来确定单元网格的大小,可以有效地压制数值频散.
![]() 图 4 θ取不同值时cp/c随kΔx的变化(a)γ=1;(b)γ=0.4Figure 4. Variation of cp/c with kΔx for different values of θ(a)γ=1;(b)γ=0.4
图 4 θ取不同值时cp/c随kΔx的变化(a)γ=1;(b)γ=0.4Figure 4. Variation of cp/c with kΔx for different values of θ(a)γ=1;(b)γ=0.41.4 地震波频率对频散的影响
在实际介质中传播的地震波由不同频率分量组成,因此研究频率对地震波数值模拟频散的影响对提高地震波场正演模拟精度也具有指导意义.现假定地层的真实速度为2.0 km/s,单元网格纵横长度比为1,波传播方向与x轴的夹角为45°.将上述参数代入式(13)可以得到cp与ω的隐式关系.当分别采用1 m×1 m、2 m×2 m、3 m×3 m、5 m×5 m和10 m×10m的空间网格尺寸时,通过该隐式关系,得到cp与角频率ω的关系(图5).
![]() 图 5 地层真实速度为2.0 km/s时的相速度cp与角频率ω关系Figure 5. Relationship between phase velocity cp and angular frequency ω when the real formation velocity is 2.0 km/s
图 5 地层真实速度为2.0 km/s时的相速度cp与角频率ω关系Figure 5. Relationship between phase velocity cp and angular frequency ω when the real formation velocity is 2.0 km/s由图5可看出:① 随着频率的增加,相速度减小,数值频散增强,零频率分量的传播 速度等于地层真实速度;② 在同一频率下,网格越小,相应的数值频散越弱; ③ Δx=10m的曲线形态与其它曲线有所不同,这是由于当角频率增大到某一特定值后,曲线朝着频率减小的方向发生逆转,出现“假频”现象所致.对这一现象,本文在后面将给出具体分析.总之,在相同网格间距的情况下,地震波频率越高,相应的相速度越低,频散越严重.因此高频地震波的频散对数值模拟的精度有很大影响.
1.5 速度变化对频散的影响
以网格为5 m×5 m,平面波传播方向与x轴的夹角为90°,介质速度分别为0.5,1.0,1.5,2.0 km/s为例来研究介质速度对频散的影响.将k=ω/cp代入式(13),得到cp与ω频散关系,这是一个隐式函数,通过其可以求出各个频率对应的相速度cp(ω).当速度不同时,cp/c与ω之间的关系如图6所示.可以看出,随着角频率的增加,相速度降低.当频率增大到某一特定值后,曲线朝着频率减小的方向发生逆转,使低频成分由于折叠作用而发生畸变.图中发生逆转的那个点所对应的频率即为折叠频率.总之,在相同单元网格尺寸下,地层速度越小,数值频散程度就越大,且对应的折叠频率越小.大于折叠频率的频谱成分被折叠到低频成分之上,使原始频谱被彻底改造. 引起频谱发生畸变的那部分频率统称为假频.
![]() 图 6 不同介质速度时的cp/c与ω关系Figure 6. Variation of cp/c with ωfor different medium velocities
图 6 不同介质速度时的cp/c与ω关系Figure 6. Variation of cp/c with ωfor different medium velocities图7给出了不同频率分量的波长与角频率的关系.可见,随着角频率的增加,相应频率的波长减小.在波长为10m处,4条曲线均发生逆转,其所对应的频率即为折叠频率.根据奈奎斯特定理可知,不产生假频的条件是在一个波长的距离上至少采到2个样点(孙成禹等,2009). 由于我们使用的网格为5 m×5 m,因此不产生假频的必要条件是波长至少大于10 m.根据图6或图7,可以直接读出不同速度地层的折叠频率,其值与理论值相一致.
![]() 图 7 不同地层速度c时的不同频率分量波长与ω关系Figure 7. Variation of wavelength with ω for different real formation velocities
图 7 不同地层速度c时的不同频率分量波长与ω关系Figure 7. Variation of wavelength with ω for different real formation velocities2. 数值模拟结果分析
假设均匀介质模型的速度为2.0km/s,计算区域为2.1 km×2.1 km,基于此模型对上述定量分析结果进行验证.震源为40 Hz主频的雷克子波(发震时刻t0为10ms),位于模型中央,时间步长为0.2 ms. 从图8a-d中可以看到:网格越大,波前面的散开越明显,相应的数值频散越严重;网格越小,几乎只能看到一个波前面,则相应的数值频散现象越不明显.当采用3 m×3 m的网格(图8b)时,可以看到微弱的频散; 当采用2.5 m×2.5 m的网格(图8c)时,频散被有效地压制.在这个模型中,震源峰值频率对应的波长为50 m,所以当kΔx=0.333时,Δx的值约为2.5 m.该结果与上述分析结果一致.将图8a与图8e-h进行对比可看出,减小γ值可以显著地压制数值频散,其压制程度也与波的传播方向有关.
![]() 图 8 地震波在均匀介质中传播到0.46 s时的波场快照图(a)-(h)的网格依次为4m×4m、3m×3m、2.5m×2.5m、2m×2m、 4m×2m、4m×1.6m、4m×1m和4m×0.5mFigure 8. Snapshots of acoustic wave propagation in the homogeneous media at 0.46 sIn Figs.(a)-(h),the sizes of grid are 4m×4m,3m×3m,2.5m×2.5m,2m×2m,4m×2m,4m×1.6m,4m×1m,4m×0.5m,respectively
图 8 地震波在均匀介质中传播到0.46 s时的波场快照图(a)-(h)的网格依次为4m×4m、3m×3m、2.5m×2.5m、2m×2m、 4m×2m、4m×1.6m、4m×1m和4m×0.5mFigure 8. Snapshots of acoustic wave propagation in the homogeneous media at 0.46 sIn Figs.(a)-(h),the sizes of grid are 4m×4m,3m×3m,2.5m×2.5m,2m×2m,4m×2m,4m×1.6m,4m×1m,4m×0.5m,respectively现将震源的主频改为100 Hz,其它条件保持不变,得到网格依次为2 m×2 m和1 m× 1 m的波场快照,如图9所示.对比图9a与图8d的波场快照可见,增大震源主频会增强波场的数值频散,减小网格尺寸会减弱波场的数值频散.因此,在进行地震波传播数值模拟时,合理选取震源的主频和网格大小均可以提高数值模拟精度及计算效率.
![]() 图 9 震源主频为100 Hz时在0.46 s时的波场快照(a)网格为2 m×2 m;(b)网格为1 m×1 mFigure 9. Snapshots of acoustic wave propagation at 0.46 s when the peak frequency of source wavelet is 100 Hz(a)The size of grid is 2 m×2 m;(b)The size of grid is 1 m×1 m
图 9 震源主频为100 Hz时在0.46 s时的波场快照(a)网格为2 m×2 m;(b)网格为1 m×1 mFigure 9. Snapshots of acoustic wave propagation at 0.46 s when the peak frequency of source wavelet is 100 Hz(a)The size of grid is 2 m×2 m;(b)The size of grid is 1 m×1 m为了进一步验证有限元算法频散理论的准确性,我们又设计了含一低速夹层的介质模型.该模型宽度为1.8 km,纵深为1.8 km,薄层厚度为90 m,各层的速度由浅至深依次为2.0,1.2,2.5,3.0 km/s(图10).震源为40 Hz主频的雷克子波,位于(900 m,150 m)处,检波器与震源处于同一行,时间采样间隔为0.4 ms.分别采用3 m×3 m、3 m×1.5 m和1.5 m×1.5 m的网格进行数值模拟,得到如图11所示的单炮记录.
![]() 图 11 网格分别为3 m×3 m(a)、3 m×1.5 m(b)和1.5 m×1.5 m(c)情况下的单炮记录① 直达波; ② 薄层顶界面反射波; ③ 薄层底界面反射波; ④ 薄层内二次反射波; ⑤ 倾斜界面反射波Figure 11. Shot records with grid sizes of 3 m×3 m(a),3 m×1.5 m(b) and 1.5 m×1.5 m(c)① Direct wave; ② The reflection wave coming from the top of low velocity interlayer; ③ The reflection wave coming from the base of low velocity interlayer; ④ The re-reflection wave coming from low velocity interlayer; ⑤ The reflection wave coming from dipping interface
图 11 网格分别为3 m×3 m(a)、3 m×1.5 m(b)和1.5 m×1.5 m(c)情况下的单炮记录① 直达波; ② 薄层顶界面反射波; ③ 薄层底界面反射波; ④ 薄层内二次反射波; ⑤ 倾斜界面反射波Figure 11. Shot records with grid sizes of 3 m×3 m(a),3 m×1.5 m(b) and 1.5 m×1.5 m(c)① Direct wave; ② The reflection wave coming from the top of low velocity interlayer; ③ The reflection wave coming from the base of low velocity interlayer; ④ The re-reflection wave coming from low velocity interlayer; ⑤ The reflection wave coming from dipping interface对比图11中不同网格的单炮记录可见:当采用大网格时,由于低速层的影响(低速层内每个波长上的采样点过少),使得地震波经过低速层后出现严重的数值频散(如a图中③所示),并使低速层以下的高速层界面的反射波也出现严重的数值频散;减小单元网格的纵向长度,数值频散得到明显压制,特别是传播方向与x轴夹角较大的地震波的数值频散(如b图中方框所示部分),但由于单元网格横向尺寸过大,入射角(波传播方向与z轴的夹角)较大的地震波仍然会出现明显的数值频散;同时减小单元网格的纵向和横向尺寸,地震波传播的数值频散会得到较好的压制(c图).综上,在有限元法地震波数值模拟过程中,合理选取单元网格的横向和纵向尺寸,不仅可以保证数值模拟的精度,还可以提高计算效率.
3. 讨论与结论
采用集中质量矩阵双线性插值有限元算法对地震波进行数值模拟时,影响频散的因素主要有空间采样间隔、单元网格纵横长度比、传播方向、地震波频率及地层速度等.本文通过理论分析及数值模拟得到如下结论:
1)各向同性的连续介质经离散化后表现为频散各向异性,其性质与单元网格纵横长度的比值及传播方向有关.
2)为了有效地压制数值频散,震源子波主频对应的波长内所包含的采样点数目应不少于20个.
3)减小单元网格的纵横比,可在一定程度上压制数值频散,特别是对于入射角(波传播方向与z轴的夹角)较小的地震波,数值频散压制效果尤为明显.
4)在其它条件相同的情况下,地震波的频率越高,其数值频散越严重.因此,进行地震波数值模拟时,须根据实际情况合理选取震源子波的主频.
5)当模型含有低速地层时,如果按照高速地层的标准进行空间采样会导致严重的数值频散,因此合理选取单元网格的纵向和横向长度对提高正演模拟精度及减小计算量具有非常重要的作用.当地震波频率超过折叠频率后,会出现假频现象,这使得高于折叠频率的地震波成分与低频成分混合在一起,导致观测到的地震波的频谱被彻底改造.
本文的频散分析基于区域是均匀、无边界,且单元为周期单元的假设,但在实际地震波数值模拟中,为了较好地拟合起伏构造,一般采用不规则的四边形网格,因而只能通过本文已有的结论推测一般情况下频散的特征. 基于本文的核心思想,可以研究三角网格中波动的数值频散特性,以便进一步完善有限元法地震波数值模拟的理论基础.
附录
以节点J2为例,节点J2对应总体刚度矩阵的第J2行,该行的非零元素如下:

总体质量矩阵 M 的第J2行、第J2列为

式中,KI,J代表总体刚度矩阵的第I行、第J列,(Ke)ai,j代表第a个单元的刚度矩阵的第i行、第j列,质量矩阵的相关表达式类推.
图1中各个点的位移表达式与正文图1相对应,把正文式(2)进行第J2行的运算可以得到

![]() S1 共点单元示意图 带圈的数字为单元内编号,带下标大写字母为结构节点编号; a,b,c,d为单元编号S1. Scheme of common-point element The circled numbers are the code of nodes in an element,the capital letters subscripted is the number of the node. a,b,c,d are number of elements
S1 共点单元示意图 带圈的数字为单元内编号,带下标大写字母为结构节点编号; a,b,c,d为单元编号S1. Scheme of common-point element The circled numbers are the code of nodes in an element,the capital letters subscripted is the number of the node. a,b,c,d are number of elements将式(1)以及式(2)代入式(3)整理后即可得到正文中的式(11).
-
![]()
图 1 滇西红河断裂带北段及周边地形特征、活动断层、地震分布及地表水平运动的方向和速度
断层数据来源于中国活动构造图(邓起东等,2007)。蓝色箭头为GPS测点速度矢量(Wang,Shen,2020)。背景为地形阴影化GPS速度场,数字高程数据来源于SRTM3 (http://srtm.csi.cgiar.org/SRTM3)。地震目录数据引自国家地震科学数据中心(http://data.earthquake.cn)。左下子图为维西—乔后—巍山断裂两侧约100 km范围内的GPS速度v及其方位角Az的分布和统计结果,蓝色和红色箭头分别表示西侧和东侧的平均值。F1:维西—乔后—巍山断裂;F2:红河断裂带北段;F3:剑川—乔后断裂;F4:鹤庆—洱源断裂;F5:程海断裂
Figure 1. Topographic features,active faults,earthquake distribution,and GPS velocity field of the northern segment of the Honghe fault zone in western Yunnan and its surrounding regions
The fault data is modified from China Active Tectonic Map (Deng et al,2007). The GPS velocity vectors are shown by the blue arrows (Wang,Shen,2020). The background image shows distribution of GPS velocity field shaded by SRTM3 digital elevation (http://srtm.csi.cgiar.org/SRTM3). Earthquake catalog is provided by National Earthquake Data Center (http://data.earthquake.cn). The lower-left inset shows the distribution and statistical results of GPS velocity amplitude v and azimuth Az within a range of about 100 km and their mean values (arrows) on both sides of the Weixi-Qiaohou-Weishan fault. F1:Weixi-Qiaohou-Weishan fault;F2:The northern segment of Honghe fault zone;F3:Jianchuan-Qiaohou fault;F4:Heqing-Eryuan fault;F5:Chenghai fault
![]()
图 2 漾濞地震震中及周边地形特征、活动断层及地震分布
(a) 漾濞地震带谷歌地球俯视图,视线为正北向;(b) 漾濞地震带的分布,F1:乔后—巍山断裂;F2:红河断裂带北段;(c) 本研究应力场反演结果的主应力方向(详见图10);(d,e) 漾濞地震序列的精定位震中分布及推测断层
Figure 2. Topographic features of the epicenter of the Yangbi earthquake and its surroundings,and zoomed map view showing active faults and seismicity
(a) The bird eye view of Google Earth,seeing from south to north;(b) The distribution of Yangbi seismic zone where the hypocenter symbols are colored with the occurrence time. F1:Qiaohou-Weishan fault;F2:The northern segment of Honghe fault zone;(c) The directions of the principal stress axes estimated based on stress field inversion;(d,e) The relocated epicenters of the Yangbi earthquake asequence and seismicity-revealed faults
![]()
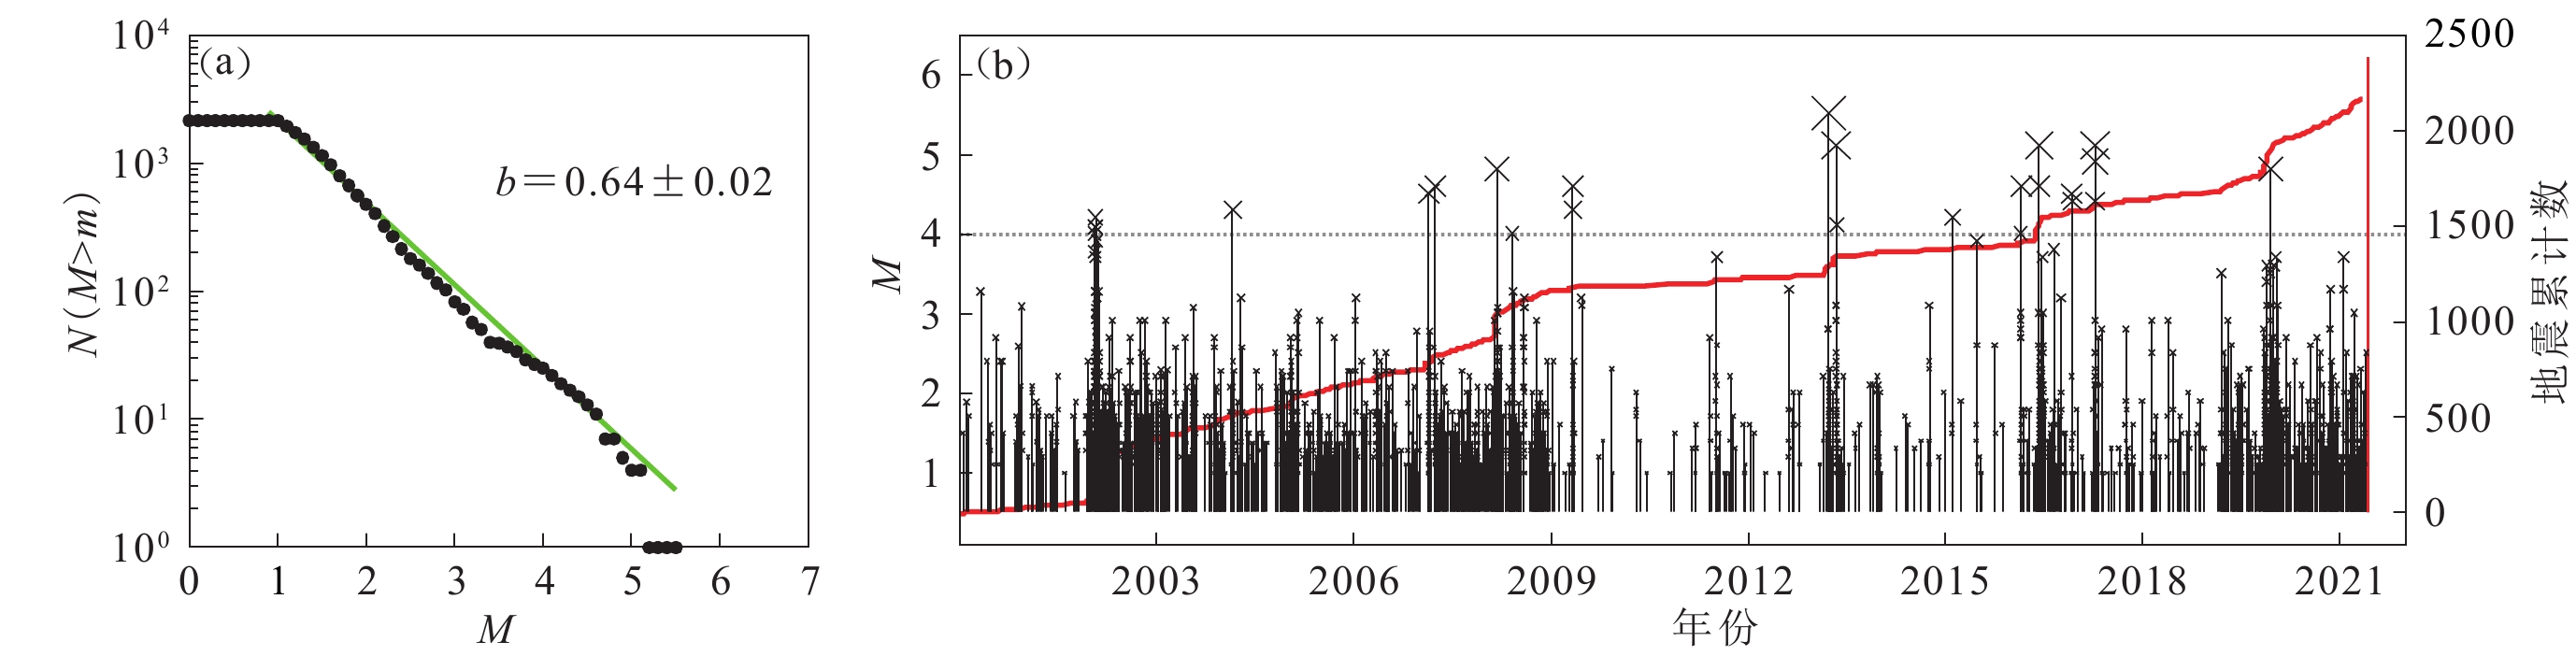
图 3 漾濞地震带及周围M2以上地震的震级-频度关系(a)及震级和累计数的时间分布(b)
Figure 3. Magnitude-frequency distribution and b-value (a) and temporal distribution of magnitude and cumulative number (b) in the Yangbi seismic belt and its surroundings
![]()
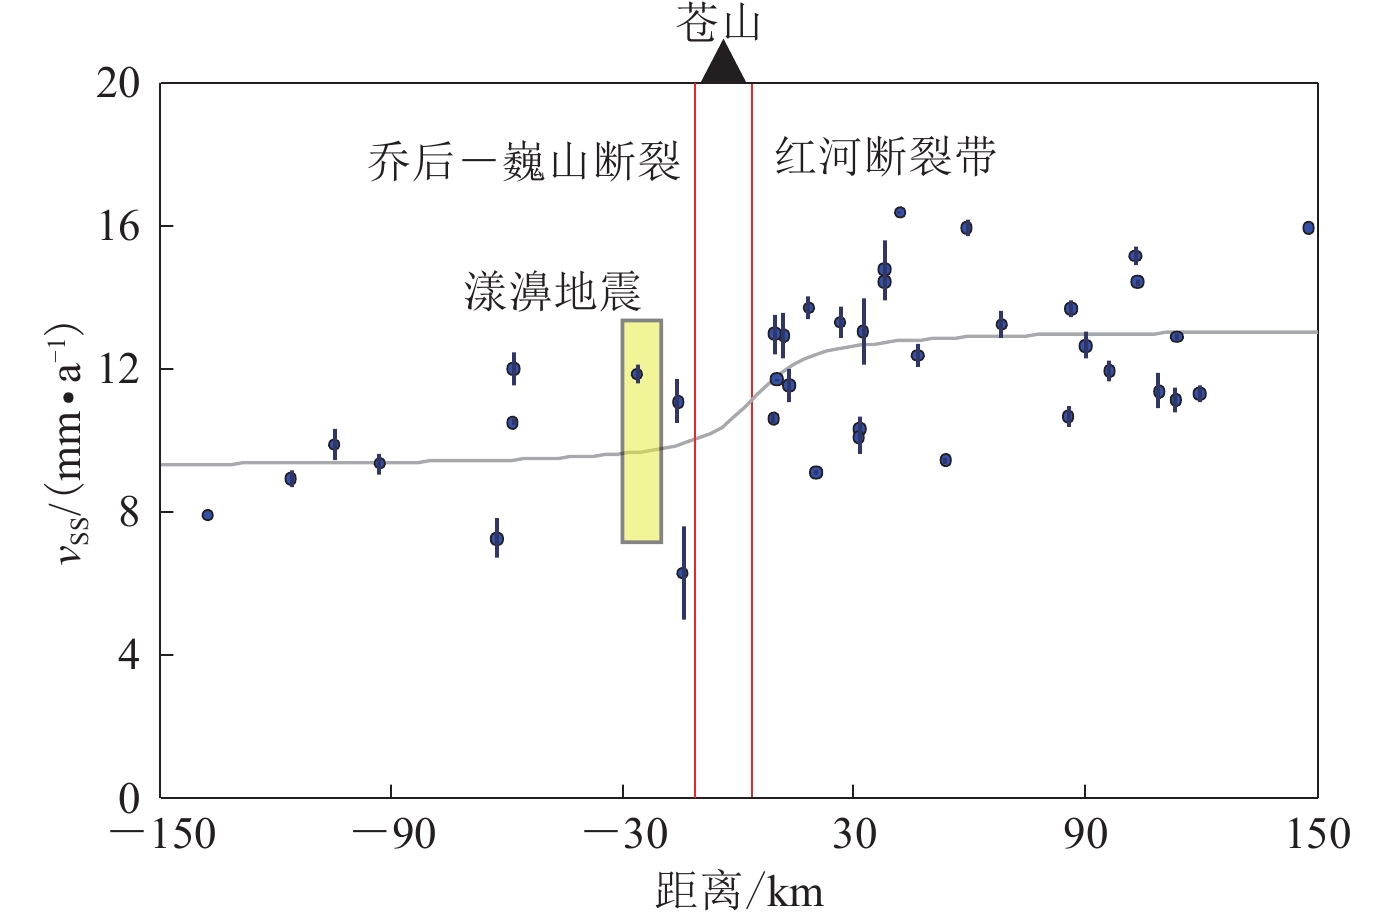
图 4 乔后—巍山断裂和红河断裂带的断层闭锁模型
蓝点及垂线表示GPS观测到的平行断层走向的速度分量vSS及其误差;灰色曲线表示最小二乘拟合曲线。最佳闭锁深度为5.23 km,但不确定性很大
Figure 4. Fault locking model of Qiaohou-Weishan fault and Honghe fault zone
Blue points and vertical lines represent observed fault-parallel velocity vSS and error derived from GPS monitoring. The gray curve denotes the least squares fitting curve. The estimated locking depth is 5.23 km,but the uncertainty is large
![]()
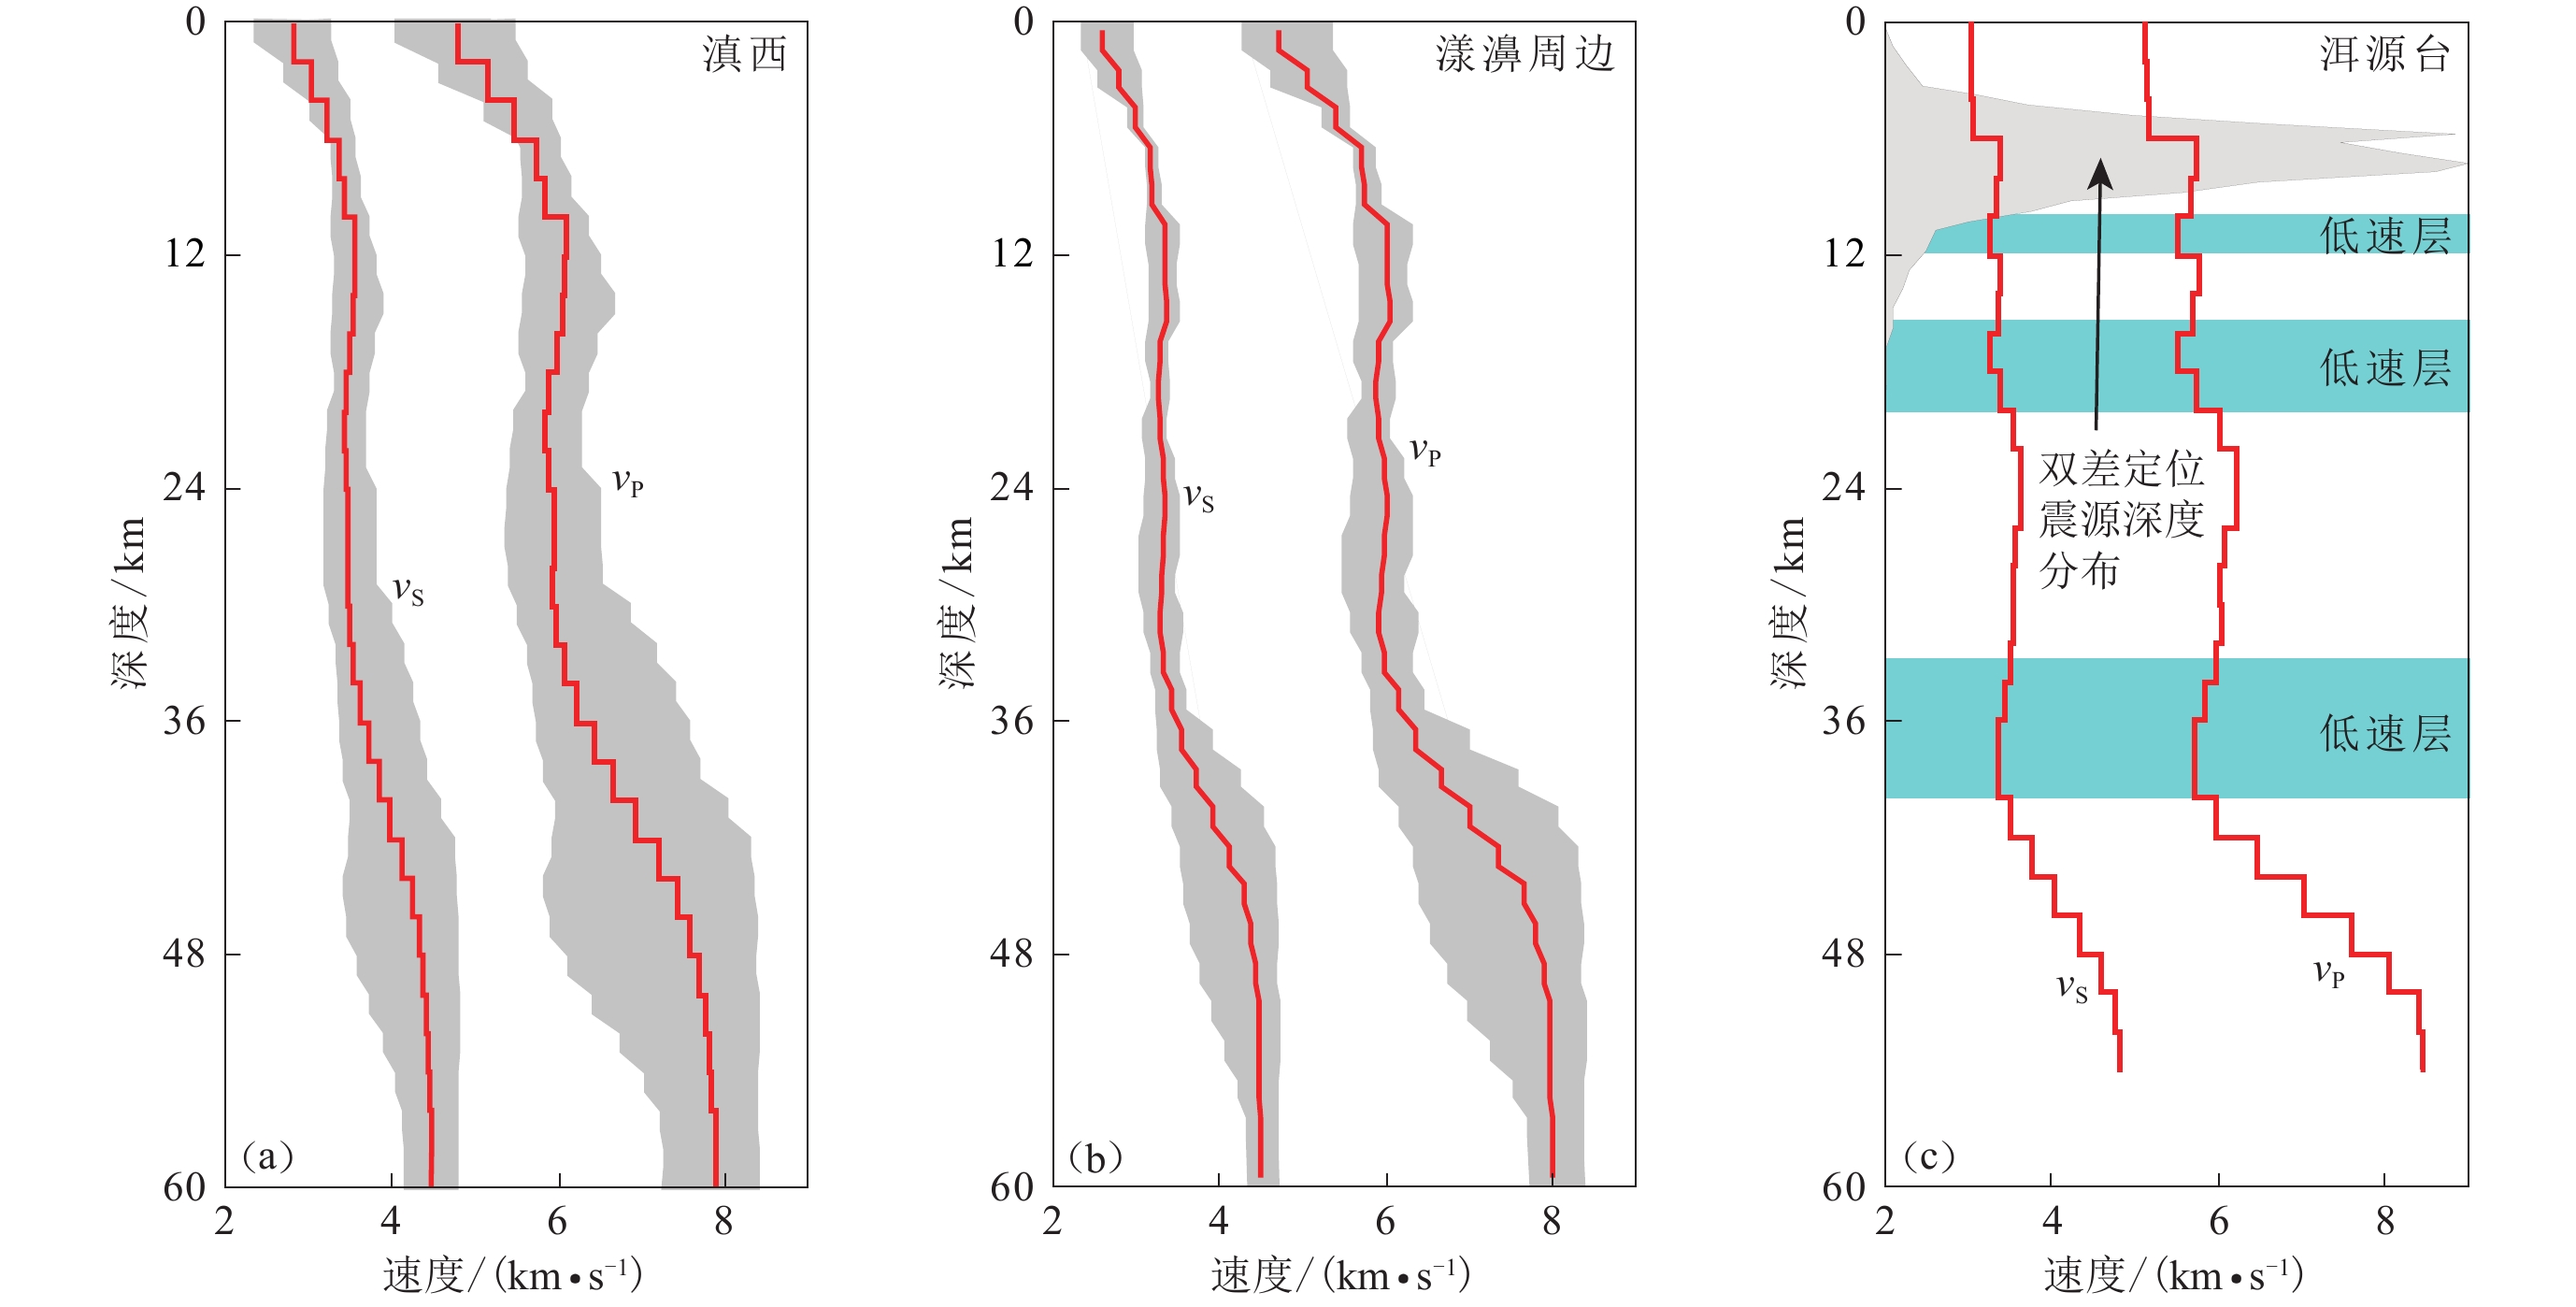
图 5 基于联合反演的三维P波速度(vP)数据(Yang et al,2020)建立的滇西地区(a)和漾濞周边区域(图1范围)(b)的平均一维速度模型以及洱源台的一维速度模型(Yang et al,2020)(c)
图(a)和(b)中,S波速度vS按vP/vS=1.73估算,阴影区域为速度变化范围;图(c)同时给出了漾濞地震序列M1.0以上地震精定位结果的归一化震源深度分布和可识别的三个低速层
Figure 5. Mean one-dimensional velocity models of the western Yunnan (a) and the small area centered at Yangbi (b) based P velocity (vP) data of joint inversion (Yang et al,2020) and the velocity model of Eryuan station (Yang et al,2020)(c)
In Figs. (a) and (b),the S velocity (vS) is estimated assuming vP/vS=1.73. The shaded area marks the velocity range. Fig. (c) gives the normalized focal depth distribution of the relocated earthquakes with M>1.0 in the Yangbi earthquake sequence,and the light green color marks recognizable low-velocity zones in the crust
![]()
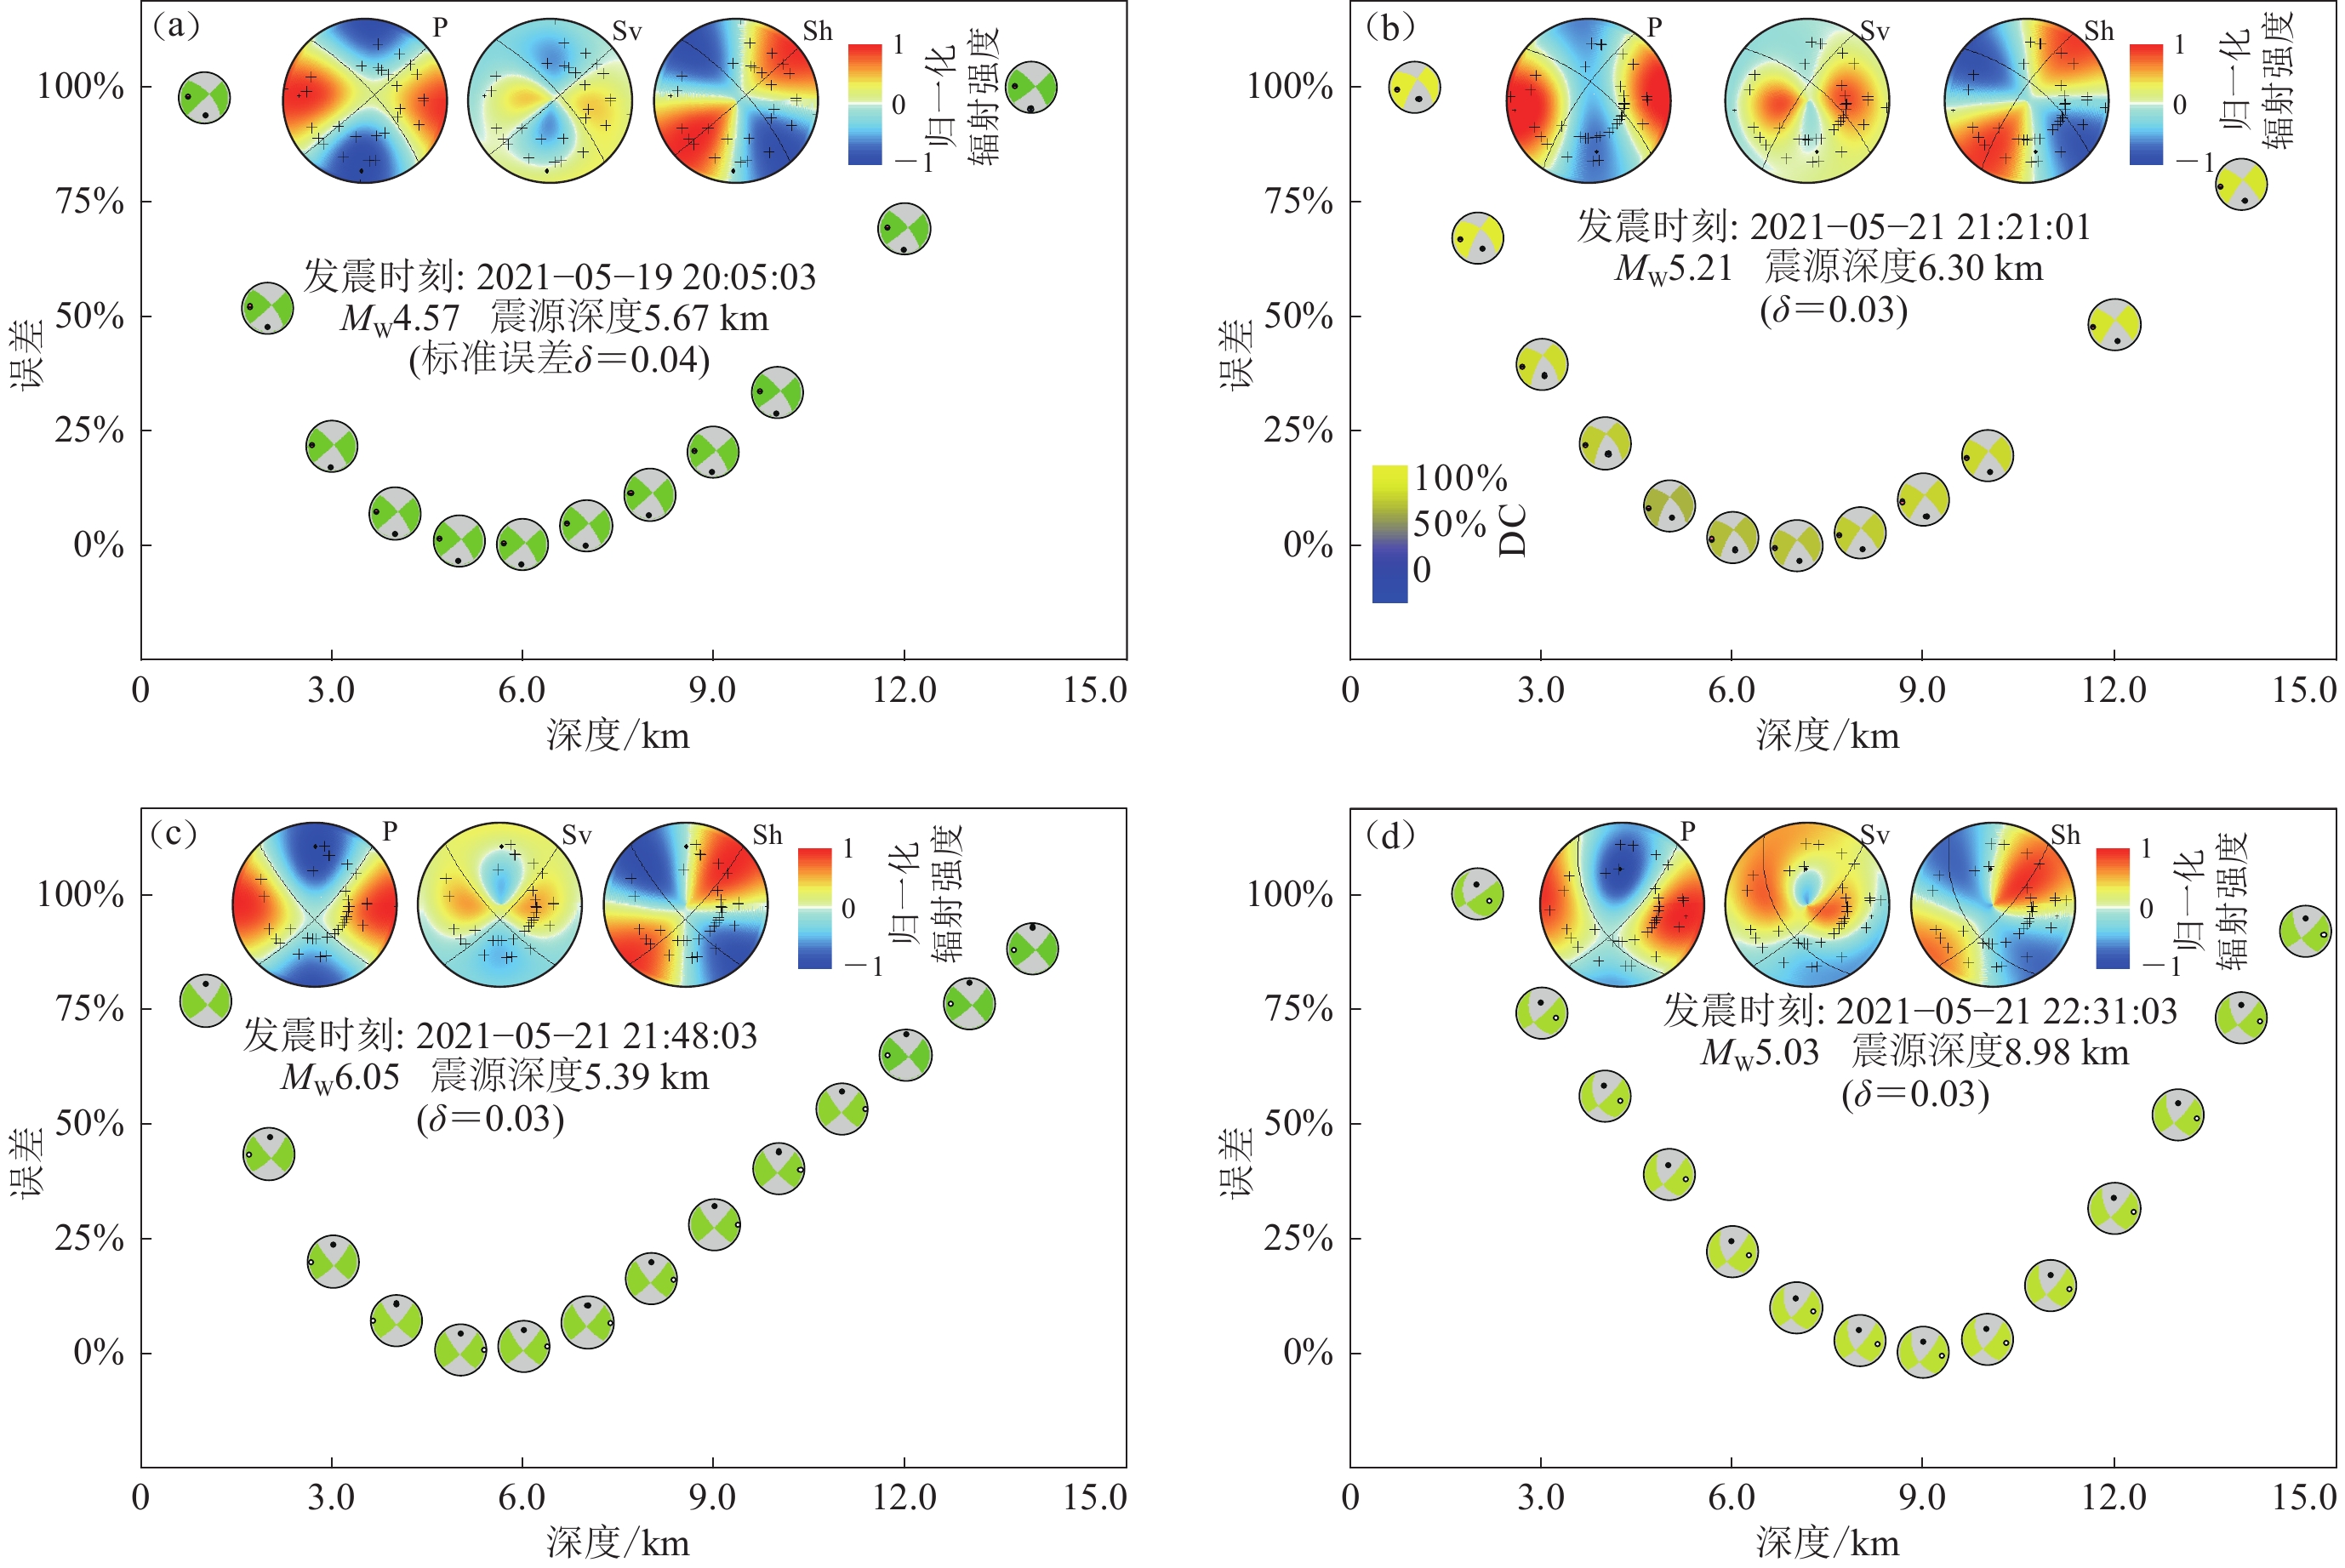
图 6 使用gCAP方法反演得到的漾濞地震的两个前震(a,b)、主震(c)及最大余震(d)的相对误差随假定震源深度的变化
Figure 6. Misfit error of moment tensor inversions by the gCAP method with respect to the assumed focal depth of two foreshocks (a,b),the main shock (c),and the largest aftershock (d)
The color scale in the large focal mechanisms indicates the P-wave radiation pattern. The mechanism solutions and radiation pattern are shown by lower-hemisphere projection of the focal sphere
![]()
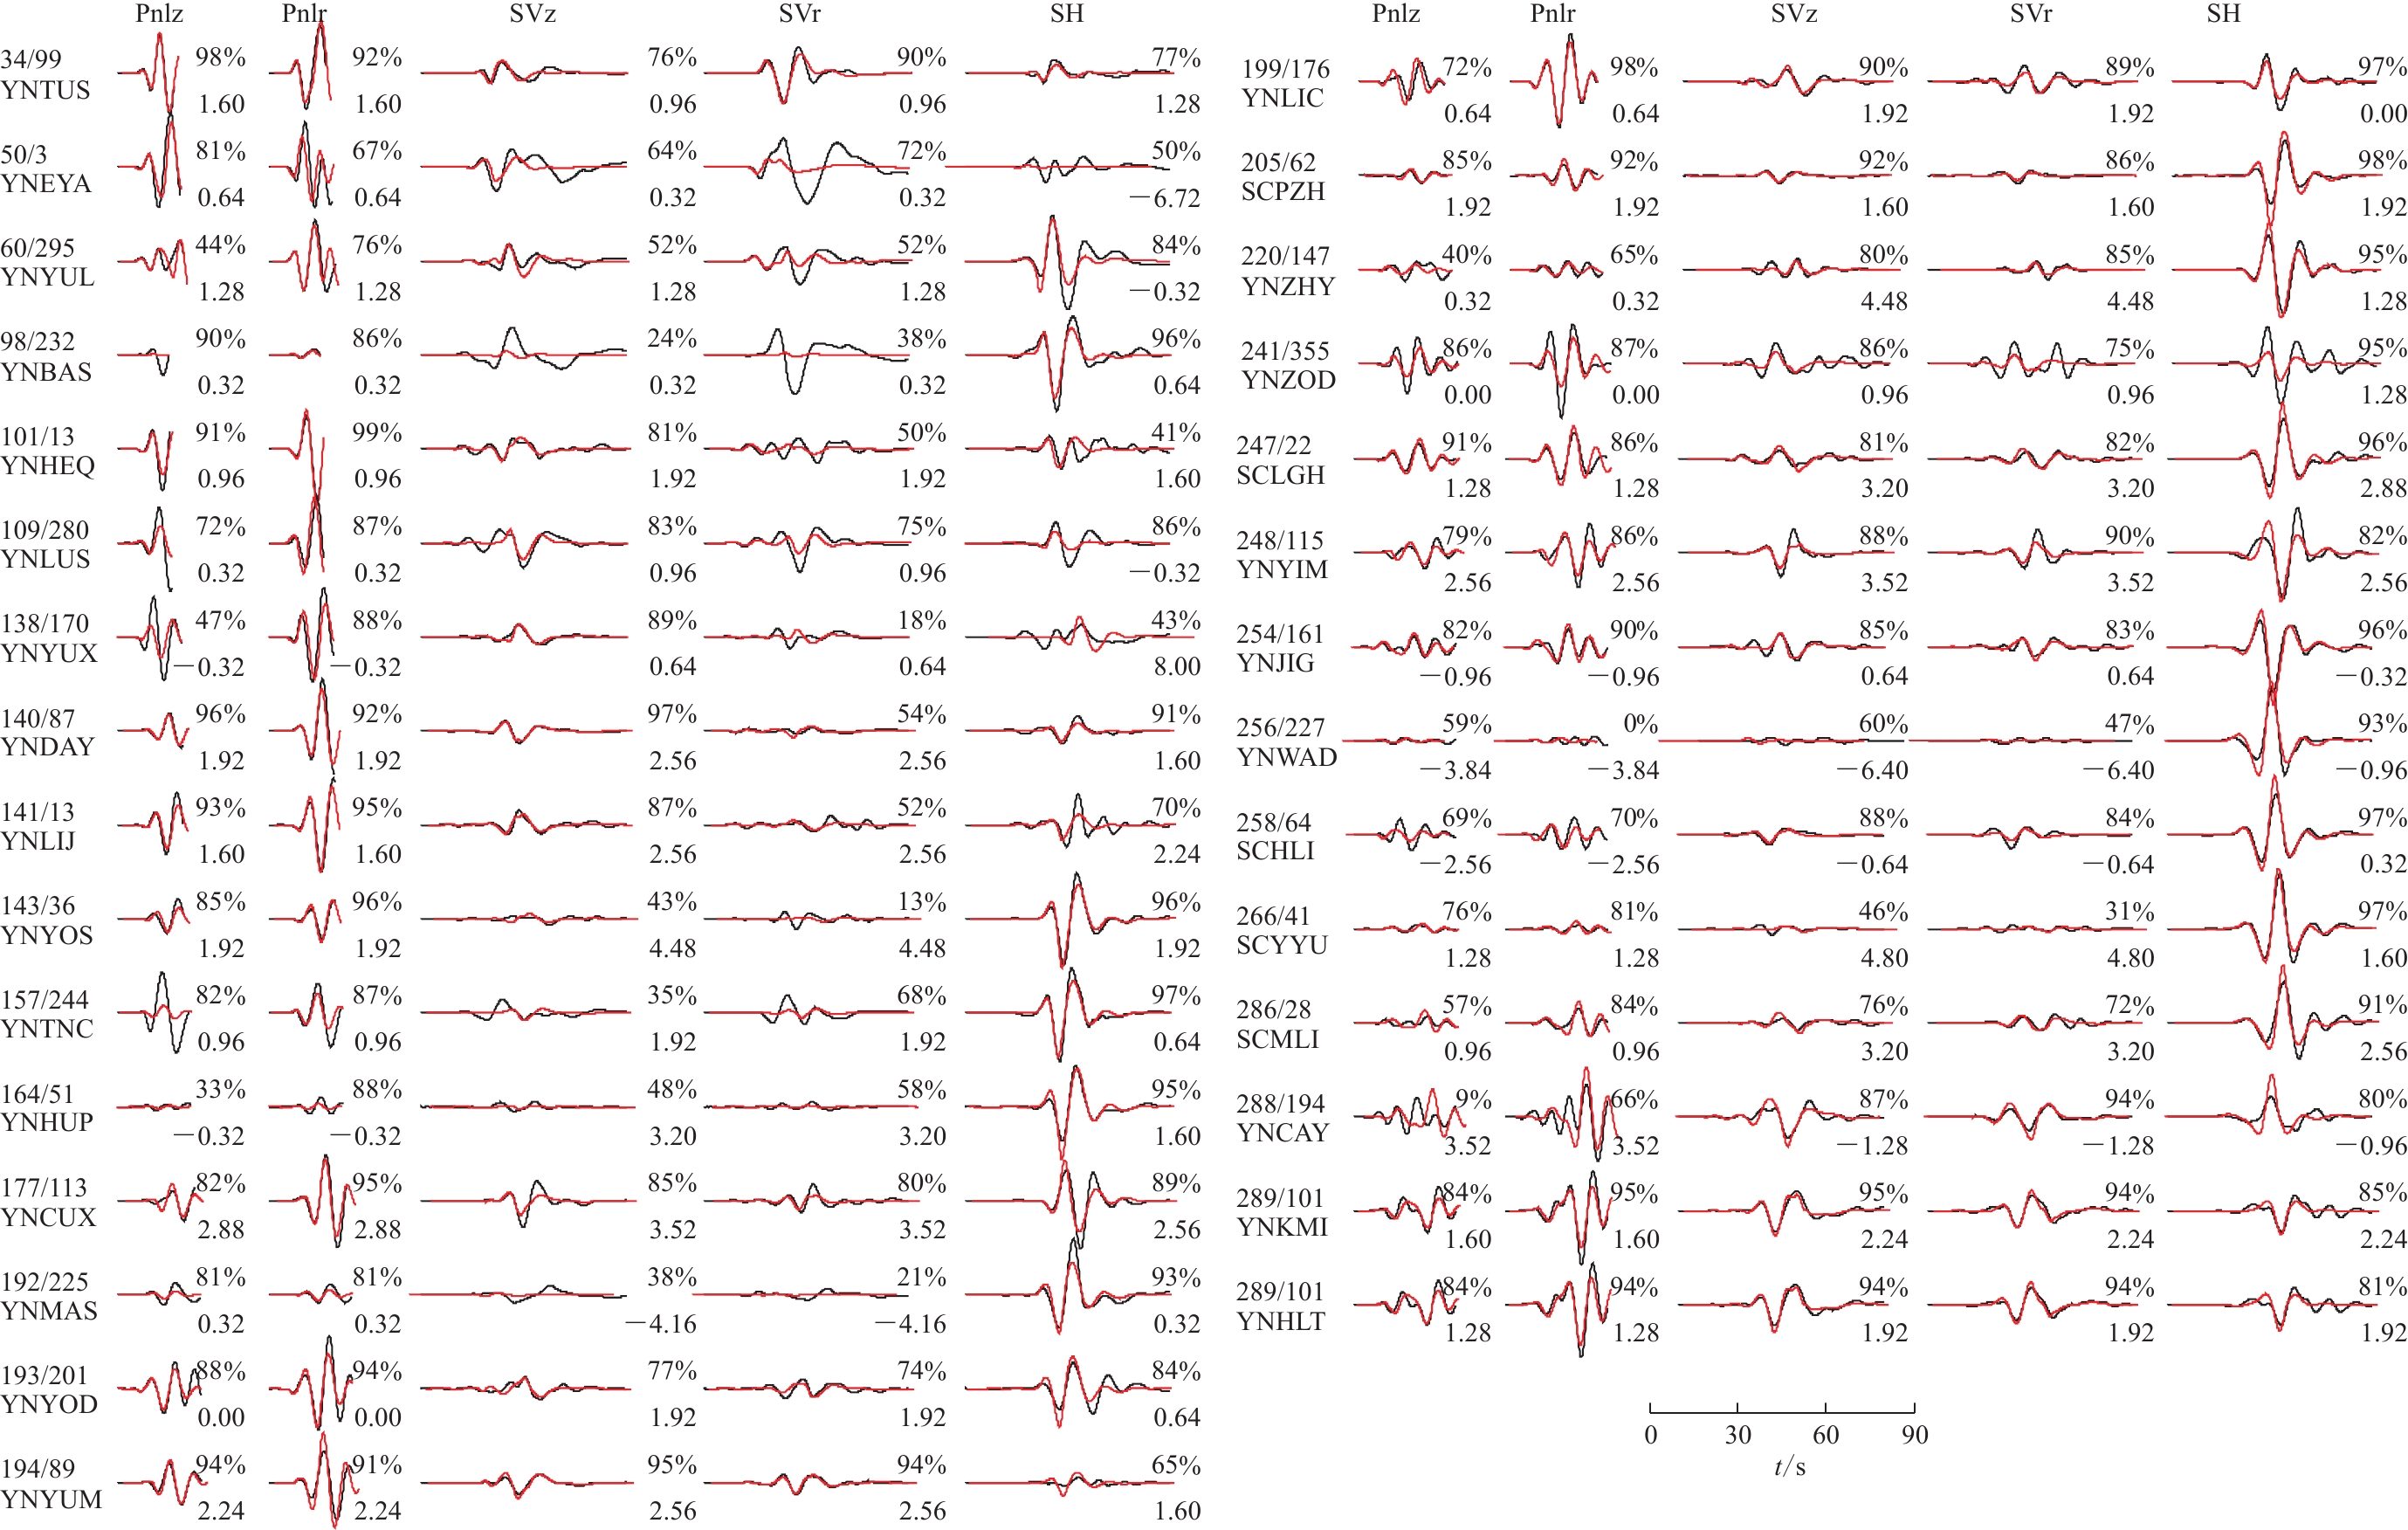
图 7 漾濞地震序列第一个主要前震(2021年5月19日20时5分MW4.57)的全矩张量反演波形拟合(a)
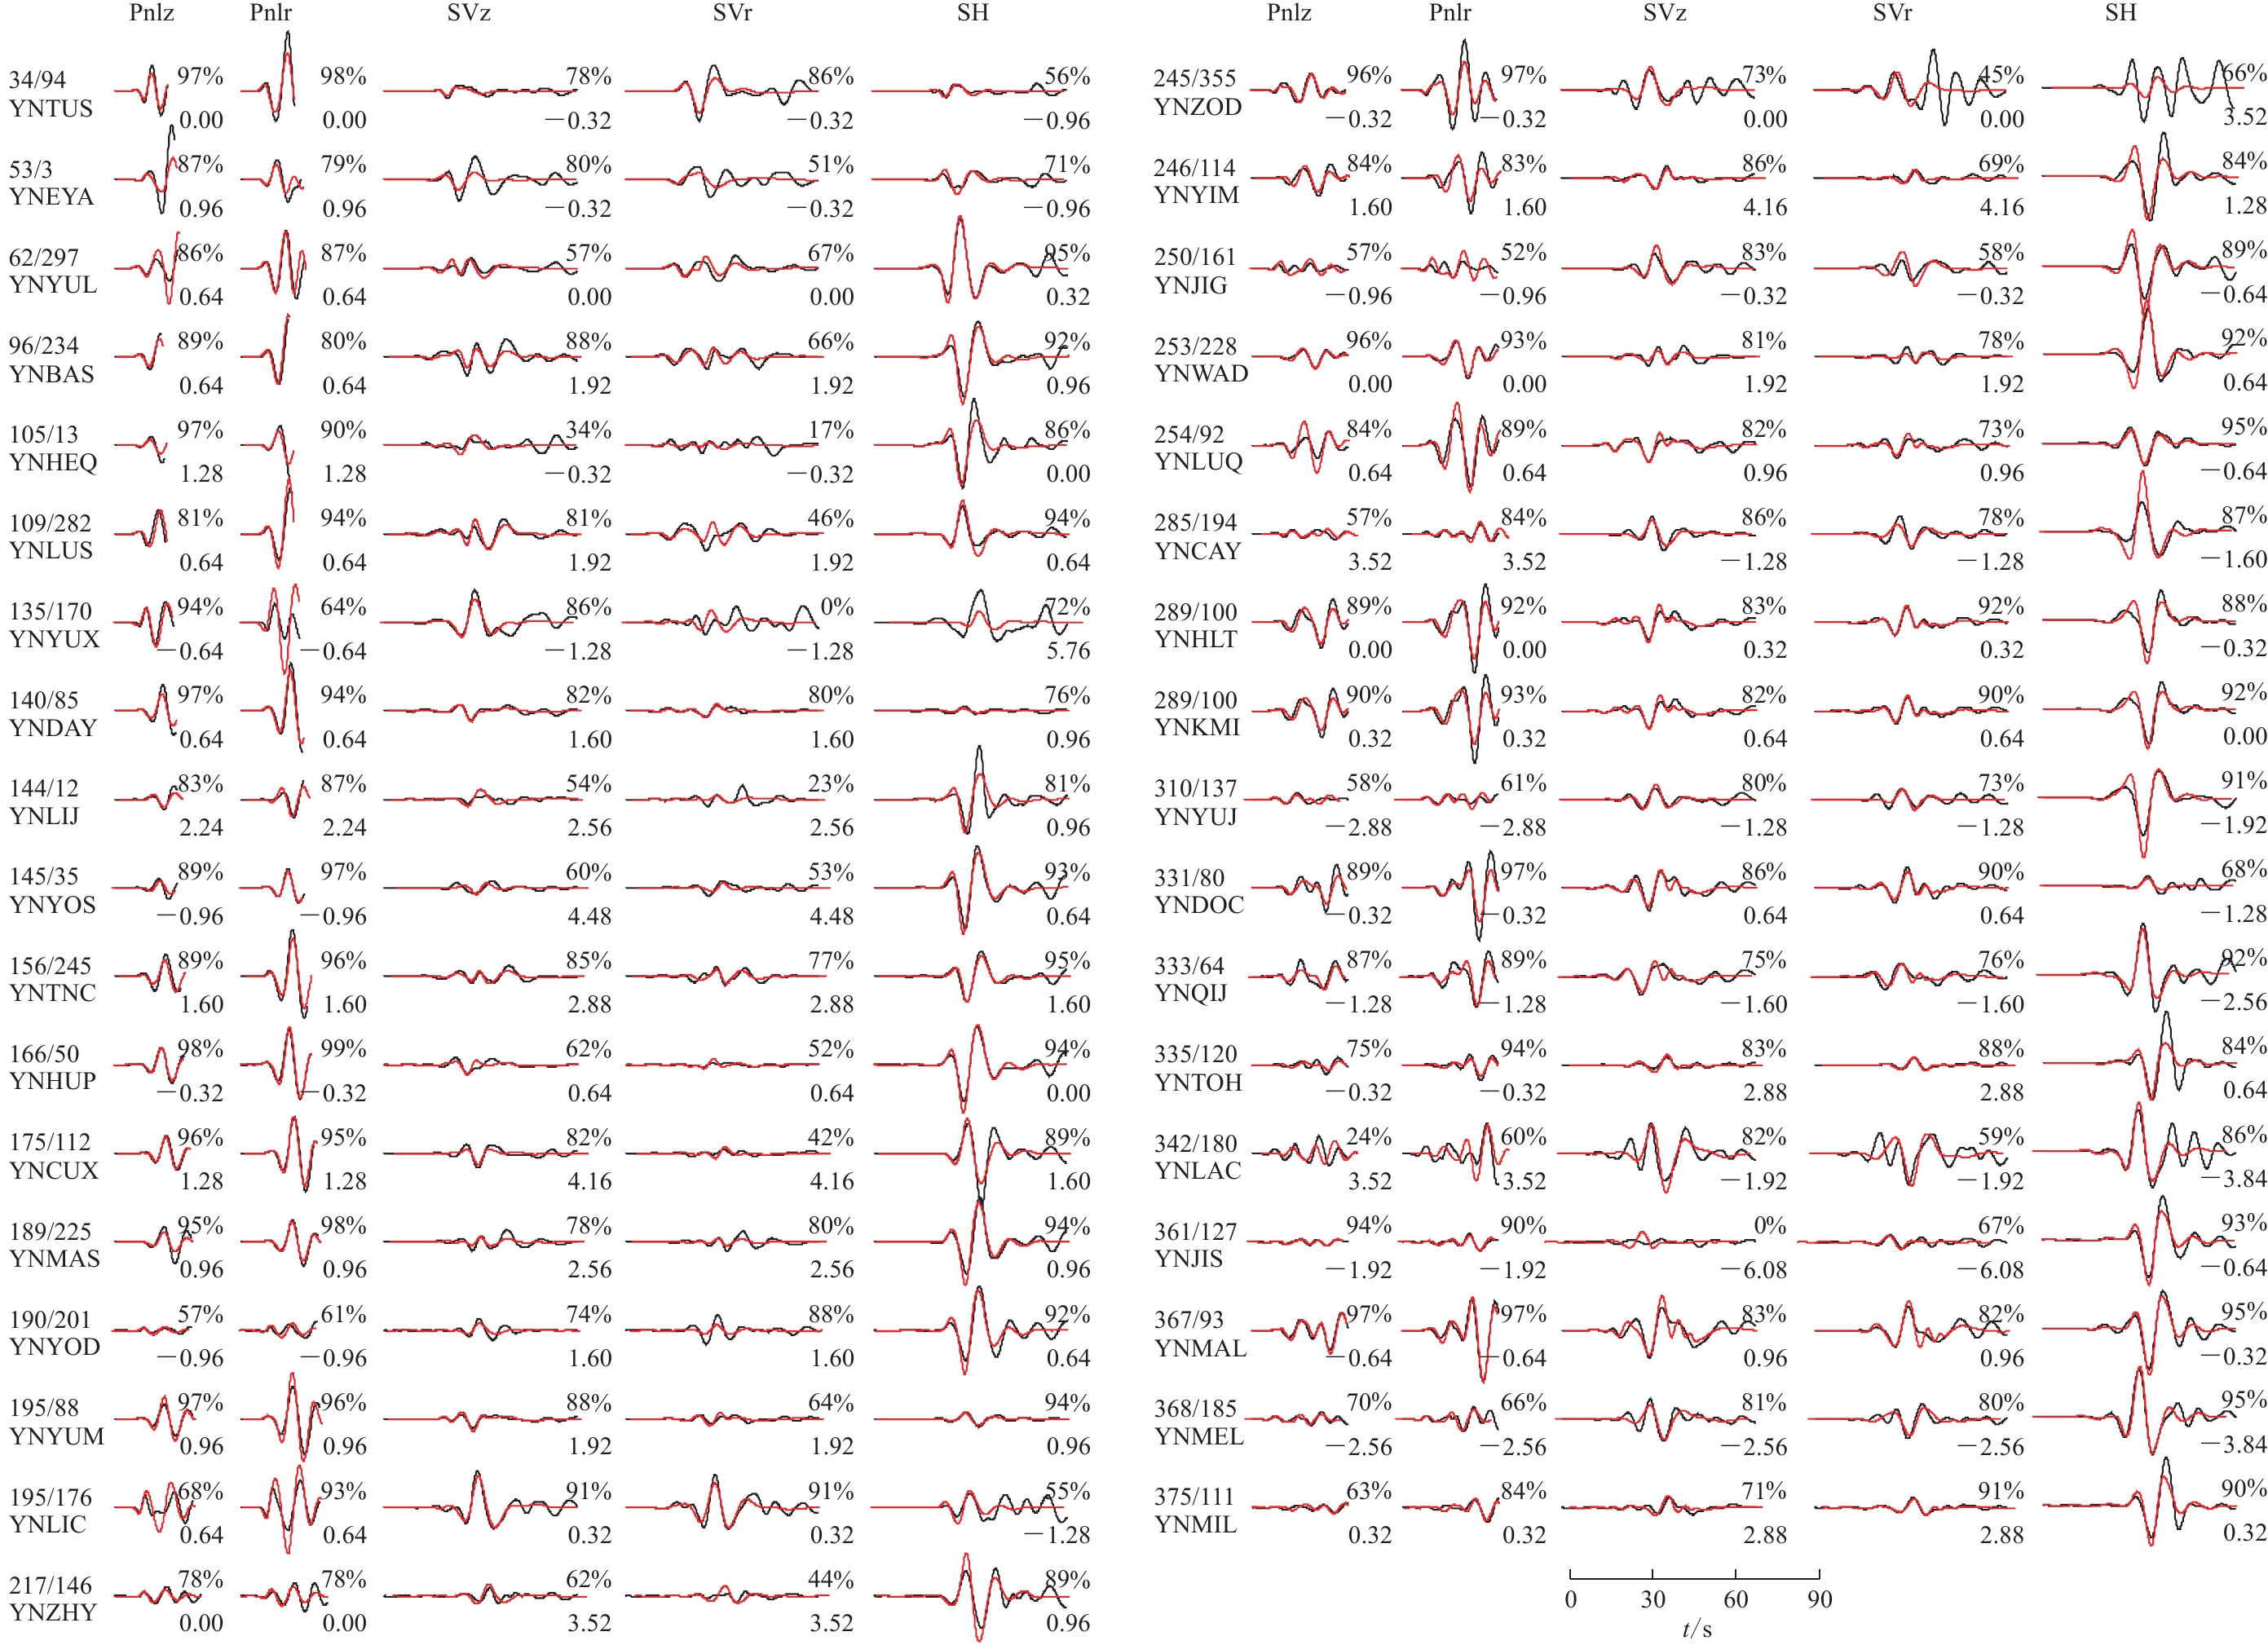
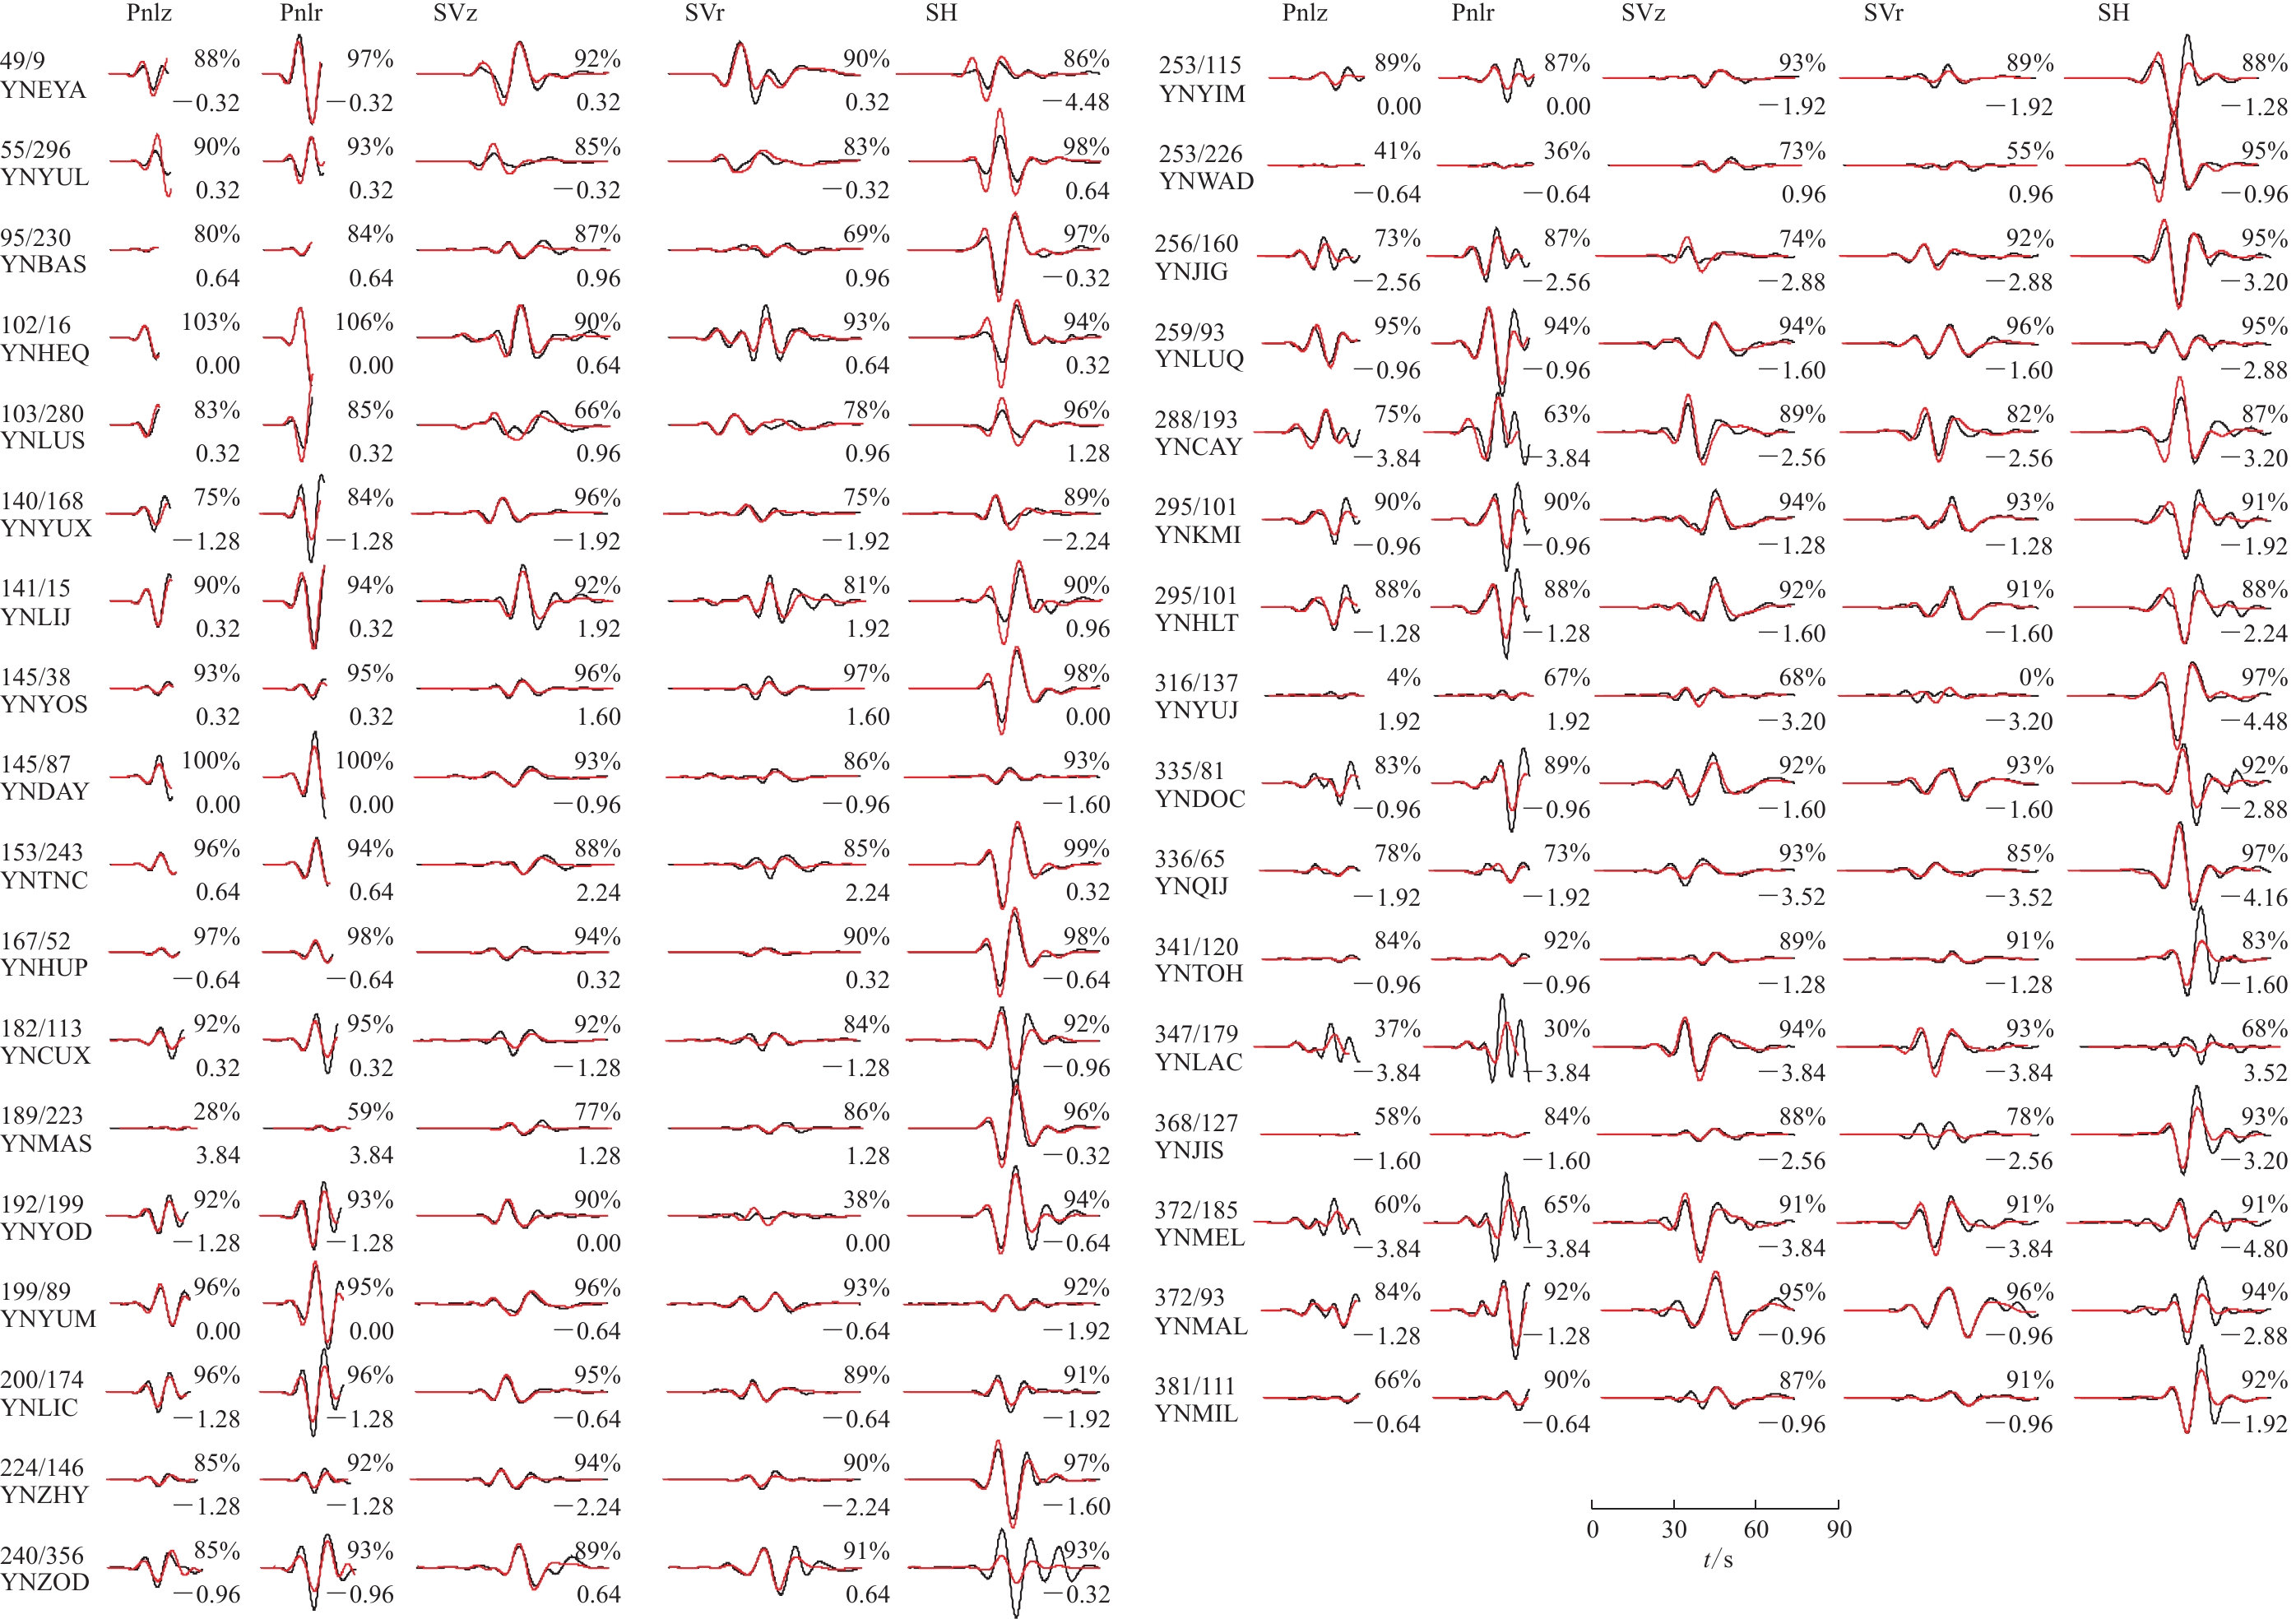
黑色和红色轨迹分别表示观测速度波形和合成速度波形;台站代码上方数字为台站的震中距(km)和方位角(°);每个波形上、下方的数字分别为互相关系数和偏移时间(s),下同
Figure 7. Waveform fitting for the first major foreshock of Yangbi earthquake sequence with MW4.57 occurred at 20:05:03 on 19 May 2021 (a)
The black and red traces indicate the observed and synthetic velocity waveforms,respectively. The numbers above the station code are source-station distance (unit in km) and azimuth (unit in degree). The numbers above and below each trace segment are the cross-correlation coefficients and the time shifts (unit in s),respectively. The same below
![]()
图 7 漾濞地震序列第二个主要前震(2021年5月21日21时21分MW5.21)的全矩张量反演波形拟合(b)
Figure 7. Waveform fitting for the second major foreshock of Yangbi earthquake sequence with MW5.21 occurred at 21:21:01 on 21 May 2021 (b)
![]()
图 7 漾濞地震序列主震(2021年5月21日21时48分 MW6.05)的全矩张量反演波形拟合(c)
Figure 7. Waveform fitting for the MW6.05 main shock of Yangbi earthquake sequence occurred at 21:48:03 on 21 May 2021 (c)
![]()
图 7 漾濞地震序列一个主要余震(2021年5月21日22时31分MW5.03)的全矩张量反演波形拟合(d)
Figure 7. Waveform fitting for the major aftershock of Yangbi earthquake sequence with MW5.03 occurred at 22:31:03 on 21 May 2021 (d)
![]()
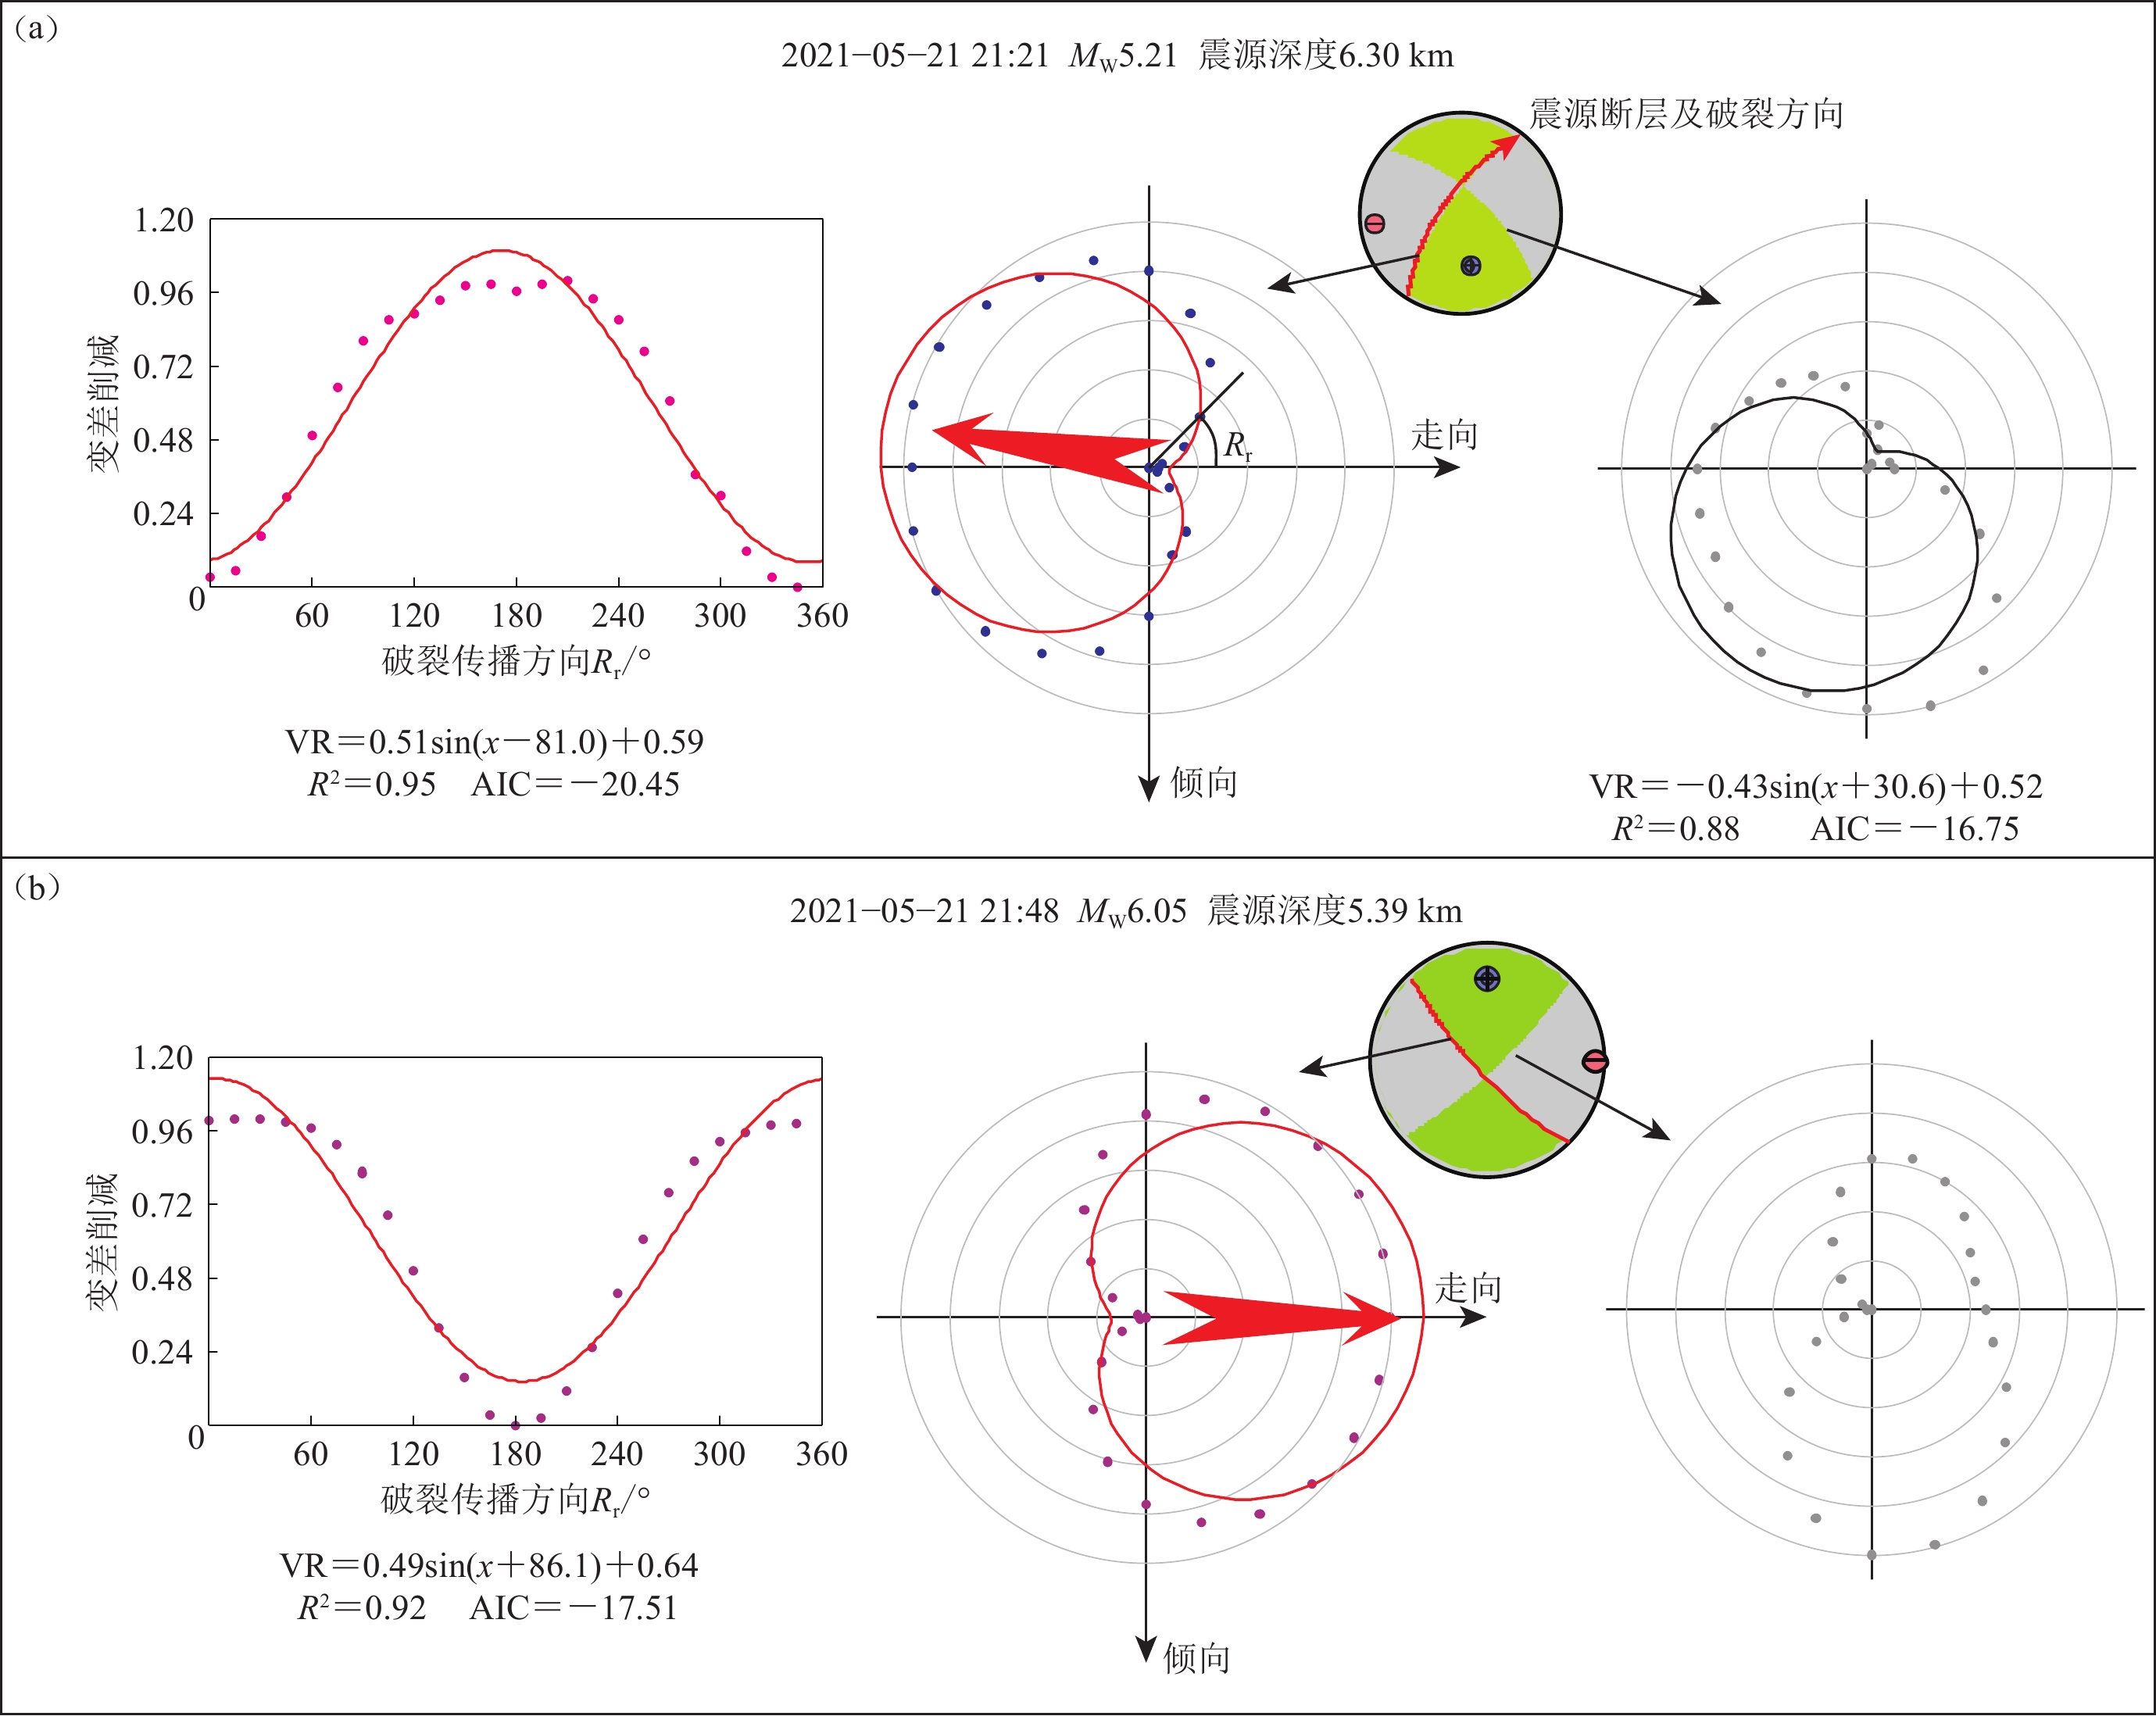
图 8 基于矩张量结果及破裂方向反演得到的漾濞地震序列的最大前震(a)和主震(b)的震源断层及其破裂方向
左侧为直角坐标下拟合确定系数R2较大的变差削减与方向的关系。中间和右侧为极坐标下根据方程的视震源函数进行矩张量反演的各地震台站的变差削减(VR)与断层面上对应方向角度之间的关系;圆点为数据;红色(首选)或黑色实线为拟合结果。极坐标里的红色箭头表示震源断层面上的破裂传播方向
Figure 8. Source faults and their rupturing directivity for the strongest foreshock (a) and main shock (b) of the Yangbi earthquake sequence based on moment tensor and rupture directivity inversion
The left plot shows the results of the preferred results of greater determination (R2) in Cartesian coordinates. The central and right plots show the variation reduction in polar coordinates of the moment tensor inversion based on the apparent source function defined by equation (2). Each station is projected on the plot according to its corresponding direction angle on the fault plane. The circle symbol is the data,and the red (preferred) and black lines are the fitting result. The red line and arrow on the source sphere indicate the estimated source fault and the rupture direction. The red arrow in polar coordinates indicates the rupture direction on the fault plane
![]()
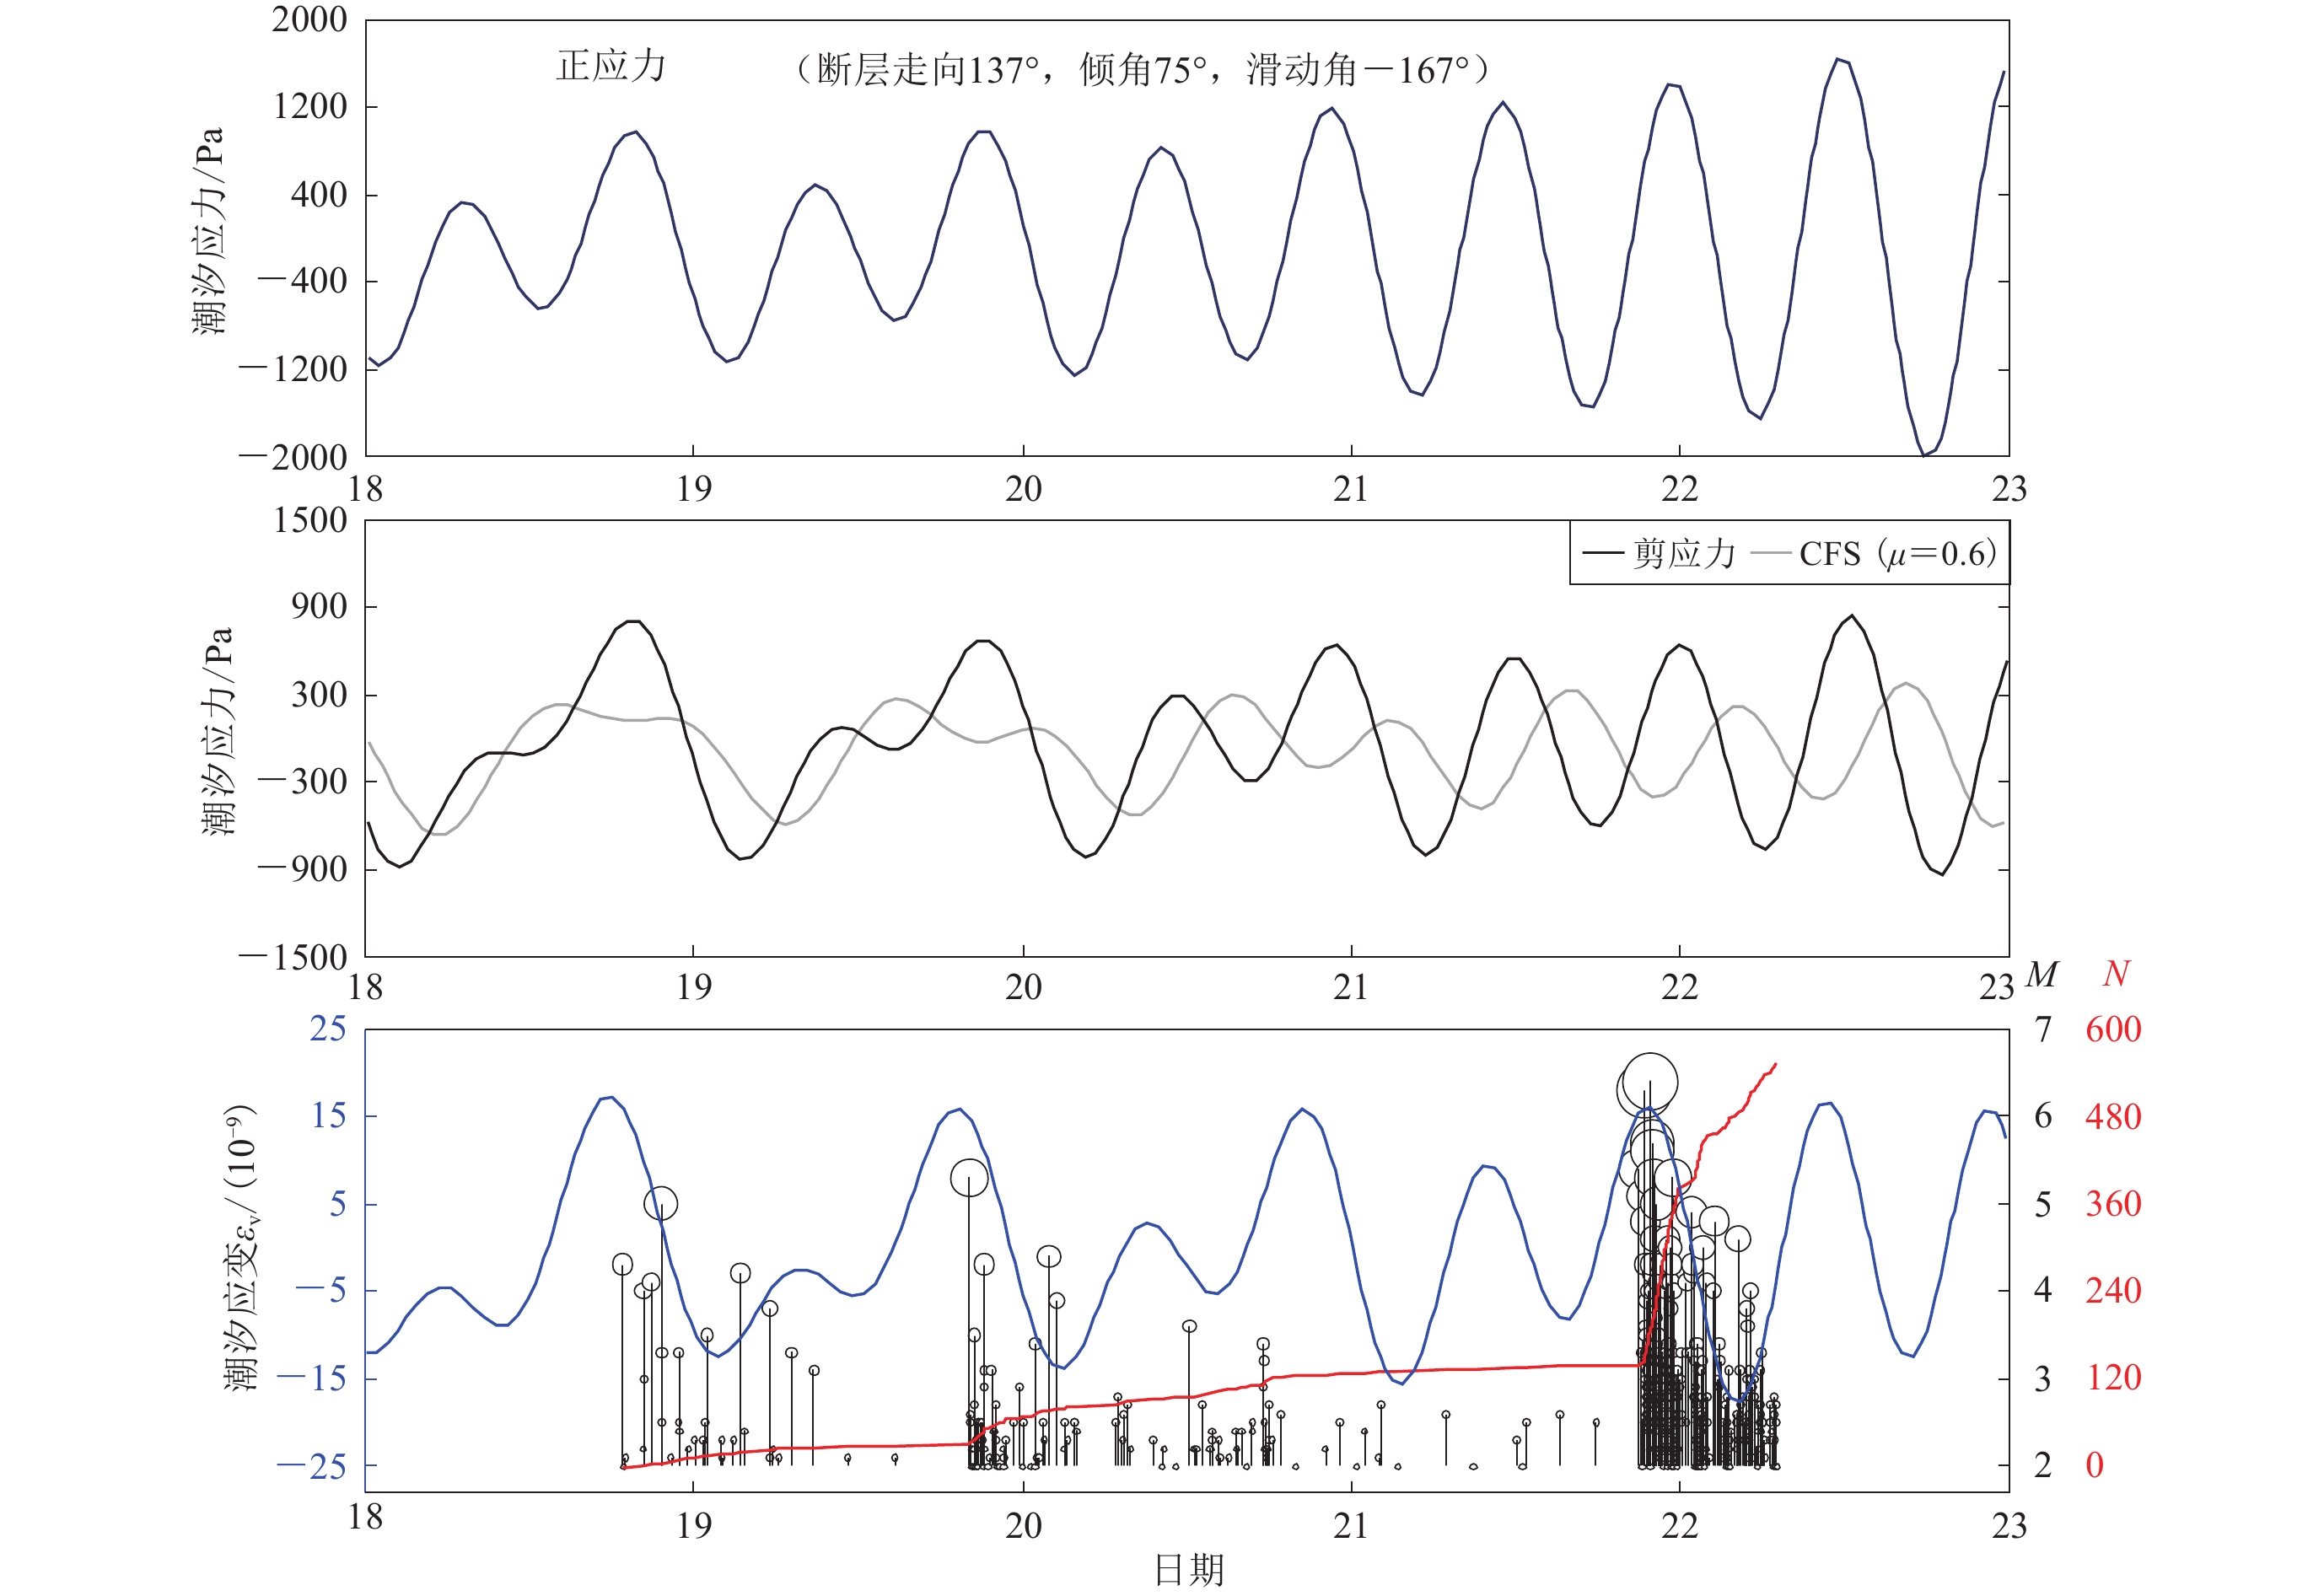
图 9 2021年5月漾濞地震序列M2以上地震的震级和累计数的时间分布(M,N)及其与理论固体潮体应变εv和主震断层面潮汐应力(正应力,剪应力和库仑应力CFS)的对应关系
Figure 9. Magnitude M and cumulative number N of M≥2 earthquakes in the Yangbi earthquake sequence and their corresponding with theoretical solid tidal strain εv and tidal stress (normal stress,shearing stress and Coulomb failure stress CFS) on the fault plane of the main shock
![]()
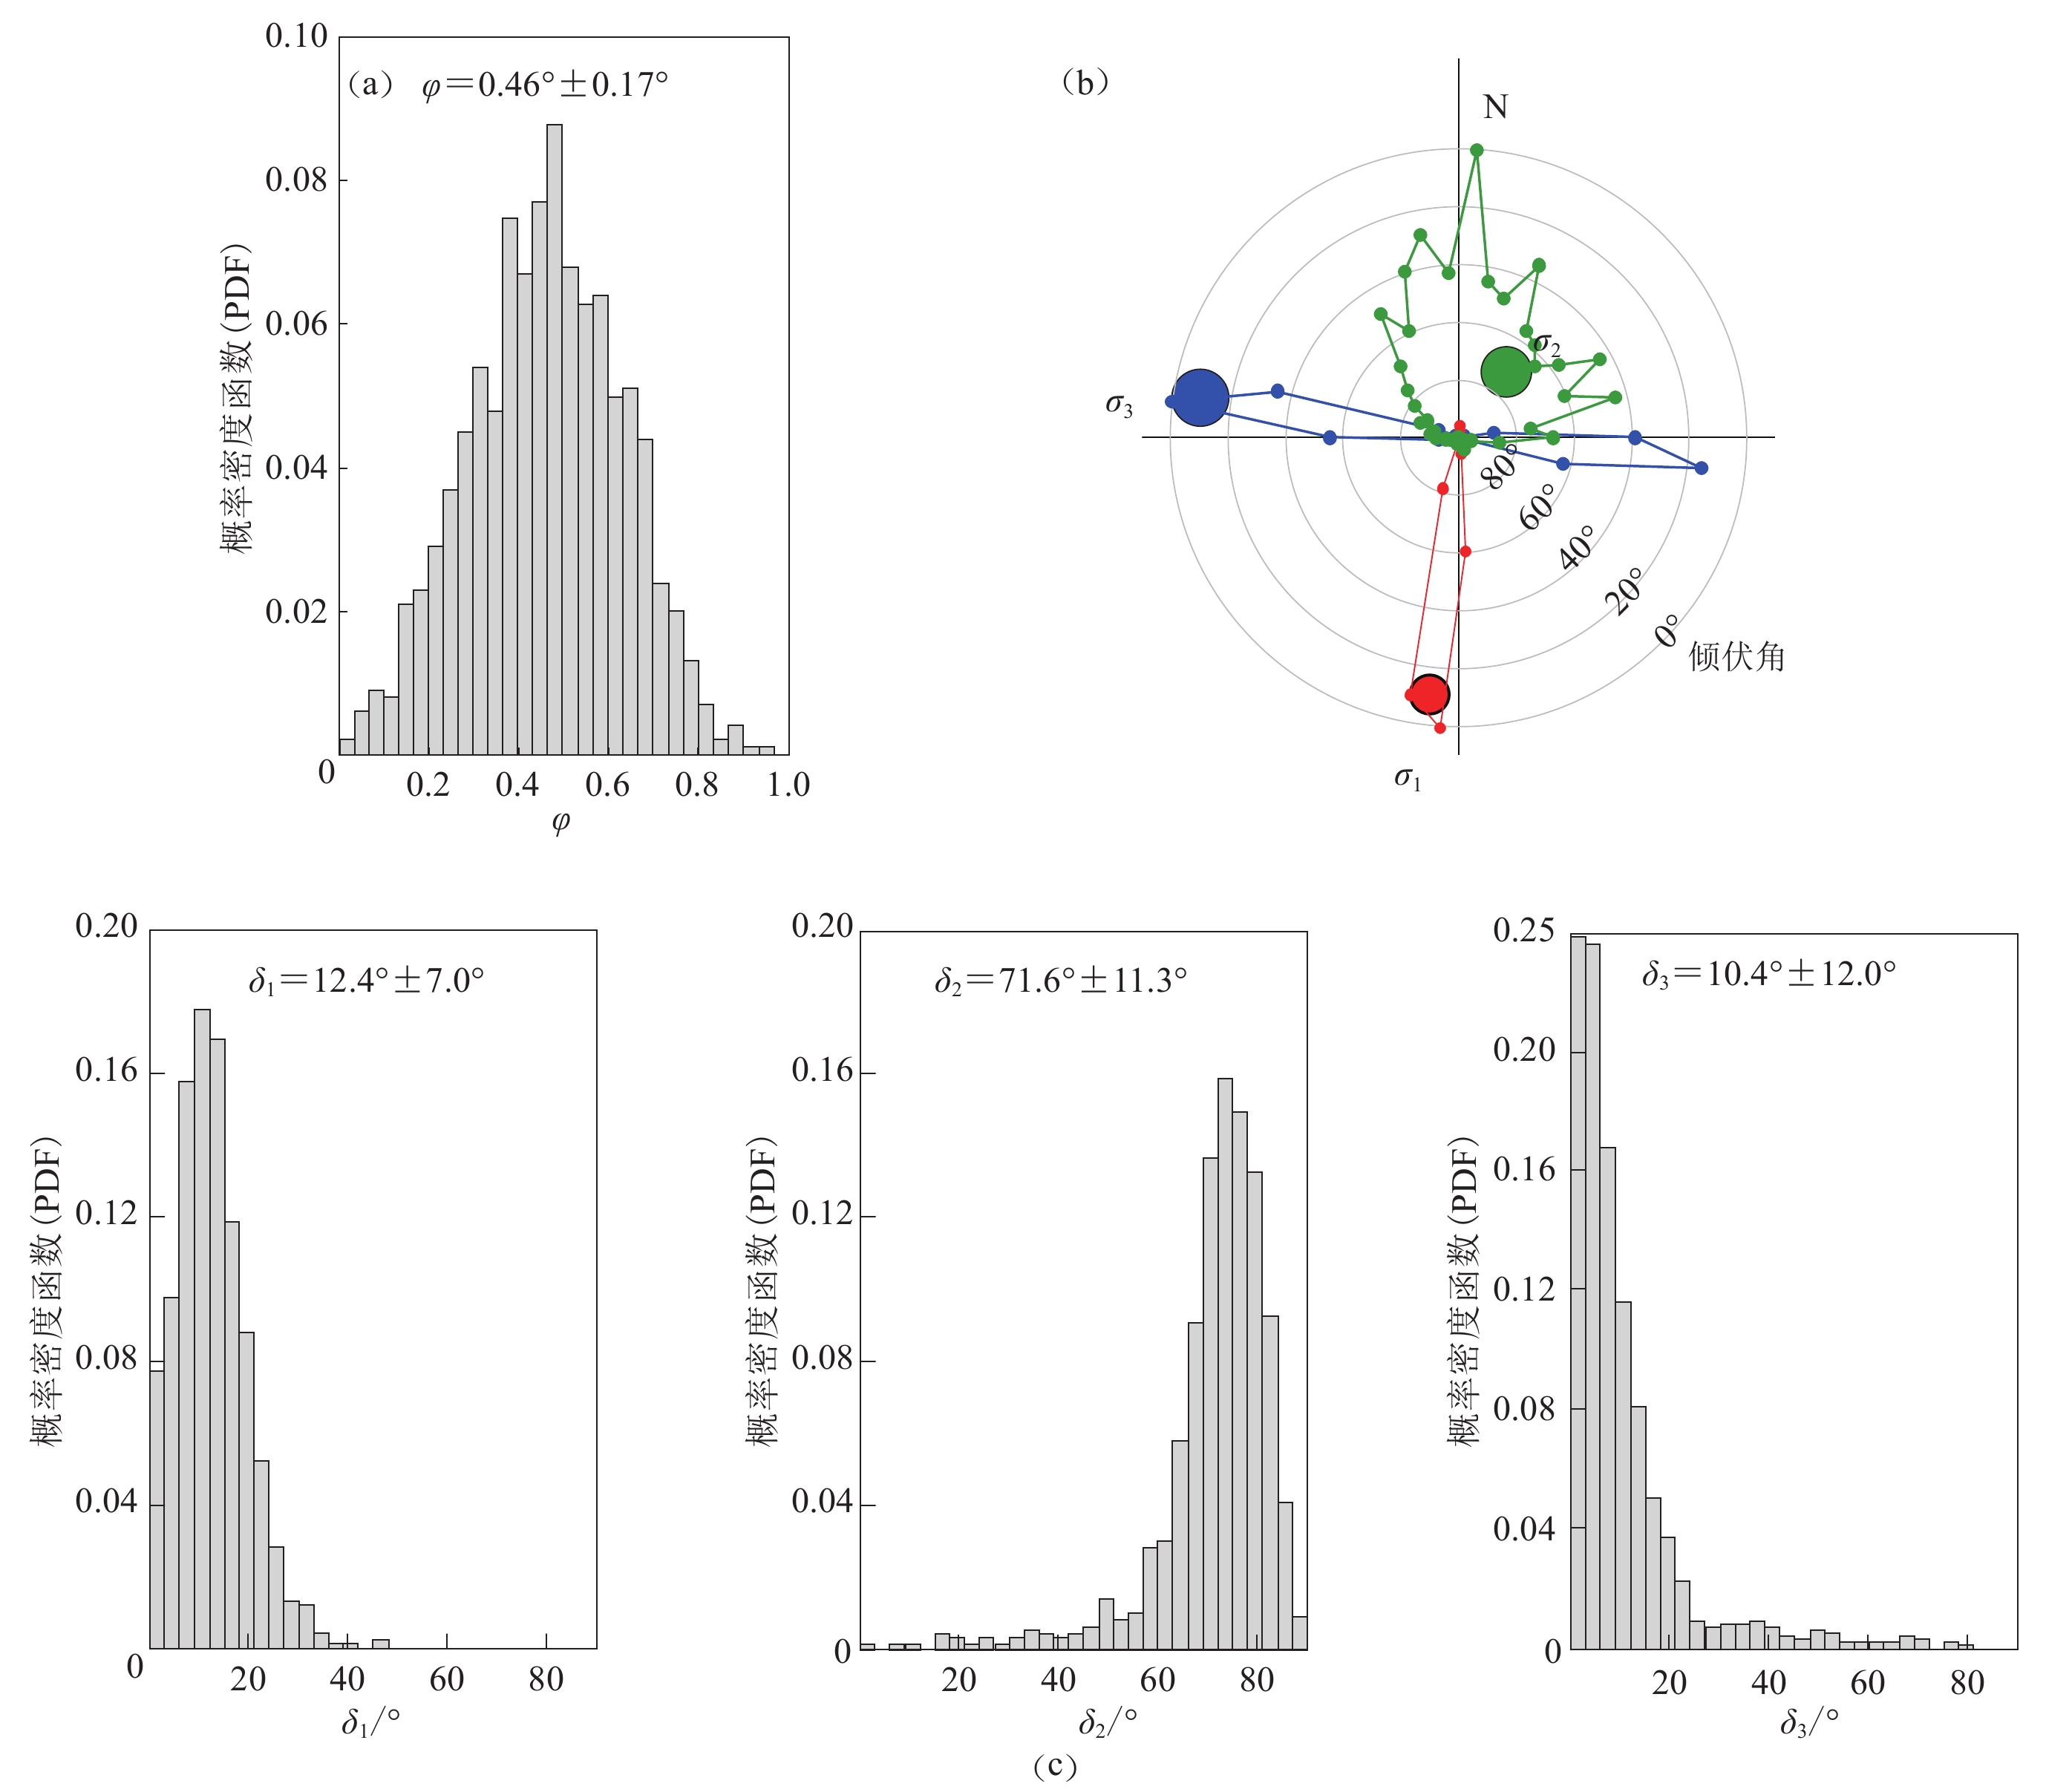
图 10 2021年5月漾濞地震局部应力场反演结果
(a) 主应力形状比$\varphi $的概率密度函数分布;(b) 各主应力轴的方位角分布;(c) 各主应力轴倾伏角δ的概率密度分布
Figure 10. Local stress field inversion results of Yangbi earthquake in May of 2021
(a) Estimated probability density functions (PDF) of the stress shape ratio $\varphi $;(b) Distribution of azimuth angles of the maximum principal stress axis;(c) PDF of plunge δ of the maximum principal stress axis
![]()
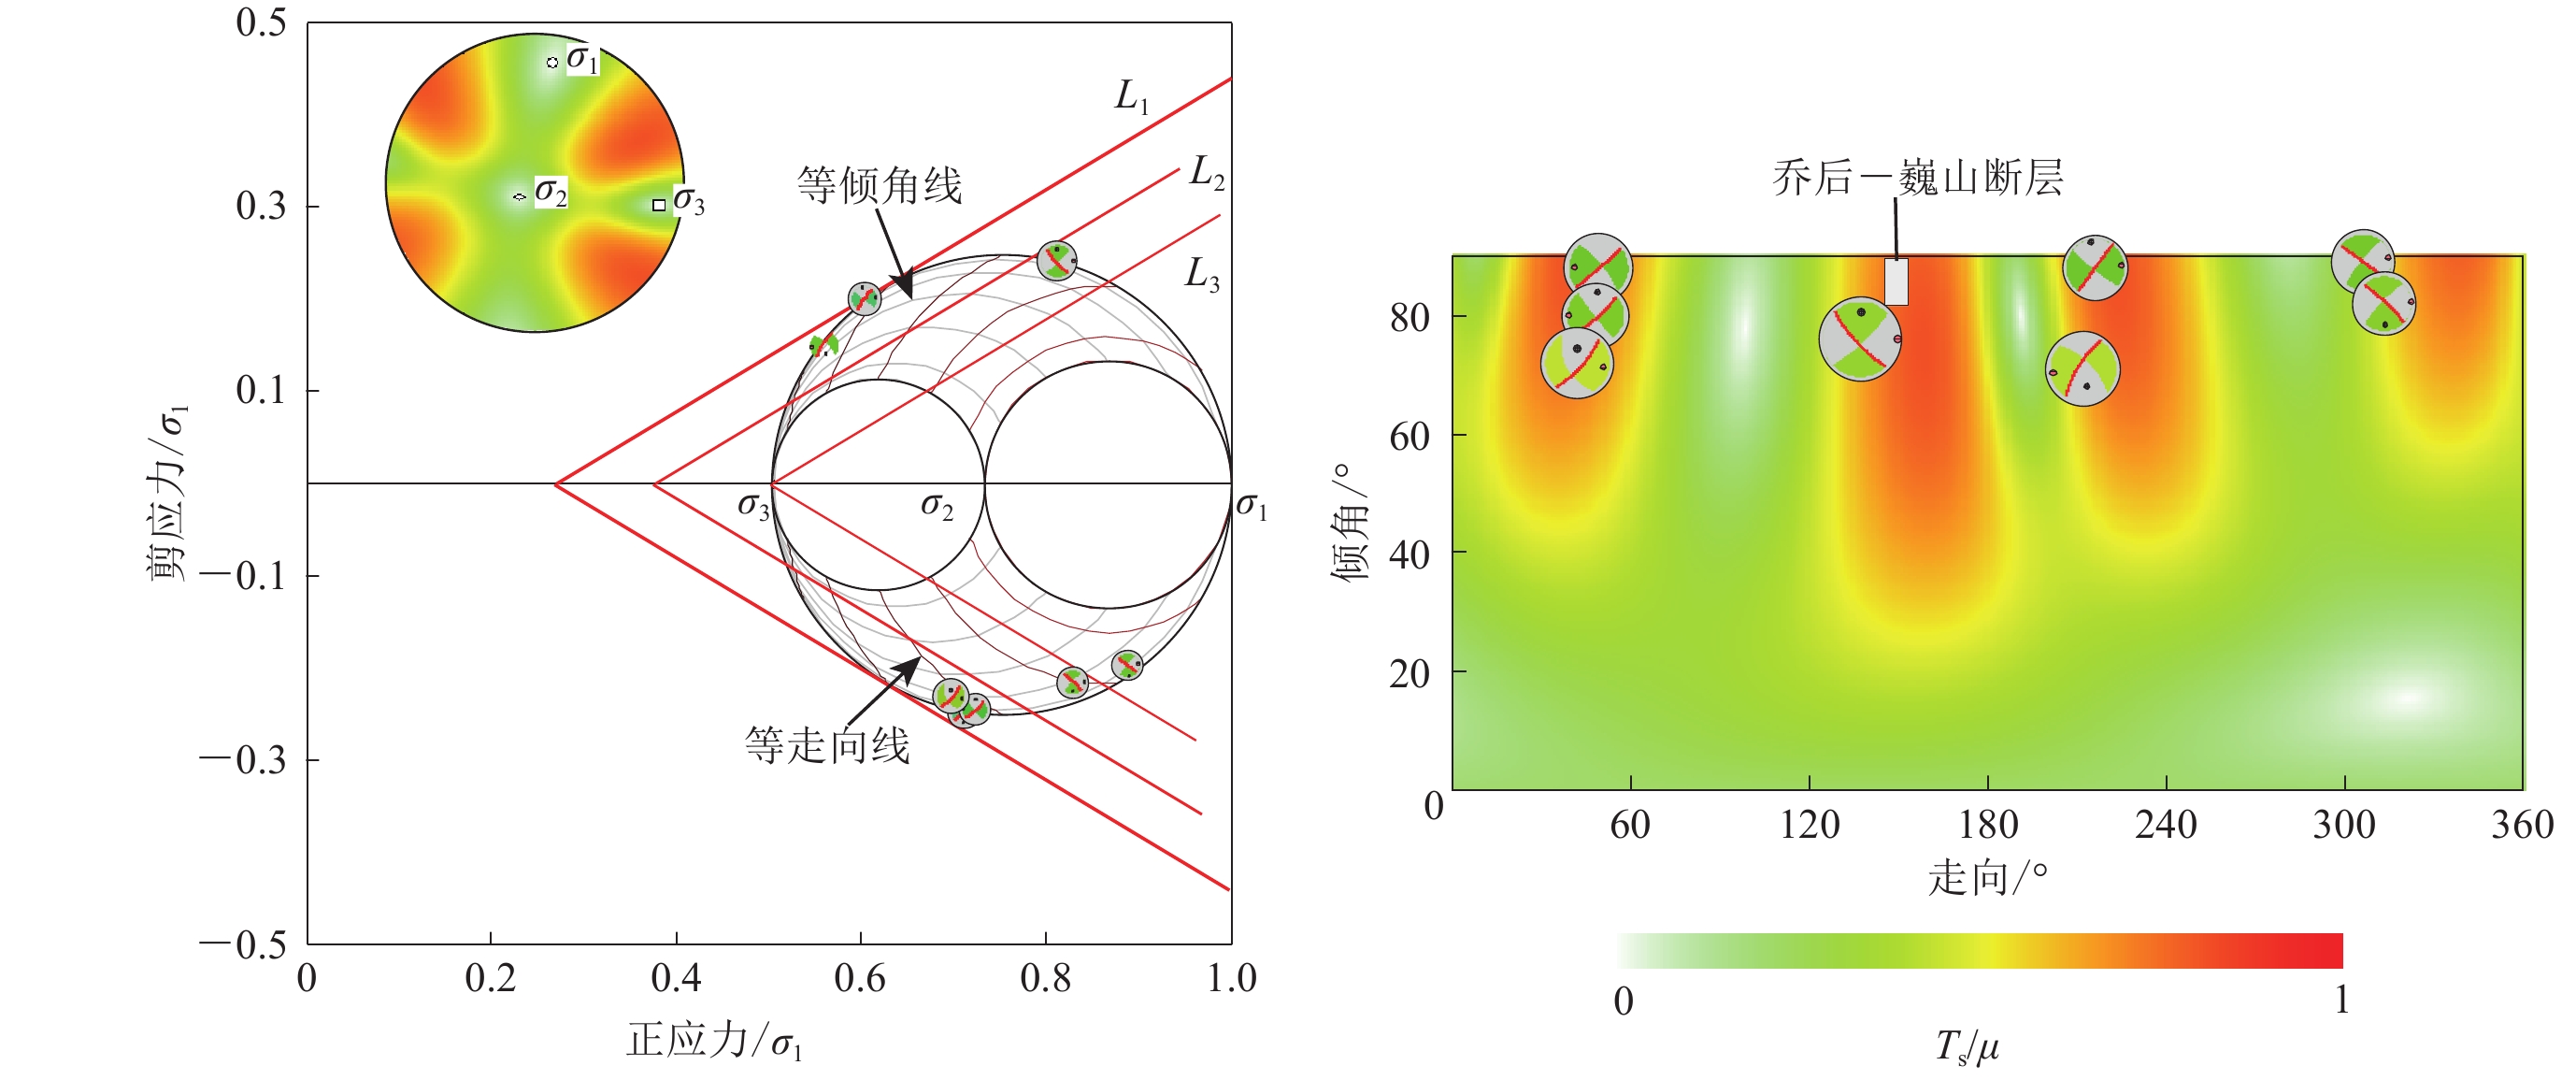
图 11 漾濞地震序列分布区域应力场反演结果
(a) 主要地震在归一化正应力-剪应力坐标下的摩尔圆,图中对应关系线L1,L2和L3分别表示静水压力、中间流体压力和与岩石覆盖压相等的流体压力下的断层强度;(b) 断层走向-倾角坐标下的归一化断层滑动趋势分布
Figure 11. Focal mechanisms of major earthquakes
(a) 3D Mohr diagram (normalized by the maximum principal stress) by lower-hemisphere projection of the focal spheres,where lines L1,L2,and L3 indicate the fault strengths under hydrostatic,intermediate,and lithostatic fluid pressures,respectively;(b) Distribution of normalized fault slip tendency in the fault strike-dip coordinate
![]()
图 12 漾濞地震两个强前震(a)和漾濞地震前震及主震(b)引起的库仑应力变化
F1:乔后—巍山断裂;数字1—8为主要地震,其编号与表1中相同。图(a)中接收断层的产状为主震震源机制解的北西向节面,图(b)中为主震震源机制解的北东向节面
Figure 12. Change of Coulomb failure stress (CFS) caused by two strong foreshocks on faults with strike 137°,dip 76°,rake −168° (a) and caused by foreshocks and the mainshock on faults with strike 43°,dip 78°,rake −14° (b)
F1:Qiaohou-Weishan fault. Numbers 1−8 indicate the number of major earthquakes listed in Table 1. In Fig. (a) the fault corresponds to the NW-striking fault of the mainshock mechanism solution,and in Fig. (b),corresponds to the NE-striking fault of the main shock mechanism solution
![]()
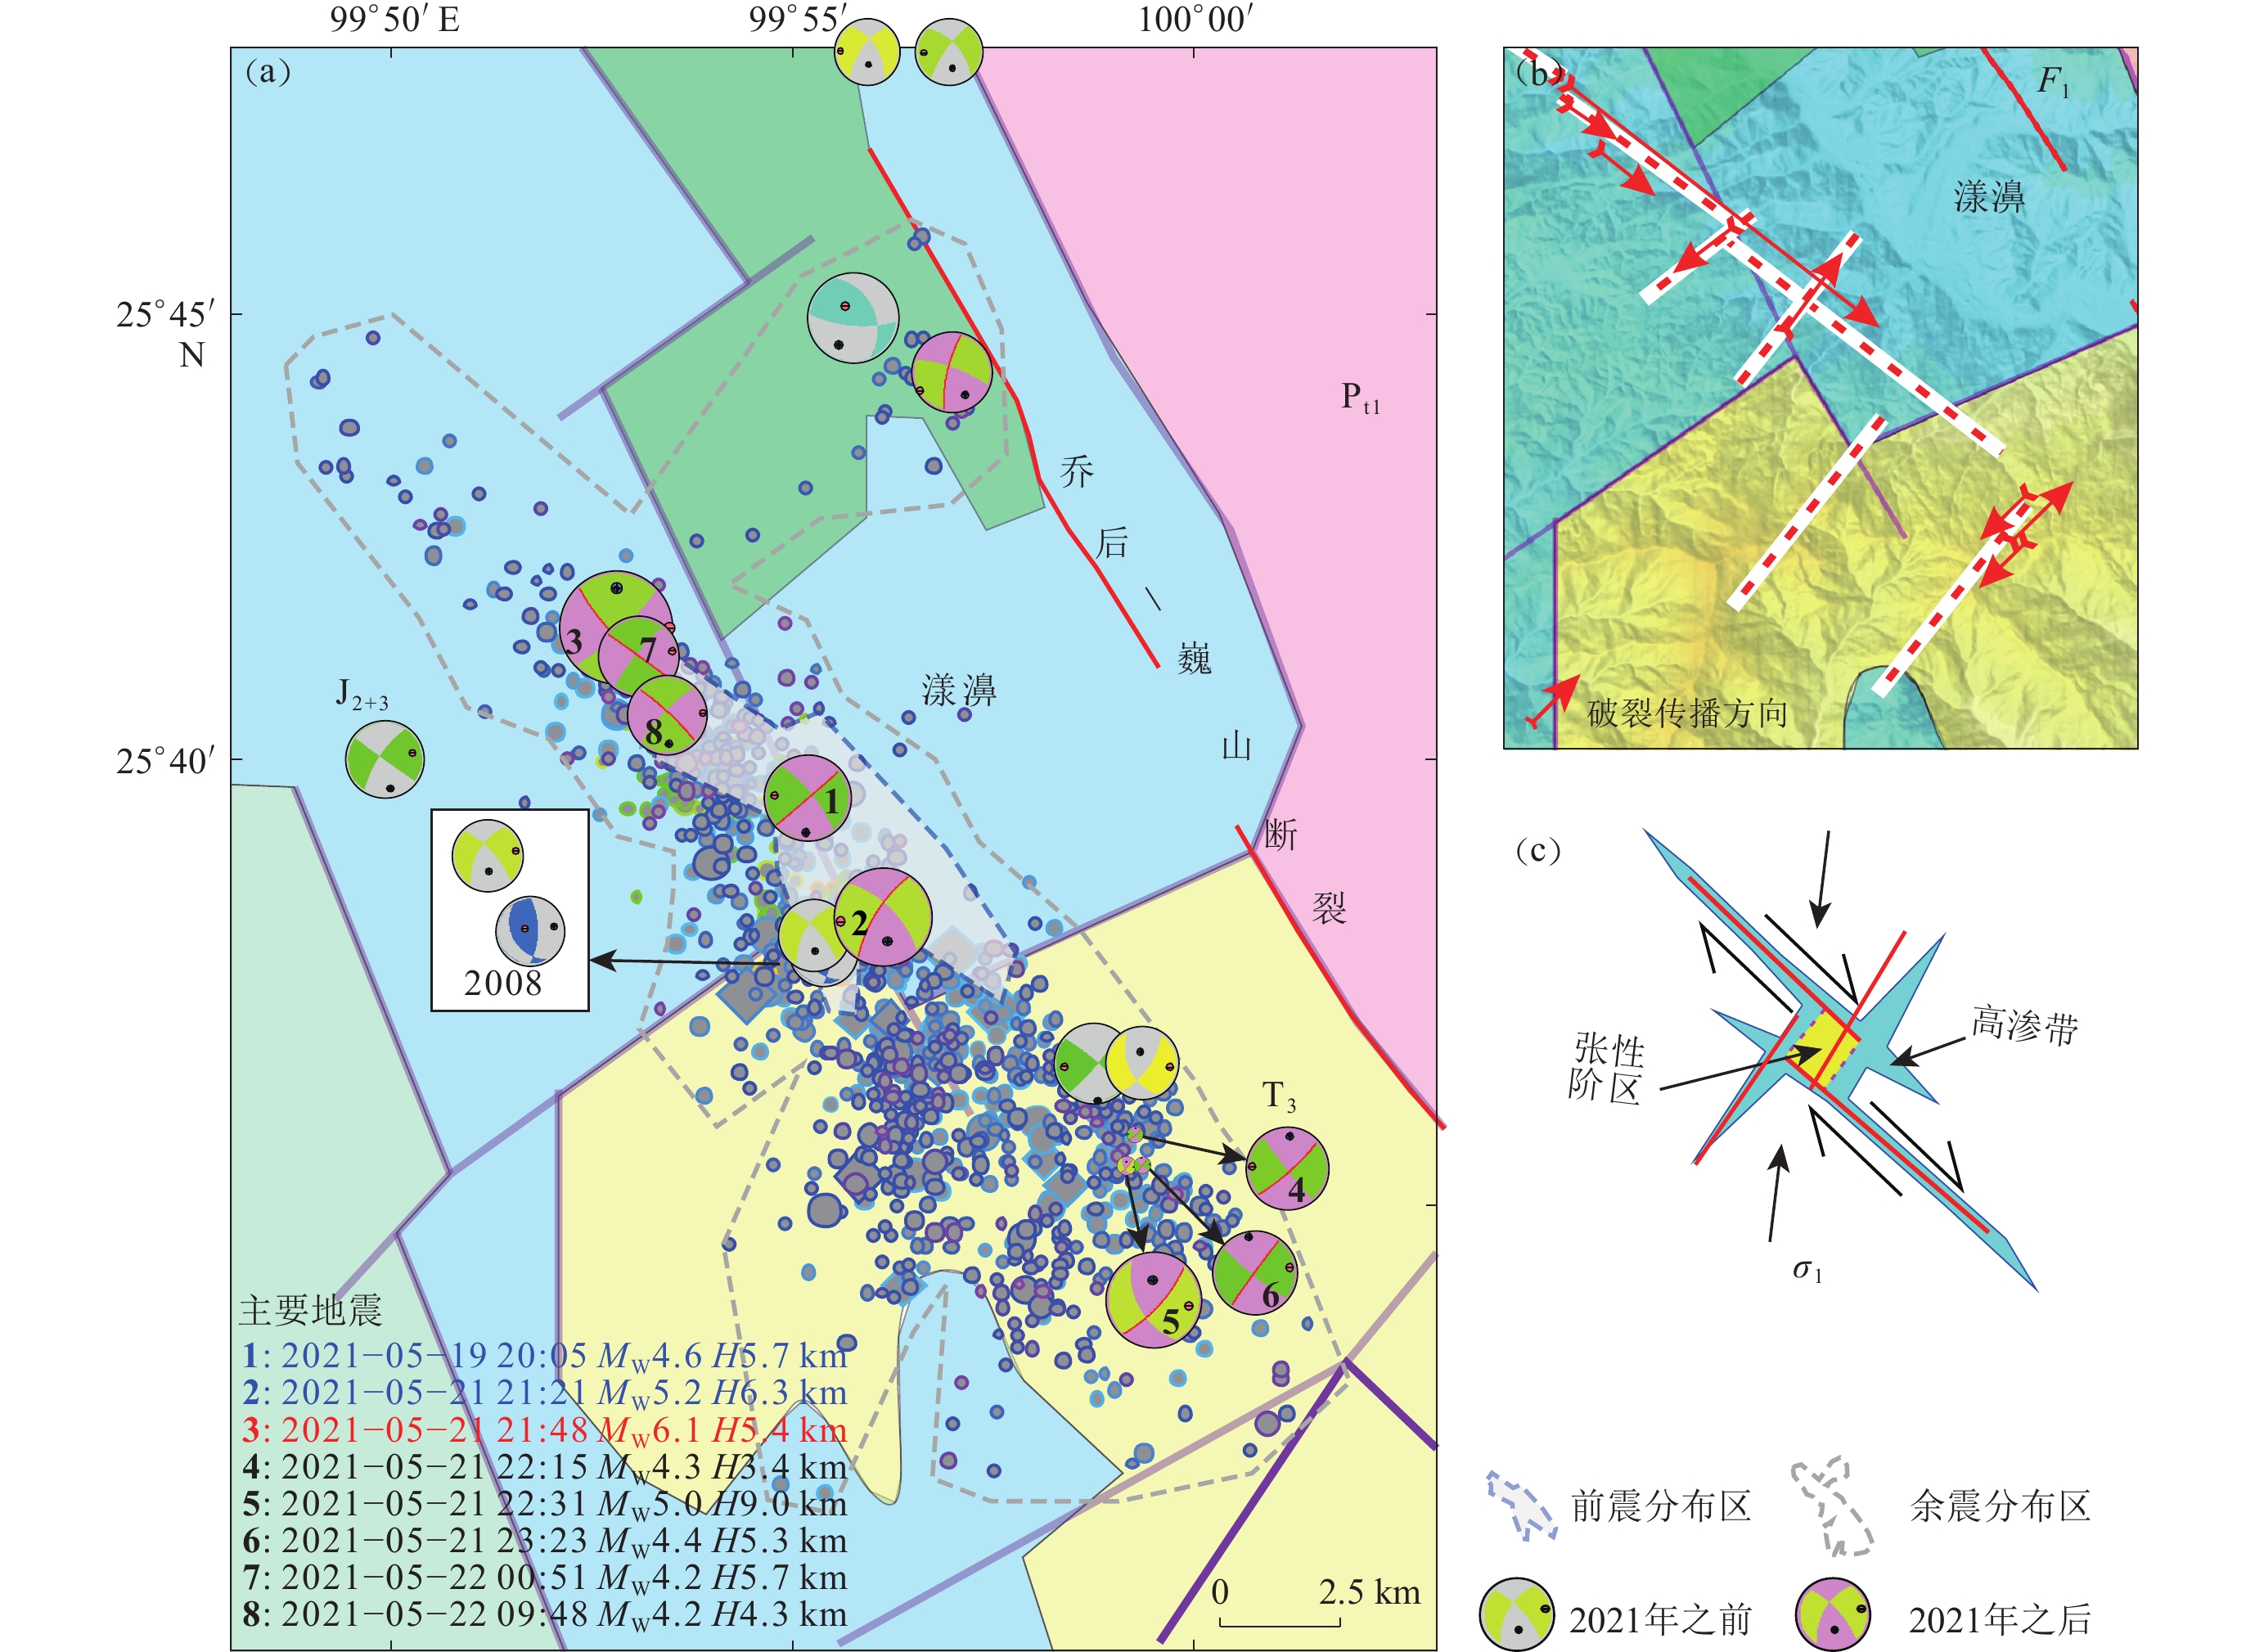
图 14 (a) 漾濞附近简易地质图及本研究推测的漾濞断层构造(南段)示意图;(b) 主要地震的传播方向;(c) 漾濞地震序列开始点附近的拉张性阶区的构造卡通图
Figure 14. (a) A simple geological map surrounding the Yangbi earthquake sequence overlapped with relocated hypocenters and a schematic diagram of the southern segment of the Yangbi fault inferred in this study;(b) The rupture directions of major earthquakes;(c) A cartoon diagram of the extensional jog area near the starting point of the foreshocks
![]()
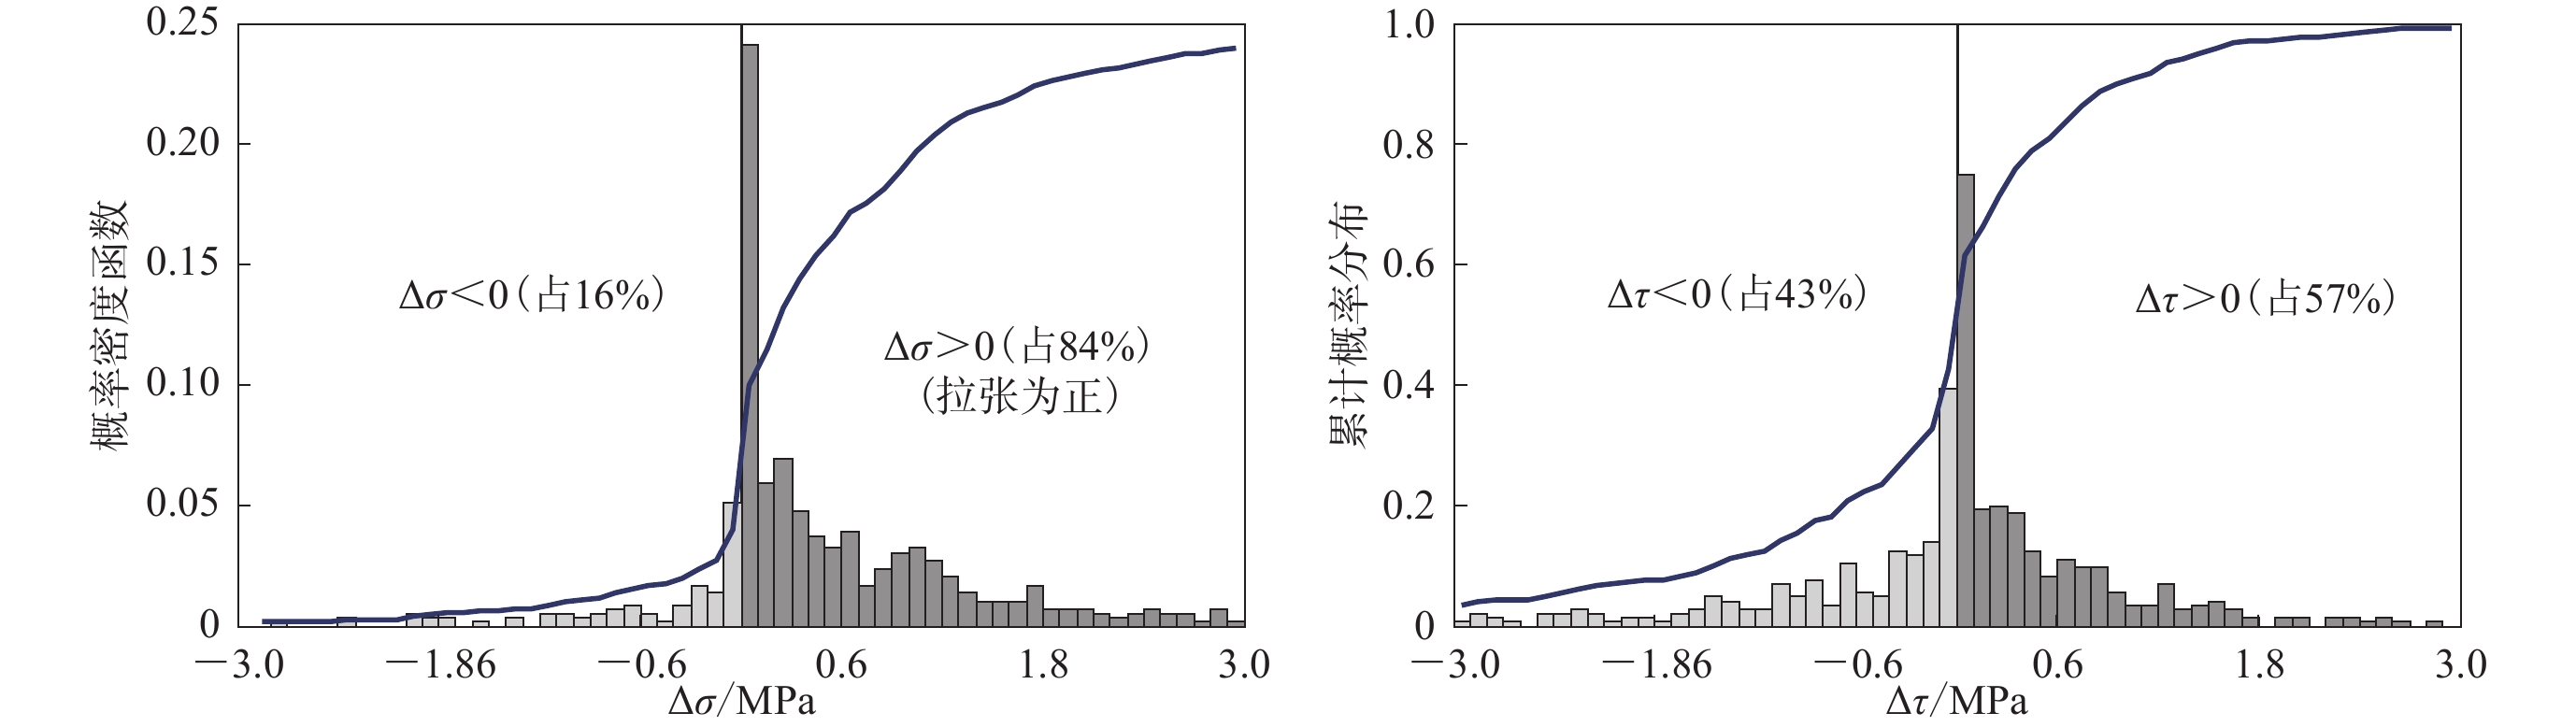
图 13 截至2021年5月23日漾濞地震序列精定位事件震源处先前主要地震引起应力变化的概率密度函数(PDF)和累积分布函数(CDF)
每个事件的接收断层假设为最近的由震源机制解及破裂传播方向所确定的震源断层的产状和滑动角代替,84%的地震属于正应力减小区域(注意σ是拉张为正)
Figure 13. Probability density function and cumulative distribution function for stress transferred from major previous earthquakes and calculated at each hypocenter of the relocated events of the Yangbi sequence until 23 May 2021
The source fault of the nearest CMT event was used as the receiver fault for a given hypocenter. As a result,84% of earthquakes fall within the area of decreased normal stress (notes σ is positive for extension)
表 1 漾濞地震序列主要地震的矩张量和断层破裂方向的反演结果,以及由应力场模式和震源机制解得出的所需额外库仑破坏应力ΔCFS (详见第四节)
Table 1 Results of moment tensor inversion and rupture directivities for major earthquakes of the Yangbi earthquake sequence,required additional Coulomb failure stress ΔCFS at the source points derived from stress pattern and focal mechanism solutions (see section 4 for details)
No. 发震时间(BJT) MW H
/km断层破裂
方向节面Ⅰ
ΔCFS
/MPa节面Ⅱ
ΔCFS
/MPa节面Ⅰ 节面Ⅱ 年-月-日 时:分 走向/° 倾角/° 滑动角/° 走向/° 倾角/° 滑动角/° 1 2021-05-19 20:05 4.57 5.7 SW 5.35 12.48 49 88 16 −42 74 178 2* 2021-05-21 21:21 5.21 6.3 NE 3.31 23.32 212 71 −29 −48 63 −159 3 2021-05-21 21:48 6.05 5.4 SE 13.82 2.33 137 76 −168 45 78 −14 4 2021-05-21 22:15 4.32 3.4 SW 2.60 6.78 49 80 −4 139 86 −170 5 2021-05-21 22:31 5.03 9.0 NE 5.01 32.88 43 72 −43 148 50 −156 6 2021-05-21 23:23 4.42 5.3 SW 0.03 26.05 216 88 8 126 82 178 7 2021-05-22 00:51 4.20 5.7 SE 29.02 0.92 −54 89 −70 216 80 −1 8 2021-05-22 09:48 4.14 4.3 SE 14.23 2.18 −47 82 −168 78 78 −8 *CLVD=14%,DC=86%。节面Ⅰ为本研究推测的震源断层。  下载: 导出CSV
-
常祖峰,常昊,臧阳,代博洋. 2016. 维西—乔后断裂新活动特征及其与红河断裂的关系[J]. 地质力学学报,22(3):517–530. doi: 10.3969/j.issn.1006-6616.2016.03.009 Chang Z F,Chang H,Zang Y,Dai B Y. 2016. Recent active features of Weixi-Qiaohou fault and its relationship with the Honghe fault[J]. Journal of Geomechanics,22(3):517–530 (in Chinese).
邓起东, 冉勇康, 杨晓平, 闵伟, 楚全芝. 2007. 中国活动构造图1:400万[M]. 北京: 地震出版社: 1. Deng Q D, Ran R K, Yang X P, Min W, Chu Q Z. 2007. Active Structure Map of China[M]. Beijing: Seismological Press: 1 (in Chinese).
胡家富,苏有锦,朱雄关,陈赟. 2003. 云南的地壳S波速度与泊松比结构及其意义[J]. 中国科学:D辑,(8):714–722. Hu J F,Su Y J,Zhu X G,Chen Y. 2005. S-wave velocity and Poisson’s ratio structure of crust in Yunnan and its implication[J]. Science in China:Series D,48(2):210–218. doi: 10.1360/03yd0062
雷兴林,苏金蓉,王志伟. 2020. 四川盆地南部持续增长的地震活动及其与工业注水活动的关联[J]. 中国科学:地球科学,50(11):1505–1532. doi: 10.1360/N072020-0045 Lei X L,Su J R,Wang Z W. 2020. Growing seismicity in the Sichuan basin and its association with industrial activities[J]. Science China Earth Sciences,63(11):1633–1660. doi: 10.1007/s11430-020-9646-x
林元武. 1993. 红河断裂带北段温泉水循环深度与地震活动性的关系探讨[J]. 地震地质,15(3):193–206. Lin Y W. 1993. A discussion on the relation of circulation depth of spring water to seismic activity on the northern segment of the Honghe fault zone[J]. Seismology and Geology,15(3):193–206 (in Chinese).
上官志冠. 1988. 滇西实验场区主要活动断裂地球化学特征[J]. 地震地质,10(4):134–142. Shangguan Z G. 1988. Geochemical characteristics of the main active faults in Western Yunnan Earthquake Prediction Test Site[J]. Seismology and Geology,10(4):134–142 (in Chinese).
苏广利,畅柳,许明元. 2018. 基于精密水准的云南地区垂直运动特征分析[J]. 地震地质,40(6):1380–1389. Su G L,Chang L,Xu M Y. 2018. The analysis of vertical motion characteristics in Yunnan area based on precise leveling[J]. Seismology and Geology,40(6):1380–1389 (in Chinese).
孙庆山,李乐. 2020. 利用重复微震估算红河断裂带北段深部滑动速率[J]. 地球物理学报,63(2):478–491. doi: 10.6038/cjg2020N0026 Sun Q S,Li L. 2020. Deep slip rates along the northern segment of the Red River fault zone estimated from repeating microearthquakes[J]. Chinese Journal of Geophysics,63(2):478–491 (in Chinese).
向宏发,虢顺民,冉勇康,李祥根,张靖,陈铁牛,张国伟. 1986. 滇西北地区的现代构造应力场[J]. 地震地质,8(1):15–23. Xiang H F,Guo S M,Ran Y K,Li X G,Zhang J,Chen T N,Zhang G W. 1986. Recent tectonic stress field in the northwest of the Yunnan Province[J]. Seismology and Geology,8(1):15–23 (in Chinese).
谢富仁,刘光勋,梁海庆. 1994. 滇西北及邻区现代构造应力场[J]. 地震地质,16(4):329–338. Xie F R,Liu G X,Liang H Q. 1994. Recent tectonic stress field in northwest Yunnan Province and its adjacent areas[J]. Seismology and Geology,16(4):329–338 (in Chinese).
颜鹍,李如陶,李四海. 1997. 滇西地震预报实验场区温泉地球化学与断裂活动的关系[J]. 大地构造与成矿学,21(2):129–136. Yan K,Li R T,Li S H. 1997. The relationship between tectonic activities and geochemistry of hot springs in Western Yunnan Earthquake Study Test Site[J]. Geotectonica et Metallogenia,21(2):129–136 (in Chinese).
赵小艳,付虹. 2014. 2013年洱源MS5.5和MS5.0地震发震构造识别[J]. 地震学报,36(4):640–650. Zhao X Y,Fu H. 2014. Seismogenic structure identification of the 2013 Eryuan MS5.5 and MS5.0 earthquake sequence[J]. Acta Seismologica Sinica,36(4):640–650 (in Chinese).
郑秀芬,欧阳飚,张东宁,姚志祥,梁建宏,郑洁. 2009. “国家数字测震台网数据备份中心” 技术系统建设及其对汶川大地震研究的数据支撑[J]. 地球物理学报,52(5):1412–1417. doi: 10.3969/j.issn.0001-5733.2009.05.031 Zheng X F,Ouyang B,Zhang D N,Yao Z X,Liang J H,Zheng J. 2009. Technical system construction of Data Backup Centre for China Seismograph Network and the data support to researches on the Wenchuan earthquake[J]. Chinese Journal of Geophysics,52(5):1412–1417 (in Chinese).
Allen C R,Gillespie A R,Han Y,Sieh K E,Zhang B C,Zhu C N. 1984. Red River and associated faults,Yunnan Province,China:Quaternary geology,slip rates,and seismic hazard[J]. Geol Soc Am Bull,95(6):686–700. doi: 10.1130/0016-7606(1984)95<686:RRAAFY>2.0.CO;2
Cesca S,Heimann S,Dahm T. 2010. Rapid directivity detection by azimuthal amplitude spectra inversion[J]. J Seismol,15(1):147–164. doi: 10.1007/s10950-010-9217-4
Dziewonski A,Hales A,Lapwood E. 1975. Parametrically simple Earth models consistent with geophysical data[J]. Phys Earth Planet Inter,10(1):12–48. doi: 10.1016/0031-9201(75)90017-5
Enescu B,Ito K. 2005. The 1998 Hida Mountain,Central Honshu,Japan,earthquake swarm:Double-difference event relocation,frequency-magnitude distribution and Coulomb stress changes[J]. Tectonophysics,409(12/3/4):147–157. doi: 10.1016/j.tecto.2005.08.013
Etchecopar A,Vasseur G,Daignieres M. 1981. An inverse problem in microtectonics for the determination of stress tensors from fault striation analysis[J]. J Struct Geol,3(1):51–65. doi: 10.1016/0191-8141(81)90056-0
Gephart J W,Forsyth D W. 1984. An improved method for determining the regional stress tensor using earthquake focal mechanism data:Application to the San Fernando earthquake sequence[J]. J Geophys Res:Solid Earth,89(B11):9305–9320. doi: 10.1029/JB089iB11p09305
Hardebeck J L,Michael A J. 2006. Damped regional-scale stress inversions:Methodology and examples for southern California and the Coalinga aftershock sequence[J]. J Geophys Res:Solid Earth,111(B11):B11310.
Jones L M,Wang B,Xu S,Fitch T J. 1982. The foreshock sequence of the February 4,1975,Haicheng earthquake (M=7.3)[J]. J Geophys Res:Solid Earth,87(B6):4575–4584. doi: 10.1029/JB087iB06p04575
Kato A,Fukuda J,Nakagawa S,Obara K. 2016. Foreshock migration preceding the 2016 MW7.0 Kumamoto earthquake,Japan[J]. Geophys Res Lett,43(17):8945–8953. doi: 10.1002/2016GL070079
Lei X L,Xie C D,Fu B H. 2011. Remotely triggered seismicity in Yunnan,southwestern China,following the 2004 MW9.3 Sumatra earthquake[J]. J Geophys Res:Solid Earth,116:B08303.
Leonard M. 2010. Earthquake fault scaling:Self-consistent relating of rupture length,width,average displacement,and moment release[J]. Bull Seismol Soc Am,100(5A):1971–1988. doi: 10.1785/0120090189
Matsumoto K,Sato T,Takanezawa T,Ooe M. 2001. GOTIC2:A program for computation of oceanic tidal loading effect[J]. J Geod Soc Jpn,47(1):243–248.
Morris A,Ferrill D A,Brent Henderson D B. 1996. Slip tendency analysis and fault reactivation[J]. Geology,24(3):275–278. doi: 10.1130/0091-7613(1996)024<0275:STAAFR>2.3.CO;2
Okada Y. 1992. Internal deformation due to shear and tensile faults in a half-space[J]. Bull Seismol Soc Am,82(2):1018–1040.
Peng G, Lei X, Wang G, Jiang F. 2021. Precursory tidal triggering and b value variation before the 2011 MW5.1 and 5.0 Tengchong, China earthquakes[J]. Earth Planet Sci Lett, 574. doi: 10.1016/j.jpgl.2021.117167.
Savage J C,Burford R O. 1973. Geodetic determination of relative plate motion in central California[J]. J Geophys Res,78(5):832–845. doi: 10.1029/JB078i005p00832
Scholz C. 1977. A physical interpretation of the Haicheng earthquake prediction[J]. Nature,267(5607):121–124. doi: 10.1038/267121a0
Somerville P G,McLaren J P,LeFevre L V,Burger R W,Helmberger D V. 1987. Comparison of source scaling relations of eastern and western North American earthquakes[J]. Bull Seismol Soc Am,77(2):322–346. doi: 10.1785/BSSA0770020322
Tanaka S,Ohtake M,Sato H. 2002. Spatio-temporal variation of the tidal triggering effect on earthquake occurrence associated with the 1982 South Tonga earthquake of MW7.5[J]. Geophys Res Lett,29(16):3-1–3-4. doi: 10.1029/2002GL015386
Waldhauser F,Ellsworth W L. 2000. A double-difference earthquake location algorithm:Method and application to the northern Hayward fault,California[J]. Bull Seismol Soc Am,90(6):1353–1368. doi: 10.1785/0120000006
Wang M,Shen Z K. 2020. Present-day crustal deformation of continental China derived from GPS and its tectonic implications[J]. J Geophys Res:Solid Earth,125(2):e2019JB018774.
Xie C D,Lei X L,Zhao X Y,Ma Q B,Yang S M,Wang Y N. 2017. Tidal triggering of earthquakes in the Ning’er area of Yunnan Province,China[J]. J Asian Earth Sci,138:477–483. doi: 10.1016/j.jseaes.2017.02.029
Xu Y,Koper K D,Burlacu R,Herrmann R B,Li D N. 2020. A new uniform moment tensor catalog for Yunnan,China,from January 2000 through December 2014[J]. Seismol Res Lett,91(2A):891–900. doi: 10.1785/0220190242
Yang Y,Yao H J,Wu H X,Zhang P,Wang M M. 2020. A new crustal shear-velocity model in Southwest China from joint seismological inversion and its implications for regional crustal dynamics[J]. Geophys J Int,220(2):1379–1393.
Zhang X,Sanderson D J. 1996. Numerical modelling of the effects of fault slip on fluid flow around extensional faults[J]. J Struct Geol,18(1):109–119. doi: 10.1016/0191-8141(95)00086-S
Zhu L P,Ben-Zion Y. 2013. Parametrization of general seismic potency and moment tensors for source inversion of seismic waveform data[J]. Geophys J Int,194(2):839–843. doi: 10.1093/gji/ggt137
-
期刊类型引用(2)
1. 武晔,赵晓燕,石砚斌,俞子钊,何欣娟,胡泊,熊仲华. 伪谱算法在声波数值模拟中的数值频散分析. 地震. 2017(02): 135-146 .  百度学术
百度学术
2. 曹丹平,周建科,印兴耀. 三角网格有限元法波动模拟的数值频散及稳定性研究. 地球物理学报. 2015(05): 1717-1730 . 百度学术
其他类型引用(3)


计量
- 文章访问数: 2127
- HTML全文浏览量: 1035
- PDF下载量: 465
- 被引次数: 5
