

Parameter estimation of ground-motion prediction model in Longmenshan region based on strong motion data
-
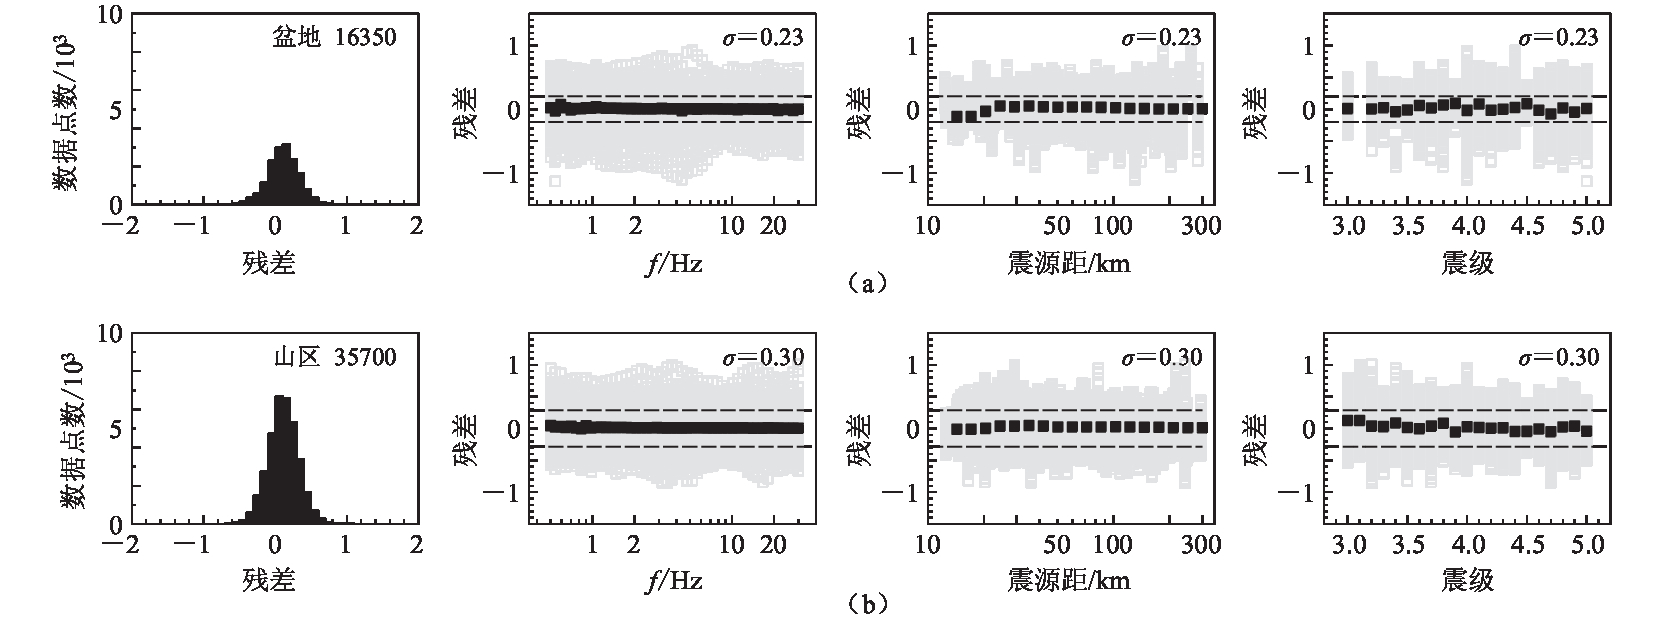
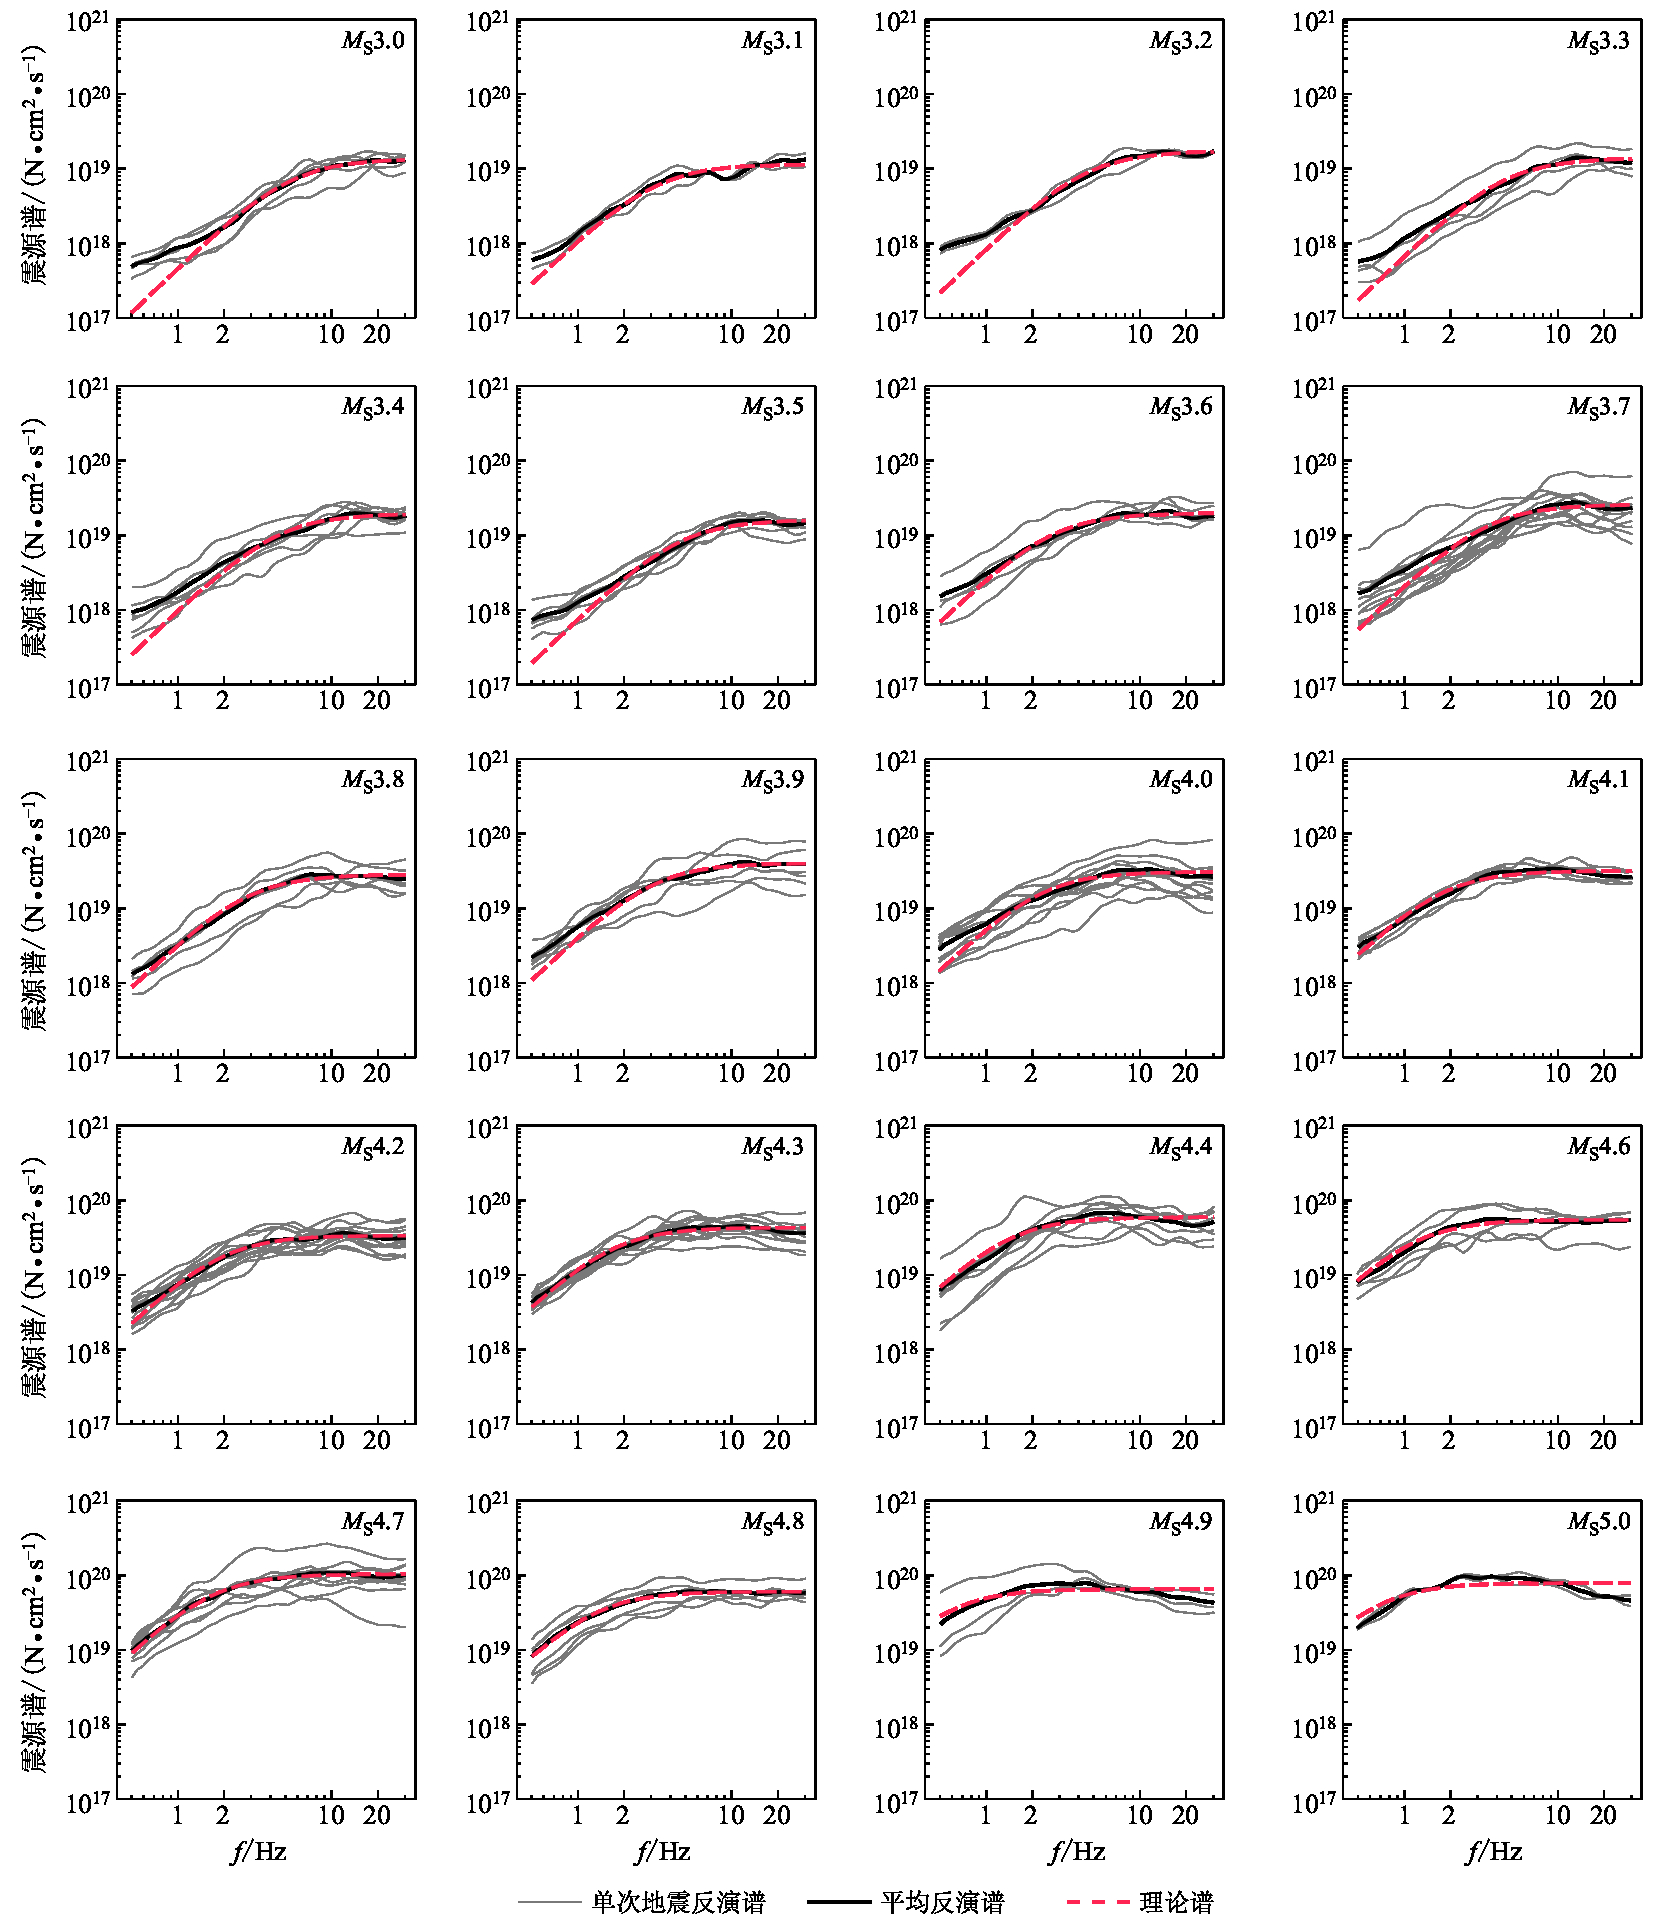
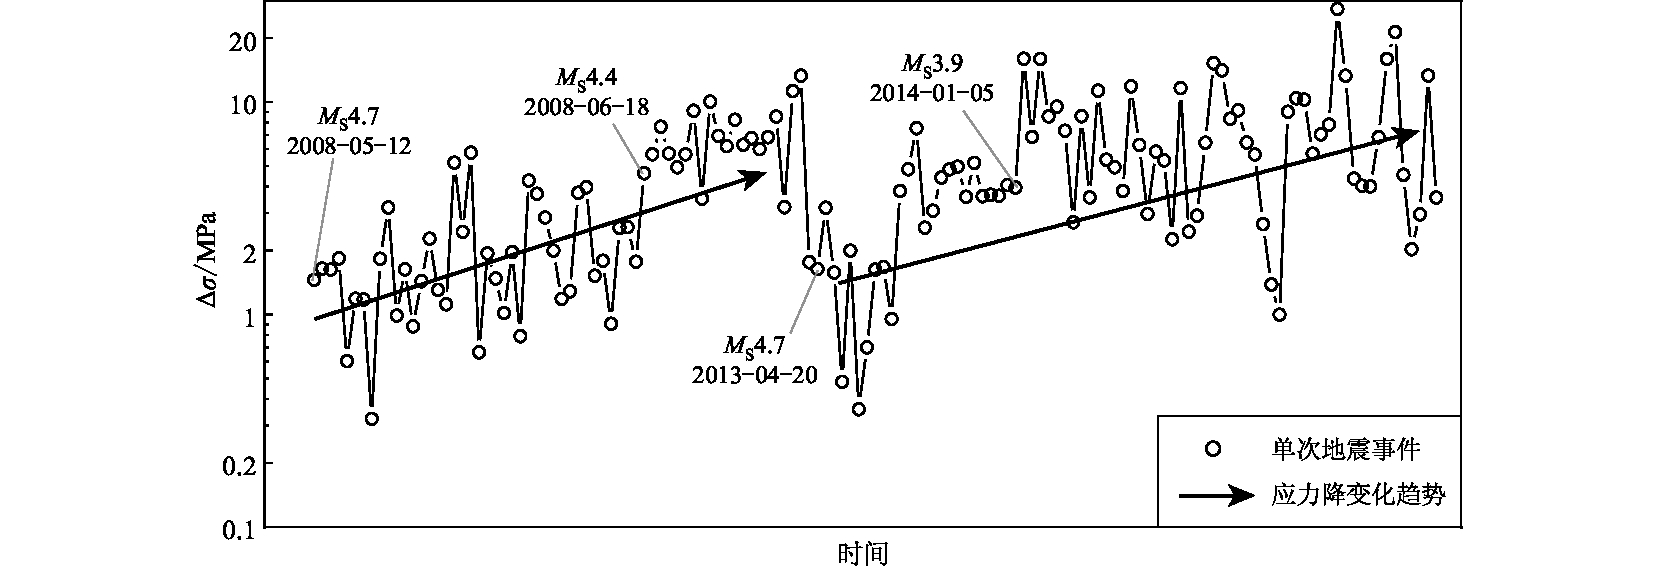
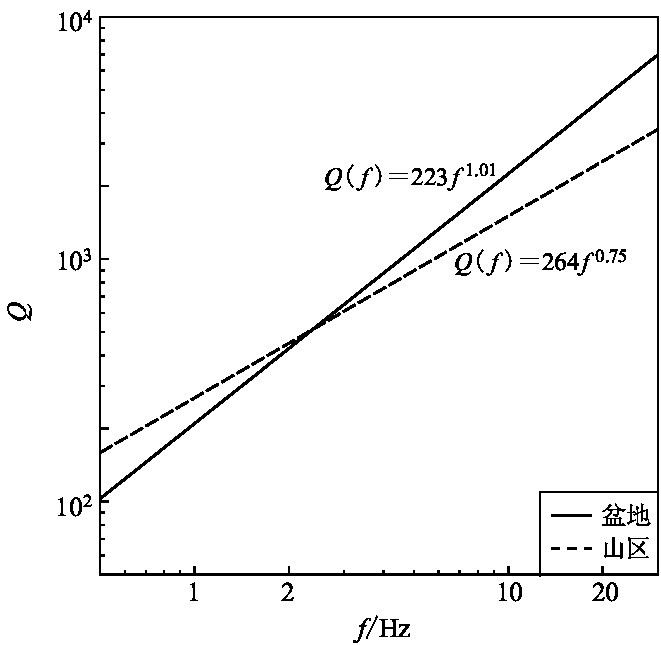
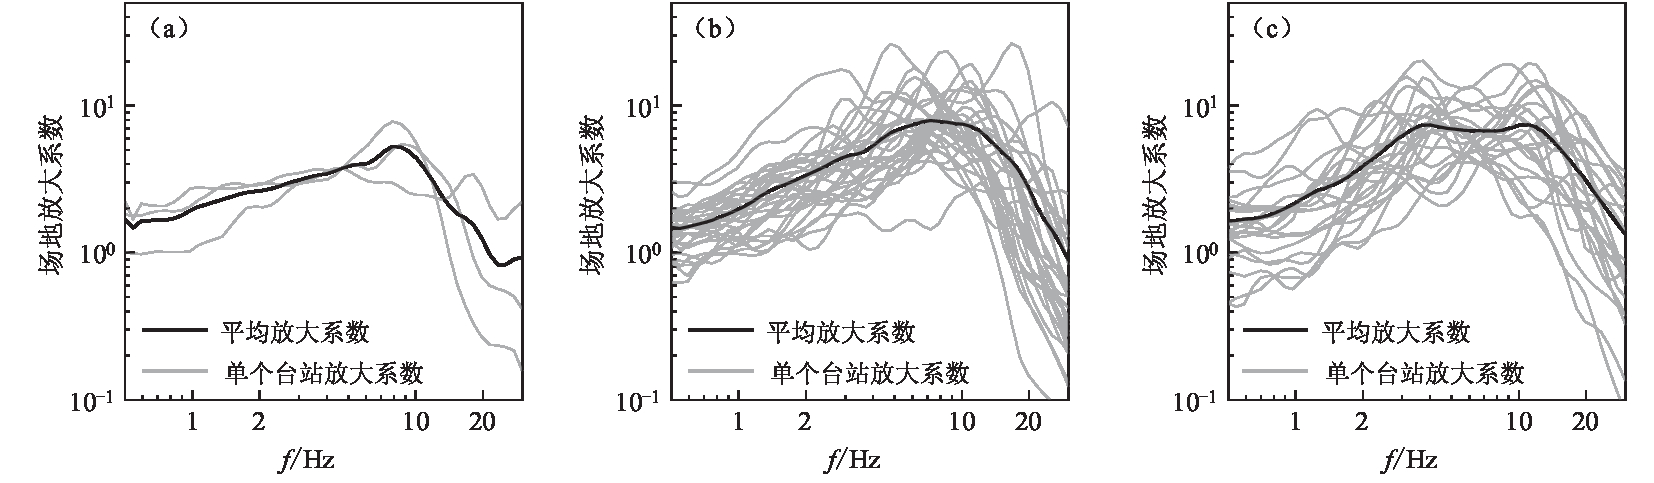
摘要: 基于2008—2015年龙门山地区的强震动记录,采用广义线性反演法计算了龙门山地区的震源参数、品质因子以及83个强震动台站的局部场地放大系数。结果显示:芦山地震发生之前,汶川地震余震的应力降随时间的增加而逐渐增大;芦山地震发生之后,龙门山断裂带上余震的应力降明显减小,并在之后随时间呈缓慢增大的趋势;部分MS≥4.7余震事件的加速度震源谱中出现明显的高频衰减现象。通过对应力降随时间变化规律的分析认为,这种高频衰减现象可能与震级大小和震源破裂滑动的最大速率有关。此外,反演得到了山区和盆地地区的品质因子分别为Q( f )=264 f 0.75和Q( f )=223 f 1.01;同时获取了龙门山地区83个强震动台站的局部场地放大系数,并计算了基于NGA场地分类标准的A类、 B类和C类场地的平均场地放大系数。结果显示,以上3类场地的平均场地放大系数具有相似的峰值,但是随着场地趋于软弱,峰值平台区向低频部分发育。Abstract: Based on generalized linear inversion scheme, strong motion data recorded from 2008 to 2015 is used to estimate source parameters, quality factor and local site amplification coefficient of 83 strong motion observation stations of Longmenshan region. The result shows that the stress drops of Wenchuan aftershocks tended to increase with time before occurrence of Lushan main shock, after which the stress drops of aftershocks decreased noticeably and then increased slowly with time. Furthermore, a significant high-frequency attenuation phenomenon was observed in source spectra of some aftershocks with MS≥4.7. According to analyses on the temporal evolution tendency of stress drop, it is inferred that the phenomenon may be related with magnitude and the maximal source rupture slip rate of individual event. As a result, the quality factor of mountain and basins inverted in this study is Q( f )=264 f 0.75 and Q( f )=223 f 1.01, respectively. Finally, the obtained site amplification coefficients of 83 strong motion observation stations are classified into NGA site class A, B and C, and the average site amplification coefficients of the three site classes are calculated. The results indicate that the peak amplification coefficients of the three site classes are similar, and the peak platforms tend to develop to lower frequencies as the site becomes softer.
-
中国地震台网(2022)测定2022年9月5日12时52分四川泸定县(29.59°N, 102.08°E)发生MS6.8地震,震源深度为16 km。本次地震震中位于鲜水河断裂带(徐泰然等,2022),该断裂带北起甘孜东谷附近,向南经过炉霍、道孚、康定一线,至石棉县安顺场一带逐渐消失,全长约350 km,总体走向320°—330°,呈略向北凸出的弧形,与甘孜—玉树断裂共同构成川滇地块的北边界和巴颜喀拉地块的西南边界。鲜水河断裂带作为中国西南山区现今活动强烈的大型左旋走滑断裂带,具有规模大、活动强、地震频度高等特点(陈桂华等,2008)。自1700年以来,该断裂带发生过8次(泸定地震不计算在内)M≥7地震(图1中的红色圆点所示)。泸定地震则位于鲜水河断裂带南东段附近,与1786年发生的M7.8地震位置接近。快速测定这次地震的震源机制和地震辐射能量对研究该地震的发震构造和破坏能力有重要意义。
![]() 图 1 2022年泸定MS6.8地震的矩张量红色圆点为1 700年以来的8次M≥7.0地震,蓝色三角形为本文测定震源机制所使用的台站Figure 1. Moment tensor of the 2022 Luding MS6.8 earthquakeRed dots are the location of eight M≥7.0 earthquakes in the past 1 700 years,blue triangles are the location of the stations used in the determination of focal mechanism in this paper
图 1 2022年泸定MS6.8地震的矩张量红色圆点为1 700年以来的8次M≥7.0地震,蓝色三角形为本文测定震源机制所使用的台站Figure 1. Moment tensor of the 2022 Luding MS6.8 earthquakeRed dots are the location of eight M≥7.0 earthquakes in the past 1 700 years,blue triangles are the location of the stations used in the determination of focal mechanism in this paper本文利用近震全波形反演方法(Chiang et al,2016)求取矩心矩张量解,该方法基于点源模型,在时间域上利用广义最小二乘法(Minson,Dreger,2008)对三分量完整波形进行反演,继而利用能流密度法(Newman,Okal,1998)测定地震辐射能量ER。
泸定地震震级较大,考虑到震中距较小的台站存在限幅情况、震中距较大的台站存在数据质量问题,我们选取国家测震台网数据备份中心(郑秀芬等,2009)提供的震中距处于158—327 km内13个高质量台站(图1蓝色三角形所示)的记录进行反演。数据预处理时滤波频段选取为0.02—0.05 Hz,震源深度的搜索范围为6—13 km,步长为1 km。本文使用频率-波数法计算1 Hz理论格林函数(Wang,Herrmann,1980;Herrmann,Wang,1985;Herrmann,2013),使用Xin等(2019)提供的中国大陆一维地壳速度模型(图2)。拟合度最大值对应的深度为矩心深度,矩心深度对应的结果即为本文最终测定的震源机制解。图3是拟合度与矩心深度的关系,由该图可以确定矩心深度为9 km,拟合度达70%以上。该深度所对应的震源机制解节面Ⅰ的走向为77°,倾角为83°,滑动角为178°;节面Ⅱ的走向为347°,倾角为88°,滑动角为−7°;地震矩为1.3×10¹⁹ N·m,折合为矩震级MW6.7。图4为矩心深度为9 km时实际波形与理论波形的对比图,可见所有台站的平均拟合度为71%,拟合程度较高,可被看作可靠的结果。
![]() 图 2 泸定MS6.8地震震源区的一维速度模型(数据来自于Xin et al,2019)Figure 2. One-dimensional velocity model of source area of Luding MS6.8 earthquake (data from Xin et al,2019)
图 2 泸定MS6.8地震震源区的一维速度模型(数据来自于Xin et al,2019)Figure 2. One-dimensional velocity model of source area of Luding MS6.8 earthquake (data from Xin et al,2019)![]() 图 3 泸定MS6.8地震震源矩心深度拟合结果红色圆点为拟合度值,蓝色圆点为矩震级MWFigure 3. The fitting result of focal centroid depth of Luding MS6.8 earthquakeThe red dot is the fitting degree,and the blue dot is MW
图 3 泸定MS6.8地震震源矩心深度拟合结果红色圆点为拟合度值,蓝色圆点为矩震级MWFigure 3. The fitting result of focal centroid depth of Luding MS6.8 earthquakeThe red dot is the fitting degree,and the blue dot is MW![]() 图 4 泸定MS6.8地震最佳拟合矩心深度为9.0 km时的波形拟合Δ为震中距,θ为方位角,TS为时延+20 s,VR为理论波形(红色)与实际波形(黑色)的拟合度Figure 4. Waveform fitting with the best fitting centroid depth of 9.0 km for the Luding MS6.8 earthquakeΔ is the epicentral distance,θ is the azimuth,TS is the time delay plus 20 s,and VR is a parameter describing the fitting degree of the theoretical waveform (red) and the actual waveform (black)
图 4 泸定MS6.8地震最佳拟合矩心深度为9.0 km时的波形拟合Δ为震中距,θ为方位角,TS为时延+20 s,VR为理论波形(红色)与实际波形(黑色)的拟合度Figure 4. Waveform fitting with the best fitting centroid depth of 9.0 km for the Luding MS6.8 earthquakeΔ is the epicentral distance,θ is the azimuth,TS is the time delay plus 20 s,and VR is a parameter describing the fitting degree of the theoretical waveform (red) and the actual waveform (black)表1给出了国内外不同机构和作者关于泸定地震的震源机制解结果(防灾科技学院河北省地震动力学重点实验室Seismology小组,2022),以及本文结果与这些震源机制解的最小空间旋转角,在此基础上本文给出了泸定地震的震源机制解(图5)。表1显示,本文结果与其它结果的最小空间旋转角为4.5°,最大空间旋转角为24.2°,且基本集中在20°以下。Kagan (1991)指出最小空间旋转角小于20°时可以认为是相同的震源机制,因此结合表1和图5可知本文结果与其他机构或者作者的结果较一致。
表 1 不同机构和作者给出的泸定地震震源机制解Table 1. Focal mechanism solutions of Luding earthquake given by different organizations and authors序号 机构或作者 震源机制解 本文结果与相应结果的
最小空间旋转角/°走向/° 倾角/° 滑动角/° 1 USGS 159 82 −4 14.5 2 GCMT 163 80 8 9.2 3 GFZ 164 85 6 4.5 4 IPGP 163 71 −3 19.8 5 四川地震台 172 74 27 24.2 6 中国地震台网中心 343 79 9 21.3 7 王卫民 166 75 0 14.7 8 郭祥云 335 74 −15 22.6 9 韩立波和蒋长胜 343 89 −34 17.8 注:USGS:美国地质调查局;GCMT:美国哥伦比亚大学全球矩心矩张量解中心;GFZ:亥姆霍兹波茨坦中心;IPGP:法国巴黎地
球物理学院。表中震源机制数据引自防灾科技学院河北省地震动力学重点实验室Seismology小组(2022)。根据本次地震震源附近的地质构造,结合本次地震破裂面较深的特点,可知泸定地震是巴颜喀拉地块在向东挤压受到四川盆地阻挡后向南侧挤压的物理过程中产生的高倾角左旋走滑型地震。
从地震学合作研究协会(Incorporated Research Institutions for Seismology,缩写为IRIS)网站下载25个台站(图6a)的宽频带波形数据,这些地震台的震中距范围为11°—58°。使用之前得到的震源机制对地震辐射能量测定结果进行修正,将修正后所有台站的地震辐射能量平均值作为该事件的辐射能量,依此得到本次地震的辐射能量ER为4.1×10¹⁴ J,高频(0.5—2 Hz)辐射能量ERH为5.45×10¹³ J,能量震级Me约为6.8,标准差为0.34。图6b为单台能量震级的偏差统计图,可知每个台站的能量震级稳定分布在6.2—7.4之间。由于地震以地震波形式辐射的能量主要集中在震源谱的拐角频率附近,高频(0.5—2 Hz)辐射能量ERH对于分析一个地震的破坏能力很有价值,经由本次地震与2013年4月20日芦山MS7.0地震的对比得以证明。
![]() 图 6 单台能量震级及其平均值偏差(a)和残差分布(b)Figure 6. Single station energy magnitude and its average deviation (a) and residual distribution (b)
图 6 单台能量震级及其平均值偏差(a)和残差分布(b)Figure 6. Single station energy magnitude and its average deviation (a) and residual distribution (b)2013年4月20日的芦山MS7.0地震破坏严重,与本次地震仅相距116 km。中国地震局(2013)和应急管理部(2022)通过地震现场工作队实地调查,并充分参考震区断裂构造、仪器烈度、余震分布、震源机制、无人机遥感等科技支撑成果,结合强震动观测记录,分别确定了这两次地震的烈度分布。芦山地震的最高烈度为Ⅸ度,Ⅸ度烈度区的长半轴为11.5 km,短半轴为5.5 km,面积为208 km2,Ⅵ度及以上烈度区的总面积为18 682 km2;泸定地震的最高烈度为Ⅸ度,面积为280 km2,等震线长轴呈NW走向,Ⅵ度及以上烈度区面积为19 089 km2。泸定地震的Ⅸ度区的面积较芦山地震大72 km2,Ⅵ度及以上烈度区面积大407 km2,所造成的灾害更为严重。而从表2所示的两次地震的面波震级MS、矩震级MW、地震辐射能量ER和高频地震辐射能量ERH的对比来看,芦山地震的面波震级MS比泸定地震大0.2,矩震级MW和地震辐射能量ER十分接近,这几个参数均无法解释泸定地震产生的破坏更为严重,但从高频地震辐射能量ERH来看,泸定地震明显大于芦山地震,这与泸定地震面波震级低受灾情况却更为严重的情况相符。因此,地震辐射能量ER能够反映震源动态特征,与地震震源的动力学特性(如地震波频率、地震波速度等)密切相关,更适合表征地震的破坏能力,因此高频地震辐射能量ERH可作为量化地震破坏能力的参数。
表 2 2013年4月20日芦山MS7.0地震与2022年9月5日泸定MS6.8地震的地震参数对比Table 2. Comparison of seismic parameters between the Lushan MS7.0 earthquake on April 20,2013 and the Luding MS6.8 earthquake on September 5,2022发震时间 发震地点 MS MW 地震辐射能量ER/(1014 J) 高频地震辐射能量ERH/(1014 J) 2013-04-20 四川芦山 7.0 6.6 4.3 4.8 2022-09-05 四川泸定 6.8 6.7 4.1 5.5 使用Convers和Newman (2013)的方法计算破裂持续时间T,选取所有台站的中位数可得这次地震的破裂持续时间为16 s。依据Bormann和Saul (2009)关于矩震级MW与平均破裂持续时间Tavg的经验关系lgTavg=0.6MW-2.8将本次地震的矩震级MW6.7代入得到该震级对应的平均破裂持续时间为17 s,即泸定地震的破裂持续时间短于平均破裂持续时间。
能矩比(地震辐射能量与地震矩的比值ER/M0,也称为折合能量)是衡量震源释放地震波能力的重要参数。使用本文结果计算的泸定地震能矩比约为3.1×10−5,与全球走滑型地震平均能矩比3.6×10−5 (Convers,Newman,2011)相比,泸定地震的能矩比并不突出,但是走滑型地震的能量释放能力本身就比较突出,因此泸定地震具有的破坏能力在同震级的地震中仍应当属于比较强的。
视应力可以反映地震断层释放累积能量的水平,使用本文结果得到泸定地震的视应力为0.95 MPa,高于吴忠良等(2002)利用美国国家地震信息中心宽频带辐射能量目录和全球矩心矩张量项目目录给出的中国大陆西部地区视应力的平均值0.8 MPa,说明此次地震的地震断层释放出了较强的能量。
Baltay等(2011)对日本M1.8—6.9地震序列进行了基于经验格林函数的尾波分析,得到了布龙应力降$\Delta \sigma $与视应力$\sigma_{\rm{app}} $的经验关系$\Delta\sigma/\sigma_{\rm{app}}=4.3 $ (Singh,Ordaz,1994)适用于拐角频率较低的中强震(MW≥5.0),本文根据视应力σapp结果得出泸定地震的布龙应力降约为4.09 MPa。
Ye等(2018)计算了全球MW>7.0地震的辐射能量增强因子REEF值,得到了区域性的统计规律,这些地震的REEF值范围在5—150之间。本次测定泸定地震的REEF值为49,属于正常范围。大量测定中国大陆中强震的REEF值,并结合地震的实际情况进行综合分析,可能会得到一些有意义的统计规律,这还有待使用更多震例进行研究。
本文使用宽频带波形数据对2022年9月5日泸定MS6.8地震的震源辐射能量和震源机制进行测定,并计算了一些衍生的参数,对结果进行分析和讨论后,得到以下结论:
1) 使用区域波形数据,采用近震时域全波形反演方法得到泸定地震的地震矩为1.3×10¹⁹ N·m,转化为矩震级为MW6.7,矩心深度约为9 km,震源机制解节面Ⅰ的走向为77°、倾角为83°、滑动角为178°,节面Ⅱ的走向为347°、倾角为88°、滑动角为−7°。
2) 基于全球地震台网提供的波形资料,使用能流密度法测定泸定地震的辐射能量为4.1×10¹⁴ J,其中的高频部分(0.5—2 Hz)为5.5×10¹³ J,地震辐射能量转化成能量震级为6.8,震源破裂时间为16 s。与2013年4月20日的芦山MS7.0地震的对比说明:对于地震灾害和风险评估,测定地震辐射能量及其在频谱上的分布、破裂持续时间等动态震源参数是十分必要的。根据上面的分析,可认为本次地震短时间内释放出了大量的地震能量,是破坏能力较强的地震。
3) 计算得出本次地震的能矩比为3.1×10⁻⁵,视应力为0.95 MPa,布龙应力降约为4.09 MPa,可以认为本次地震的能量释放效率较高。结合静态震源参数地震矩M0、动态地震参数地震辐射能量ER和破裂持续时间T以及震源附近的介质属性参数如密度ρ和S波速度得出描述震源破裂复杂程度的辐射能量增强因子REEF为49。
地震矩等静态震源参数主要与地震波的低频成分有关,在构造动力学研究中具有重要意义;地震辐射能量等动态震源参数主要与地震波的高频成分有关,在工程地震学研究中具有重要意义。联合测定地震矩和地震辐射能量,对于研究区域构造、快速评估地震灾害、开展地震应急响应工作都具有重要意义。
-
![]()
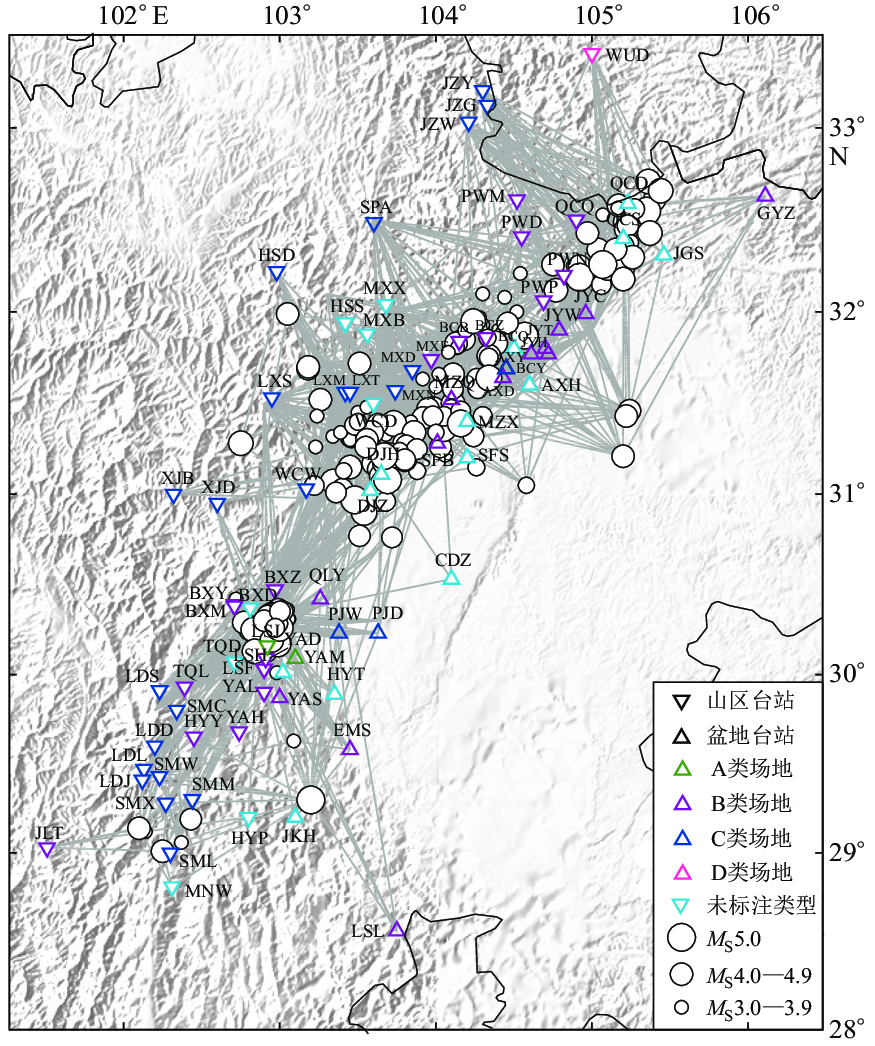
图 1 强震动台站和地震事件的地理位置
Figure 1. Geographical location of selected strong motion stations and events
![]()
图 2 盆地地区(a)和山区(b)的残差及其标准差σ
Figure 2. The residual and standard derivation σ of basin area (a) and mountainous area (b)
![]()
图 3 3.0<MS≤5.0范围内各震级的加速度震源谱
Figure 3. Acceleration source spectra of the events with MS3.0 to 5.0
![]()
图 4 汶川地震和芦山地震余震的应力降Δσ随时间的变化趋势
Figure 4. Temporal evolution of stress drop Δσ in Wenchuan and Lushan aftershocks
![]()
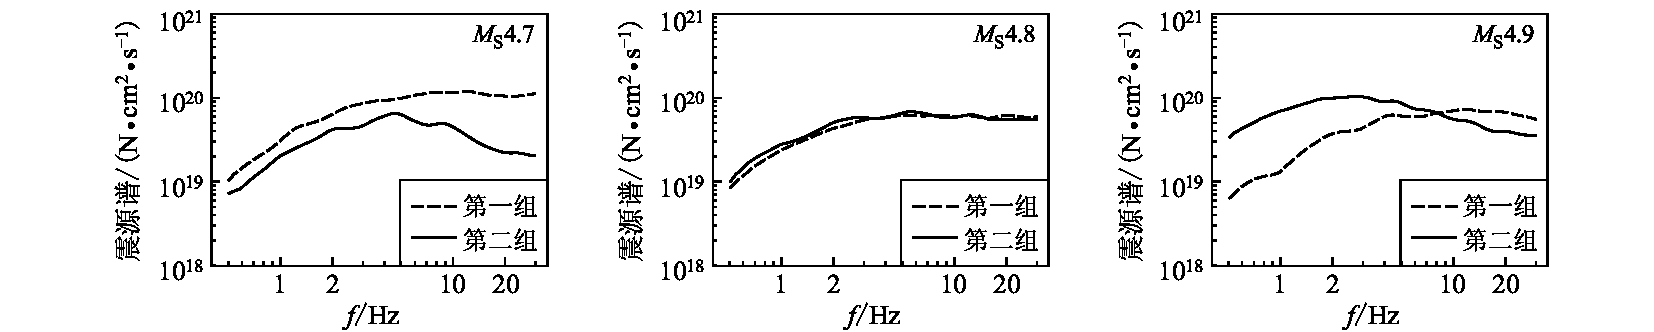
图 5 两组数据中MS4.7,4.8和4.9的平均震源谱
第一组为汶川地震和芦山地震主震发生后1个月之内的数据,第二组为其它时段内的数据
Figure 5. Average source spectrum of MS4.7,4.8 and 4.9 obtained from two datasets
Group 1 includes events occurred during the first month after the origin of Wenchuan and Lushan mainshocks,group 2 includes events occurred during other periods
![]()
图 6 第一组(a)和第二组(b)的M0-f0相关性比较,灰色区域为本文结果±1倍标准差
Figure 6. Comparison of M0-f0 correlation for the data of group 1 (a) and 2 (b),where gray areas represent the results of this study ±1 standard derivation
![]()
图 8 山区和盆地地区的品质因子Q
Figure 8. Quality factor Q obtained respectively for mountainous and basin regions
![]()
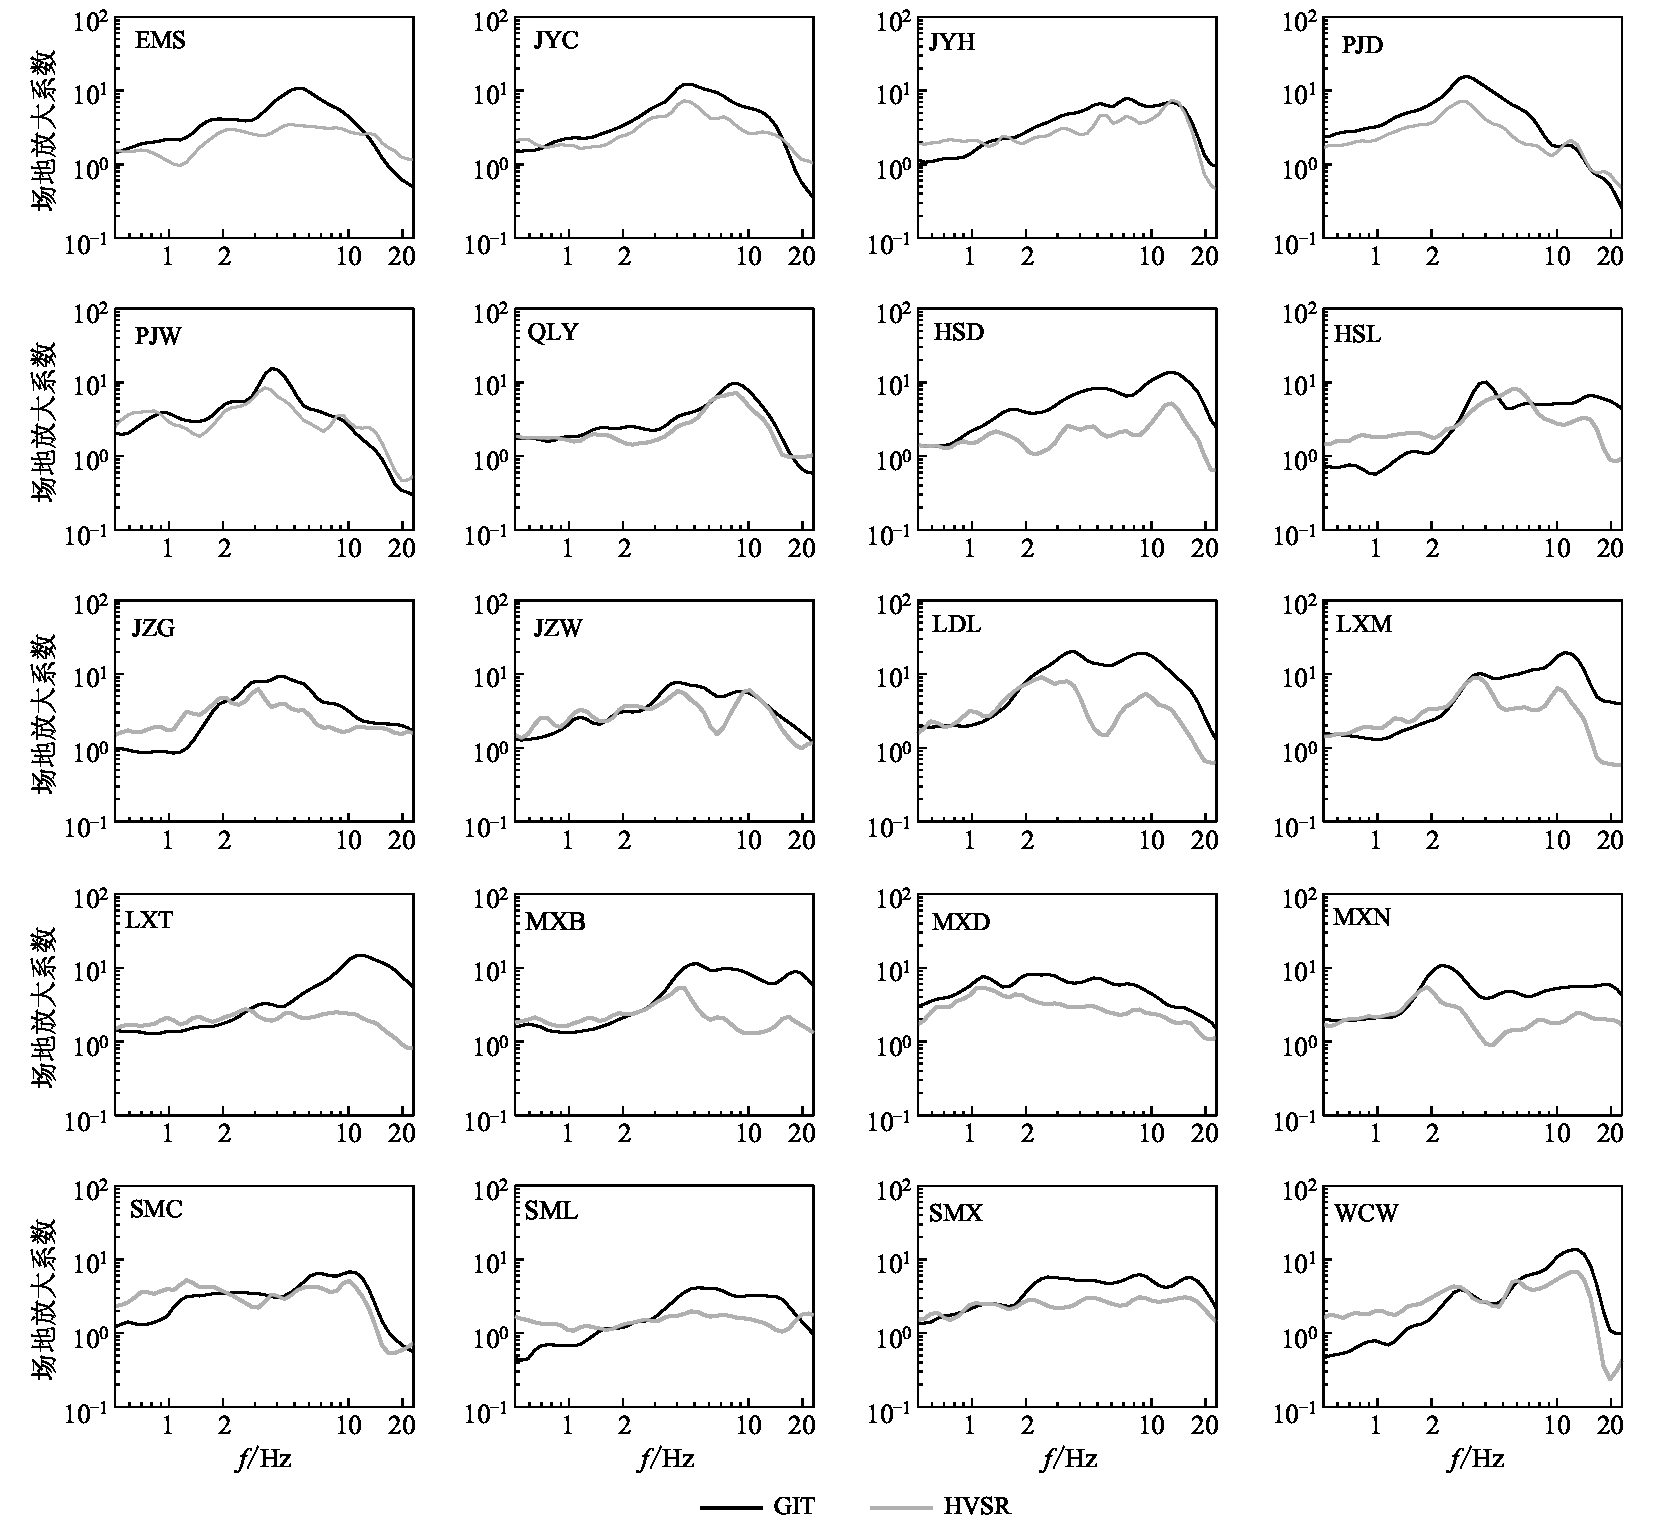
图 9 20个强震动台站的GIT与HVSR得到的结果比较
Figure 9. Local site amplification coefficients of 20 strong motion station sites obtained from GIT and HVSR
-
范军, 汪智, 陈银, 刘杰, 郑斯华, 吴朋. 2012. 四川地区震源参数和台站场地响应初步研究[J]. 四川地震, (3): 1-8. Fan J, Wang Z, Chen Y, Liu J, Zheng S H, Wu P. 2012. Preliminary study on both earthquake source parameters and site responses of seismic stations in Sichuan Province[J]. Earthquake Research in Sichuan, (3): 1-8(in Chinese).
傅磊, 李小军. 2017. 龙门山地区的kappa (κ0)模型及汶川MS8.0地震的强地震动模拟[J]. 地球物理学报, 60(8): 2935-2947. Fu L, Li X J. 2017. The kappa (κ0) model of the Longmenshan region and its application to simulation of strong ground-motion by the Wenchuan MS8.0 earthquake[J]. Chinese Journal of Geophysics, 60(8): 2935-2947(in Chinese).
华卫, 陈章立, 郑斯华. 2009. 2008年汶川8.0级地震序列震源参数分段特征的研究[J]. 地球物理学报, 52(2): 365-371. Hua W, Chen Z L, Zheng S H. 2009. A study on segmentation characteristics of aftershock source parameters of Wenchuan M8.0 earthquake in 2008[J]. Chinese Journal of Geophysics, 52(2): 365-371(in Chinese).
乔慧珍, 张永久, 程万正, 刘杰. 2006. 川西北地区介质衰减特性研究[J]. 地震地磁观测与研究, 27(4): 1-7. Qiao H Z, Zhang Y J, Cheng W Z, Liu J. 2006. The inversion of the inelastic coefficient of the medium in north-west of Sichuan Province[J]. Seismological and Geomagnetic Observation and Research, 27(4): 1-7(in Chinese).
任叶飞. 2014. 基于强震动记录的汶川地震场地效应研究[D]. 哈尔滨: 中国地震局工程力学研究所: 74–77. Ren Y F. 2014. Study on Site Effect in the Wenchuan Earthquake Using Strong Motion Recordings[D]. Harbin: Institute of Engi-neering Mechanics, China Earthquake Administration: 74–77 (in Chinese).
温瑞智, 王宏伟, 任叶飞, 冀昆. 2015. 芦山余震震源参数及震源区品质因子反演[J]. 哈尔滨工业大学学报, 47(4): 58-63. Wen R Z, Wang H W, Ren Y F, Ji K. 2015. Estimation of source parameters and quality factor based on generalized inversion method in Lushan earthquake[J]. Journal of Harbin Institute of Technology, 47(4): 58-63(in Chinese).
胥颐, 黄润秋, 李志伟, 徐亚, 刘劲松, 刘建华. 2009. 龙门山构造带及汶川震源区的S波速度结构[J]. 地球物理学报, 52(2): 329-338. Xu Y, Huang R Q, Li Z W, Xu Y, Liu J S, Liu J H. 2009. S-wave velocity structure of the Longmen shan and Wenchuan earthquake area[J]. Chinese Journal of Geophysics, 52(2): 329-338(in Chinese).
喻畑, 李小军. 2012. 汶川地震余震震源参数及地震动衰减与场地影响参数反演分析[J]. 地震学报, 34(5): 621-632. Yu T, Li X J. 2012. Inversion of strong motion data for source parameters of Wenchuan aftershocks, attenuation function and average site effect[J]. Acta Seismologica Sinica, 34(5): 621-632(in Chinese).
张永久, 乔慧珍, 程万正, 刘杰. 2007. 四川盆地地区介质衰减特征研究[J]. 地震研究, 30(1): 43-48. Zhang Y J, Qiao H Z, Cheng W Z, Liu J. 2007. Attenuation characteristics of the media in Sichuan basin region[J]. Journal of Seismological Research, 30(1): 43-48(in Chinese).
中华人民共和国住房和城乡建设部, 中华人民共和国国家质量监督检验检疫总局. 2016. GB 50011—2010建筑抗震设计规范(2016年版)[S]. 北京: 中国建筑工业出版社: 18–21. Ministry of Housing and Urban-Rural Development of the People’s Republic of China, General Administration of Quality Supervision, Inspection and Quarantine of the People’s Republic of China. 2016. GB 50011—2010 Code for Seismic Design of Buildings[S]. Beijing: China Architecture & Building Press: 18–21 (in Chinese).
Atkinson G M, Mereu R F. 1992. The shape of ground motion attenuation curves in southeastern Canada[J]. Bull Seismol Soc Am, 82(5): 2014-2031.
Atkinson G M. 2008. Ground-motion prediction equations for eastern North America from a referenced empirical approach: Implications for epistemic uncertainty[J]. Bull Seismol Soc Am, 98(3): 1304-1318.
Beresnev I A. 2001. What we can and cannot learn about earthquake sources from the spectra of seismic waves[J]. Bull Seismol Soc Am, 91(2): 397-400.
Boore D M. 2003. Simulation of ground motion using the stochastic method[J]. Pure Appl Geophy, 160(3/4): 635-676.
Brune J N. Tectonic stress and the spectra of seismic shear waves from earthquakes[J]. J Geophy Res, 75(26): 4997-5009.
Campbell K W. 2003. Prediction of strong ground motion using the hybrid empirical method and its use in the development of ground-motion (attenuation) relations in eastern North America[J]. Bull Seismol Soc Am, 93(3): 1012-1033.
Chiou B, Darragh R, Gregor N, Silva W. 2008. NGA project strong-motion database[J]. Earthq Spectra, 24(1): 23-44.
Douglas J, Edwards B. 2016. Recent and future developments in earthquake ground motion estimation[J]. Earth Sci Rev, 160: 203-219.
Fu L, Li X J. 2016. The characteristics of high-frequency attenuation of shear waves in the Longmen Shan and adjacent regions[J]. Bull Seismol Soc Am, 106(5): 1979-1990.
Hassani B, Zafarani H, Farjoodi J, Ansari A. 2011. Estimation of site amplification, attenuation and source spectra of S-waves in the East-Central Iran[J]. Soil Dyn Earthq Eng, 31(10): 1397-1413.
Konno K, Ohmachi T. 1998. Ground-motion characteristics estimated from spectral ratio between horizontal and vertical components of microtremor[J]. Bull Seismol Soc Am, 88(1): 228-241.
Li X J, Zhou Z H, Yu H Y, Wen R Z, Lu D W, Huang M, Zhou Y N, Cu J W. 2008. Strong motion observations and recordings from the great Wenchuan earthquake[J]. Earthq Eng Eng Vib, 7(3): 235-246.
Moya A, Aguirre J, Irikura K. 2000. Inversion of source parameters and site effects from strong ground motion records using genetic algorithms[J]. Bull Seismol Soc Am, 90(4): 977-992.
Paige C C, Saunders M A. 1982a. LSQR: An algorithm for sparse linear equations and sparse least squares[J]. ACM Trans Math Softw, 8(1): 43-71.
Paige C C, Saunders M A. 1982b. Algorithm 583: LSQR: Sparse linear equations and least squares problems[J]. ACM Trans Math Softw, 8(2): 195-209.
Papageorgiou A S, Aki K. 1983. A specific barrier model for the quantitative description of inhomogeneous faulting and the prediction of strong ground motion. I. Description of the model[J]. Bull Seismol Soc Am, 73(3): 693-722.
Parolai S, Bindi D, Baumbach M, Grosser H, Milkereit C, Karakisa S, Zünbül S. 2004. Comparison of different site response estimation techniques using aftershocks of the 1999 Izmit earthquake[J]. Bull Seismol Soc Am, 94(3): 1096-1108.
Ren Y F, Wen R Z, Yamanaka H, Kashima T. 2013. Site effects by generalized inversion technique using strong motion recordings of the 2008 Wenchuan earthquake[J]. Earthquake Engineering and Engineering Vibration, 12(2): 165-184.
Roecker S W, Tucker B, King J, Hatzfeld D. 1982. Estimates of Q in Central Asia as a function of frequency and depth using the coda of locally recorded earthquakes[J]. Bull Seismol Soc Am, 72(1): 129-149.
Wen J, Chen X F. 2012. Variations in fmax along the ruptured fault during the MW 7.9 Wenchuan earthquake of 12 May 2008[J]. Bull Seismol Soc Am, 102(3): 991-998.
-
期刊类型引用(7)
1. 陈凯,潘华. 基于机器学习的区域地震动模拟——以2022年泸定M_S6.8地震为例. 地震学报. 2025(02): 242-253 .  本站查看
本站查看
2. 郑兴群,陶正如,白凯. 面向地震动估计需求的区域传播介质参数. 地震地质. 2024(05): 1091-1105 . 百度学术
3. 傅磊,谢俊举,陈苏,张斌,张旭,李小军. 四川地区场地放大系数特征分析及在强地震动模拟中的应用——以2022年芦山M_S6.1地震为例. 地球物理学报. 2023(07): 2933-2950 . 百度学术
4. 宣雨童,李孝波,欧阳刚垒,席书衡. 基于随机有限断层法的泸定6.8级地震强地面运动场重建. 防灾科技学院学报. 2023(04): 14-26 . 百度学术
5. 李小军,陈苏,任治坤,吕悦军,童华炜,温增平. 海域地震区划关键技术研究项目及研究进展. 地震科学进展. 2020(01): 2-19 . 百度学术
6. 傅磊,李小军,陈苏. 云南地区高频衰减参数特性初步研究. 应用基础与工程科学学报. 2019(06): 1294-1307 . 百度学术
7. 魏赛拉加,辛倩男,隋嘉,孙莹. 青海地区环境的地震灾害信息预测模型研究. 华南地震. 2019(04): 40-45 . 百度学术
其他类型引用(6)

 下载:
下载:


计量
- 文章访问数: 1626
- HTML全文浏览量: 1035
- PDF下载量: 119
- 被引次数: 13
