

Impact of the tsunami excited by the 2011 MW9.0 Japan earthquake on seismic ambient noises
-
摘要: 基于北美沿岸和内陆地震台站的连续地震波形记录,并结合沿岸台站附近布设的DART系统记录的海底压力数据以及预测潮汐数据,利用时频分析和极化分析方法对2011年3月11日日本东北部海域MW9.0大地震所激发的海啸对地震背景噪声所产生的影响予以深入分析。结果显示:海啸对高频噪声(1.3—1.5 Hz)以及短周期双频微地动噪声(0.18—0.4 Hz)的影响较小,但海啸显著增强了长周期双频微地动(0.1—0.15 Hz)、单频微地动(0.05—0.08 Hz)以及地球背景自由振荡(0.004—0.007 Hz)的振幅,且随着噪声频率的降低,这种振幅增强的影响更明显,影响的持续时间也更长;海啸到达近岸时,对附近台站的各频段噪声均有影响,成为各频段噪声的主控能量来源,且其位置在后续过程中会随时间变化。这表明海啸对噪声特征的影响与海啸传播特性有关,即海啸在传播过程中因受水深、海底地形以及近岸地形的反射、衍射等的影响,能量聚集区域随时间而变化,并非均匀地传播到海岸, 从而导致了不同频带噪声主极化方向随时间的变化。
-
关键词:
- 海啸 /
- 2011年日本MW9.0地震 /
- 地震背景噪声 /
- 地球背景自由振荡 /
- 微地动
Abstract: The MW9.0 earthquake on March 11, 2011 occurred in the northeastern sea of Japan triggered a catastrophic tsunami, which had significant influences on the seismic ambient noises with ocean-lithosphere coupling. This study uses the continuous data recorded by seismic stations along the coast and inland of North America, combined with the seafloor pressure data recorded by the DART system nearby, as well as the predicted tidal data to analyze the impact of this tsunami on the seismic ambient noises by using time-frequency analysis and polarization analysis methods. The results show that this tsunami had little impact on the high-frequency noise (1.3−1.5 Hz) and short-period double-frequency microseisms (0.18−0.4 Hz), while it significantly enhanced the amplitudes of long-period double-frequency microseisms (0.1−0.15 Hz), single-frequency microseisms (0.05−0.08 Hz), as well as the Earth’s background free oscillations (0.004−0.007 Hz). Moreover, as the frequency of the ambient noise decreases, the amplitude enhancement becomes more pronounced and lasts longer. When the tsunami reaches the shore, it has an impact on the ambient noise of coastal stations nearby for all three frequency-bands of Earth’s background free oscillations, microseisms, and high-frequency noise and becomes the main energy source of seismic ambient noises at all three frequency bands. And the position of the dominant tsunami sources changes with time. All above-mentioned suggests that the influence of tsunami on seismic ambient noise is related to the propagation characteristics of tsunami, that is, due to the influence of water depth, reflections and diffractions of seafloor and inshore topography, the energy accumulation area changes with time, and the energy does not propagate uniformly to the coast, resulting in the changes of dominant polarization direction of seismic ambient noise in different frequency bands with time. By cross-disciplines of seismology and oceanography, this study is of significance for advancing studies on the coupling mechanism of ocean-lithosphere, identifying the characteristics of tsunami waves from the perspective of seismology, as well as exploring new tsunami warning mechanisms. -
引言
自Biot(1956a,b)建立了液饱和多孔介质的本构方程以来,地震波在非均匀饱和土中的传播问题,已经在地震工程、岩土工程等多个领域得到了广泛关注.国内外众多研究者为饱和土波动理论的完善和发展起到了重要的推动作用(陈龙珠等,1987; Corapcioglu,1991;王立忠,吴世明,1995;杨峻等,1996).吴世明(1997)以弹性波基本理论为基础,作了较为系统的理论研究,对深入研究土的动力特征具有重要的学术价值;门福录(1981)引入准微观连续条件的概念,得到了液饱和多孔介质的动力学方程组;陈少林和廖振鹏(2002,2003)将透射公式推广到考虑衰减波入射时的情形,分析了衰减波入射时两种极限情形下反射系数的变化情况. Deresiewicz和Rice(1964)研究了地震波在液饱和土体界面处的反射和透射问题; Stoll和Kan(1991)求解了地震波在海洋沉积土界面处的反透射问题,丰富了海洋领域的地震勘探资料; Santos等(1992)导出了弹性波在液体与多孔介质交界面上位移和能量的透射和反射系数,分析了黏滞修正系数的影响作用.乔文孝等(1992)、杨峻和吴世明(1997)分析了波以任意角度由一种液饱和土层入射到另一种液饱和土层时的反射和透射的结果;胡亚元等(1998)、赵成刚等(1999)和叶陈江等(2005)讨论了弹性波在弹性土与饱和土分界面的反射和透射问题.以往的研究多集中在单相介质(Wolf,1985)和均匀饱和多孔介质方面.而弹性波在非均匀饱和多孔介质分层界面上的动力问题是波动理论的一个研究热点,在实际工程中有着非常广泛的应用,但目前研究较少.鉴于此,本文将分析地震波从基岩处以任意角度入射,向上传播到非均匀饱和土中,并在土层中反射和透射时所引起土体的动力特性.
动力刚度法的概念是由Kolousek(1973)提出的,多用于解决工程中的结构振动问题,最早用于考察杆、梁及框架结构的动力响应(Kolousek,1973).动力刚度法也称为精确方法,只要建立了最初的位移场假设,就可以精确地求解运动微分方程,且不需要再引入其它任何假设或近似.张引科等(2000)用传递矩阵法处理了弹性饱和多孔介质半空间的动力问题,分析指出传递矩阵法将边界上的应力和位移与介质内的应力和位移联系在一起,以方便数值模拟.钟阳等(1995,2003)、钟阳和赵晓雷(2005)分别用传递矩阵法和刚度矩阵法对弹性半空间的动力响应问题作了分析,研究表明刚度矩阵法可以克服传递矩阵法在数值计算中的缺陷,使计算更为精确.
本文将在Biot多孔介质理论的基础上,假设饱和土地基的物理力学性质沿土层深度按幂律梯度变化,分析当平面P-SV波从基岩入射时上覆非均匀饱和土地基的动力响应问题.理论推导出SV波在非均匀饱和土中反射和透射时所引起非均匀饱和土上表面与基岩上表面位移比的计算表达式.通过给出具有实际意义的数值算例,探讨地震波的入射角和入射频率对动力响应的影响,并分析非均匀饱和土的土层厚度和土体的非均匀性对地震波引起的位移比的影响.
1. 基本方程
图 1为考虑饱和土的自由场地示意图.位于基岩上的饱和土覆盖层厚度为H,从基岩入射的平面P波或SV波的入射角为θ,波幅为Ai或Bi.
![]() 图 1 非均匀饱和土地基模型示意图Figure 1. Schematic diagram of non-homogeneous saturated soil foundation model
图 1 非均匀饱和土地基模型示意图Figure 1. Schematic diagram of non-homogeneous saturated soil foundation model1.1 两相多孔介质的控制方程及通解
根据Biot多孔介质理论,均匀、各向同性的饱和土介质弹性波动方程为(Zhou et al,2013)


式中: u和w分别为固体骨架位移矢量和流体相对于土骨架的位移矢量; e=ui,i,ζ=-wi,i; λ和μ为固体骨架拉梅弹性常数; b=η/kf,η为流体黏滞系数,kf为渗透系数; α和M为考虑两相材料压缩性的Biot参数,α=1-K/Ks,1/M=(α-n)/Ks+n/Kf,其中K,Ks和Kf分别为固体骨架、固体颗粒和孔隙流体的体积模量; m=ρf/n为与孔隙水的质量密度及孔隙几何特征有关的参数; ρ=(1-n)ρs+nρf为混合物介质的质量密度,其中n为孔隙率,ρs和ρf分别为固相和液相的密度.
根据亥姆霍兹矢量分解原理,位移矢量 u和w可以用势函数φu,ψu和φw,ψw表示为

假设饱和土层中位移势函数为

式中: AtP1和ArP1分别为透射P1波和反射P1波的波幅系数; AtP2和ArP2分别为透射P2波和反射P2波的波幅系数; Bt和Br分别为透射SV波和反射SV波的波幅系数; k1=ωsinθ/v,表示平面波在x1方向的波数,ω=2πf为圆频率,f为地震波的入射频率; v为平面波的传播速度.其中
由于这里只考虑x1ox3平面内的P-SV波,与x2坐标无关,故可得饱和土的位移与应力为

式中,
ξ1=-2μk3S2-γ12(λ+α2M+αMδP1),ξ2=-2μk3P22-γ22(λ+α2M+αMδP2).
1.2 单相固体介质的控制方程及通解
将基岩视为单相固体弹性介质,类似于对饱和土的推导过程.假设位移势函数为

式中:φb和ψb分别为基岩中波的标量势函数和矢量势函数; Ai和Ar分别为入射P波和反射P波的波幅系数; Bi和Br分别为入射SV波和反射SV波的波幅系数; k3bP=ωcosθ/vP,vP为入射P波的波速;k3bS=ωcosθ/vS,vS为入射SV波的波速.
基岩的位移与应力分别为

式中,ub为基岩的位移矢量.
2. 饱和土自由场地响应
土层在沉积过程中,由于受不同的环境、地理和气候等条件的影响,导致土体特性沿土层深度表现出明显的差别.而对于层厚较大的同一类土,这一沿着地层深度的非均匀特性尤为突出.介质材料的非均匀特性,导致以此介质材料为研究对象的问题的控制方程变得比较复杂,通常情况下采用变系数的偏微分方程组,很难获得相应的解析解答.因此,在土体的厚度方向上,将非均匀饱和土层简化为许多均匀的饱和土薄层,如图 2所示.所简化的土层层数N的多少根据问题的精度要求来决定.图中给出了第j层中P1波、 P2波和SV波的反射和透射.
2.1 传递矩阵
令P=k3P1x3,Q=k3P2x3,R=k3Sx3,将式(5)整理得到:

式中,上标j表示第j层的饱和土.其中,
显然,式(8)对于第j层中介于0—hj的任何深度都成立.此外,如果取x3=0,则可得第j层顶面上的位移分量.由于分界面处存在位移与应力的连续性条件,则第j层顶面上的位移分量等于第j-1层底面的对应量.用下标B表示底面,T表示顶面.当x3=0时,P=0,Q=0,R=0,容易得出此时的F(j)矩阵,记为F0(j).其逆矩阵记为f0(j),即第j-1层底面上的位移与应力分量值可表示为

式(9)左右两边同时左乘f0(j),代入式(8)中,可建立起第j-1层底面与第j层的位移分量之间的关系,即

矩阵F(j)和f0(j)中各元素均为地震波在第j层介质传播时的纵波速度、横波速度、土层厚度和入射角的函数,代表了波在该层介质中传播时的物理特征.令G(j)= F (j) f0 (j),则矩阵G(j)可称为第j层的层矩阵.当x3=hj时,则有 Ghj (j)= Fhj (j) f 0(j),结合式(10)有

根据第N-1层底面与第N层顶面的位移与应力分别相等的边界条件,递推得到第N层介质顶面附近的位移和应力与第一层底面的位移和应力之间的关系为

This page contains the following errors:
error on line 1 at column 1: Start tag expected, '<' not foundBelow is a rendering of the page up to the first error.
将第一层层底与层顶的位移与应力的关系式,结合第N层层顶的位移与应力的关系式带入式(12)中可得

令a = F 0(N) Y,b = MF h1(1) Y,Y为构造矩阵,
则式(13)可简化为

其中,
X 1=[ ArP1(1) AtP1(1) ArP2(1) AtP2(1) Br(1) Bt(1) ]T,XN=[ ArP1(N)AtP1(N)ArP2(N)AtP2(N) Br(N)Bt(N) ]T.
2.2 边界面条件
在自由表面处,σ33=σ13=p=0,即

在第N层土与基岩交界面处,ub1=u1,ub3=u3,σb33=σ33,σb13=σ13,w3=0,即

结合式(14)、(15)和(16)建立线性方程组:

式中,
C=[cij]14×14,D=[dij]14×1,
X=[ArP1(1) AtP1(1) ArP2(1) AtP2(1) Br(1) Bt(1) ArP1(N) AtP1(N) ArP2(N) AtP2(N) Br(N) Bt(N) Ar Br]T.
求解式(17),可获得第一层、第N层和基岩中的未知波幅系数.将所求的波幅系数带入式(5)和式(7)中,取x3=0,即可求得饱和土体上表面与基岩顶面的位移比值.由于文中无法得到解析解,只能求得数值解,故在以下算例中均采用Matlab编程进行数值计算.
3. 数值算例分析
3.1 非均匀饱和土材料性质
假设饱和土层的孔隙率沿厚度方向按幂函数形式连续变化(Zhou et al,2013),即

式中: γ表示梯度因子,不同的γ值代表非均匀程度不同的多孔介质; H为上覆非均匀饱和土的厚度.算例中取上表面处(x3=0)的孔隙率为n(0)=n0=0.45,仿照Wang等(2013)取值方法,其它物理力学参数取值分别为λ0=4.43×10⁷ N/m2,μ0=2.70×107 N/m2,α=1,ρ0=2 100 kg/m3,M0=4.967×109 N/m2,ρνf0=1 000 kg/m3,kf0=6×10-4 cm/s,n0=0.45.下表面处(x3=H)的孔隙率为n(H)=0.25.
此外假设饱和土的物理力学性质与孔隙率n的关系(Zhou et al,2013)为

式中: κ为土体物理力学性质随孔隙率变化的指数; G为饱和土体的ρ,λ,μ,α和M等物理力学参数; n0,kf0和G0为饱和土体上表面处孔隙率以及相应的物理力学参数值.选取基岩的材料参数分别为λb=2.059×10⁹ N/m2,μb=1.427×109 N/m2,ρb=2 460 kg/m3.
3.2 方法的有效性
取非均匀参数γ=0,将非均匀地基退化为单层均质地基.考虑SV波水平入射的情形,与Wolf(1985)中具有相同求解条件的单相介质的解答进行比较,如图 3所示.可以看出,两者结果基本一致.
![]() 图 3 本文与Wolf (1985)关于水平向位移比(a)和竖向位移比(b)的对比Figure 3. Comparison of horizontal displacement ratio (a) and vertical displacement ratio (b) between this paper and Wolf (1985)
图 3 本文与Wolf (1985)关于水平向位移比(a)和竖向位移比(b)的对比Figure 3. Comparison of horizontal displacement ratio (a) and vertical displacement ratio (b) between this paper and Wolf (1985)3.3 数值模拟结果
本文中仅考虑平面SV波入射的情形,即入射P波的波幅Ai=0.选取参数γ=1,κ=1,H=20 m.通过试算,选取分层数N=100可满足精度要求.
This page contains the following errors:
error on line 1 at column 68: Extra content at the end of the documentBelow is a rendering of the page up to the first error.
图 4为了分析土体非均匀性对自由场地动力响应的影响,图 7给出了不同非均匀指数情形下,位移比与频率的变化曲线.可以看出,位移比随频率的增加大体呈减小趋势,与图 4中所得结论一致.随着非均匀指数的增大,竖向位移比和水平向位移比的最大值将减小.
![]() 图 4 水平向位移比(a)和竖向位移比(b)随入射角的变化曲线Figure 4. Variation of horizontal displacement ratio (a) and vertical displacementratio (b) with incident angle
图 4 水平向位移比(a)和竖向位移比(b)随入射角的变化曲线Figure 4. Variation of horizontal displacement ratio (a) and vertical displacementratio (b) with incident angle![]() 图 5 水平向位移比(a)和竖向位移比(b)随土层厚度的变化曲线Figure 5. Variation of horizontal displacement ratio (a) and vertical displacement ratio (b) with soil thickness
图 5 水平向位移比(a)和竖向位移比(b)随土层厚度的变化曲线Figure 5. Variation of horizontal displacement ratio (a) and vertical displacement ratio (b) with soil thickness![]() 图 6 水平向位移比(a)和竖向位移比(b)随频率的变化曲线Figure 6. Variation of horizontal displacement ratio (a) and vertical displacement ratio (b)with frequency
图 6 水平向位移比(a)和竖向位移比(b)随频率的变化曲线Figure 6. Variation of horizontal displacement ratio (a) and vertical displacement ratio (b)with frequency![]() 图 7 非均匀指数不同时水平向位移比(a)和竖向位移比(b)随频率的变化曲线Figure 7. Variation of horizontal displacement ratio (a) and vertical displacement ratio (b) with frequency for different heterogeneity indices
图 7 非均匀指数不同时水平向位移比(a)和竖向位移比(b)随频率的变化曲线Figure 7. Variation of horizontal displacement ratio (a) and vertical displacement ratio (b) with frequency for different heterogeneity indices4. 讨论与结论
基于Biot多孔介质模型,应用动力刚度法研究了平面P-SV波入射时所引起的非均匀饱和土自由场地的响应,数值分析了SV波入射时,位移比与频率、入射角、上覆非均匀饱和土层厚度以及非均匀指数之间的关系,结果表明:
1)动力刚度法对于求解非均匀饱和土中地震波的传播具有很好的适用性,其求解简单方便、易于理解、便于编程,并且具有较高的求解精度.
2)平面P-SV波的入射角、频率以及土体的非均匀性对饱和土层的动力响应有很大的影响,与均质土地基相比具有明显不同的特性.
3)随着土层厚度的增加,地面的动力响应逐渐减小并趋于零,表明厚土层对地震波的耗散作用尤为明显;地面位移与基岩位移之比均随饱和土的非均匀指数、地震波的入射角和入射频率的增加而减小,且竖向位移比减小得更为显著.
本文考虑土体在沉积过程中自身的非均匀性,基于混合物连续介质的基本理论,针对具有梯度饱和土覆盖层的空间体中地震波的传播特性进行系统分析,对非均匀材料力学和混合物连续介质理论的发展有促进作用.鉴于实际饱和土层比较复杂的特点,本文根据求解需求及梯度饱和土覆盖层的特性,只假设了饱和土介质的物理力学参数沿深度呈幂律梯度变化的情况,以往也有假设为指数变化和线性变化的情况.更精确的土介质参数与深度的函数关系应根据多组试验进行拟合确定,这将是下一步研究的重点.
-
![]()
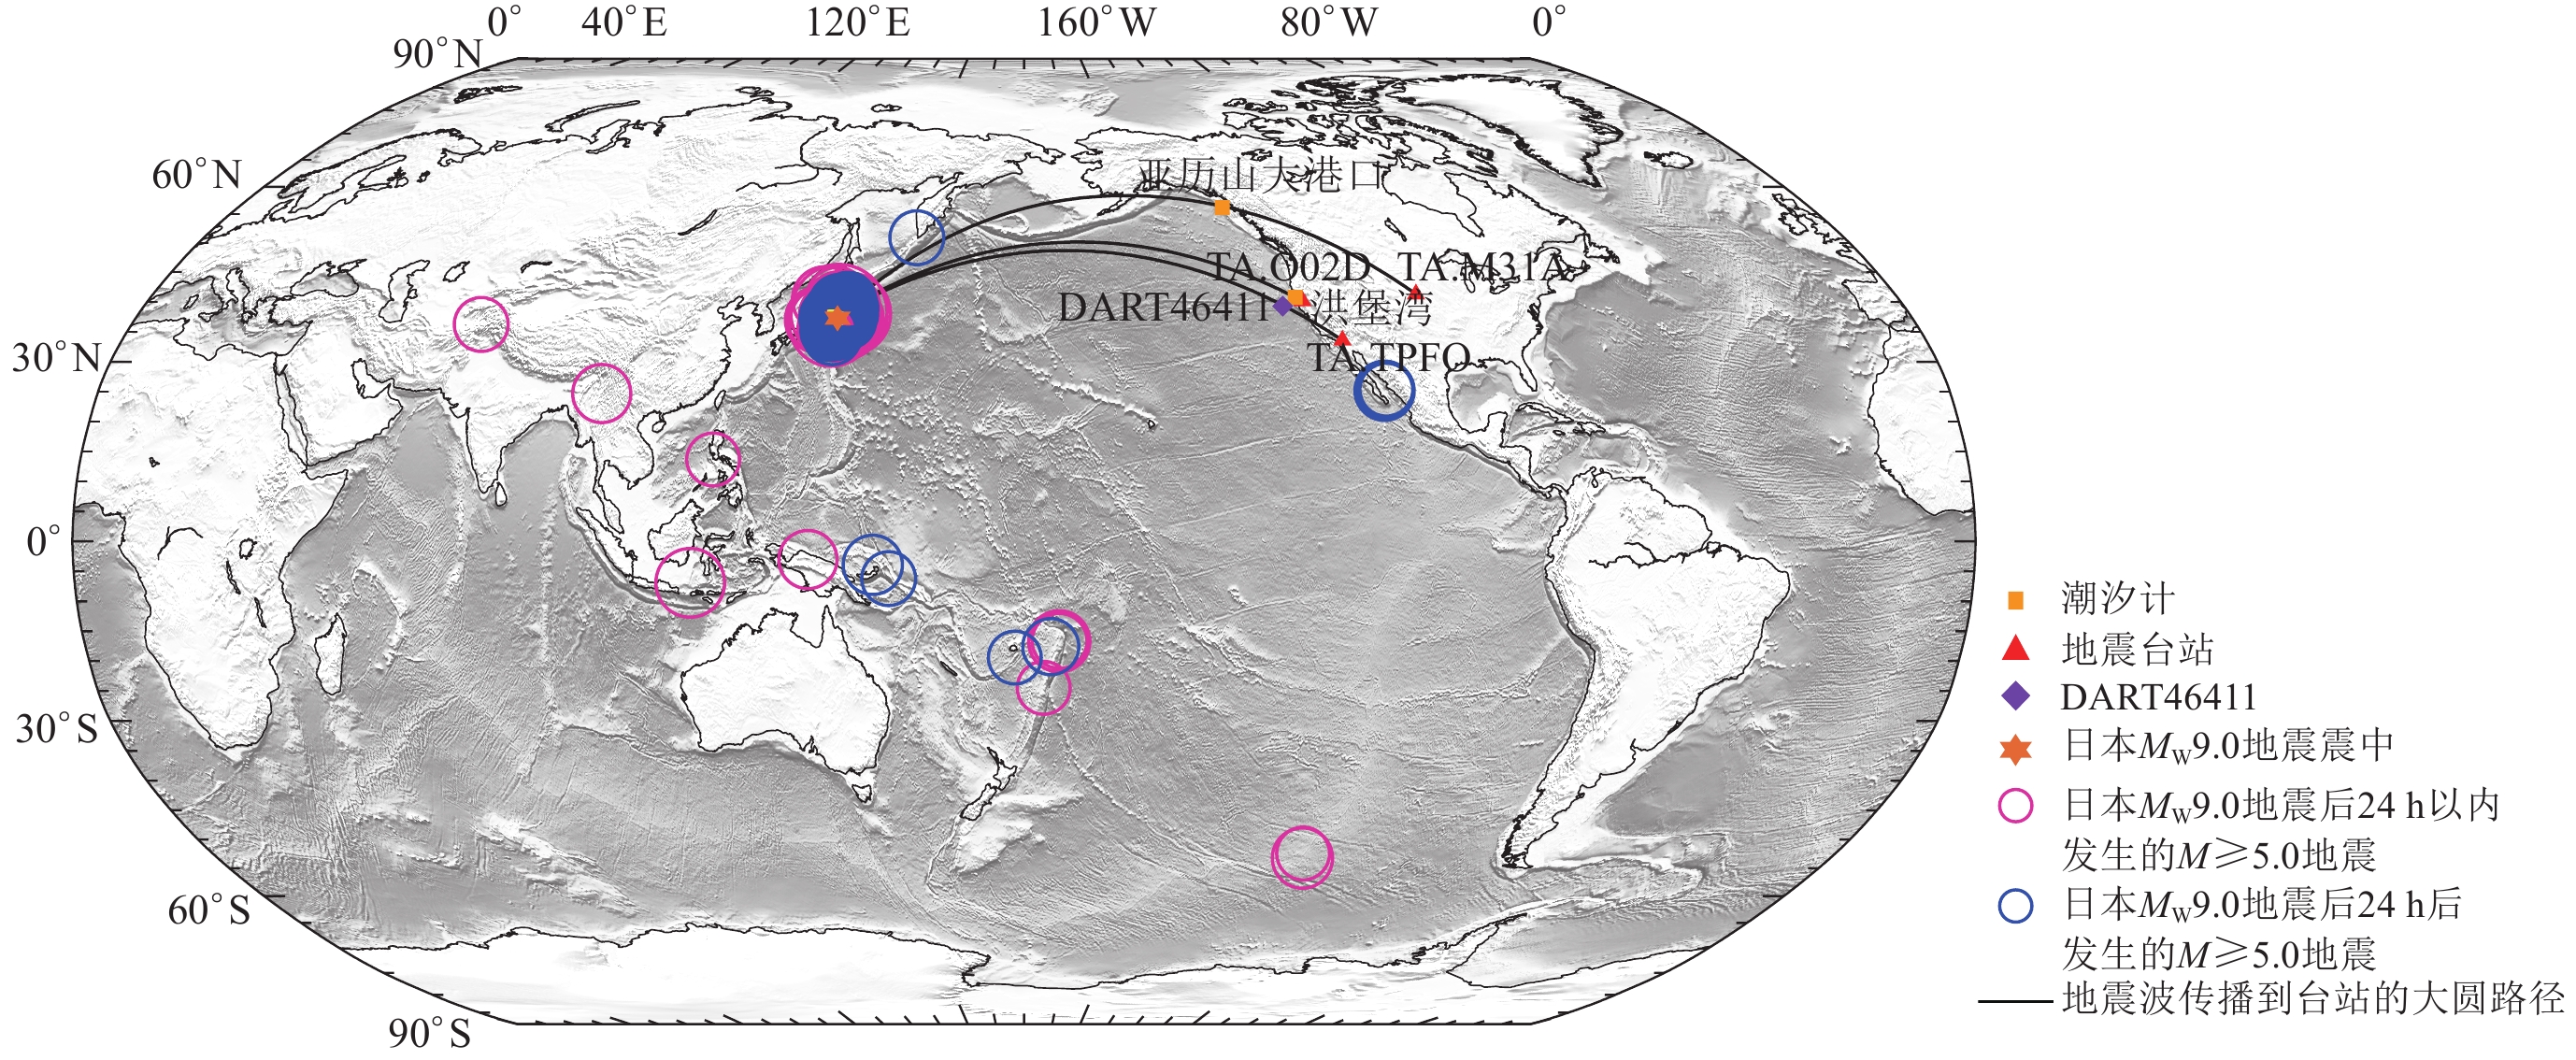
图 1 本文所用的地震台站、DART站、潮汐计以及2011年3月10日至3月15日期间全球M≥5.0地震震中位置的空间分布图(圆圈大小表示地震震级的相对大小)
Figure 1. The spatial distributions of seismic stations,DART station and tide meters used in this study as well as the global M≥5.0 earthquake epicenter locations from March 10 to 15,2011 (The circle size indicates the relative magnitude of the earthquake)
![]()
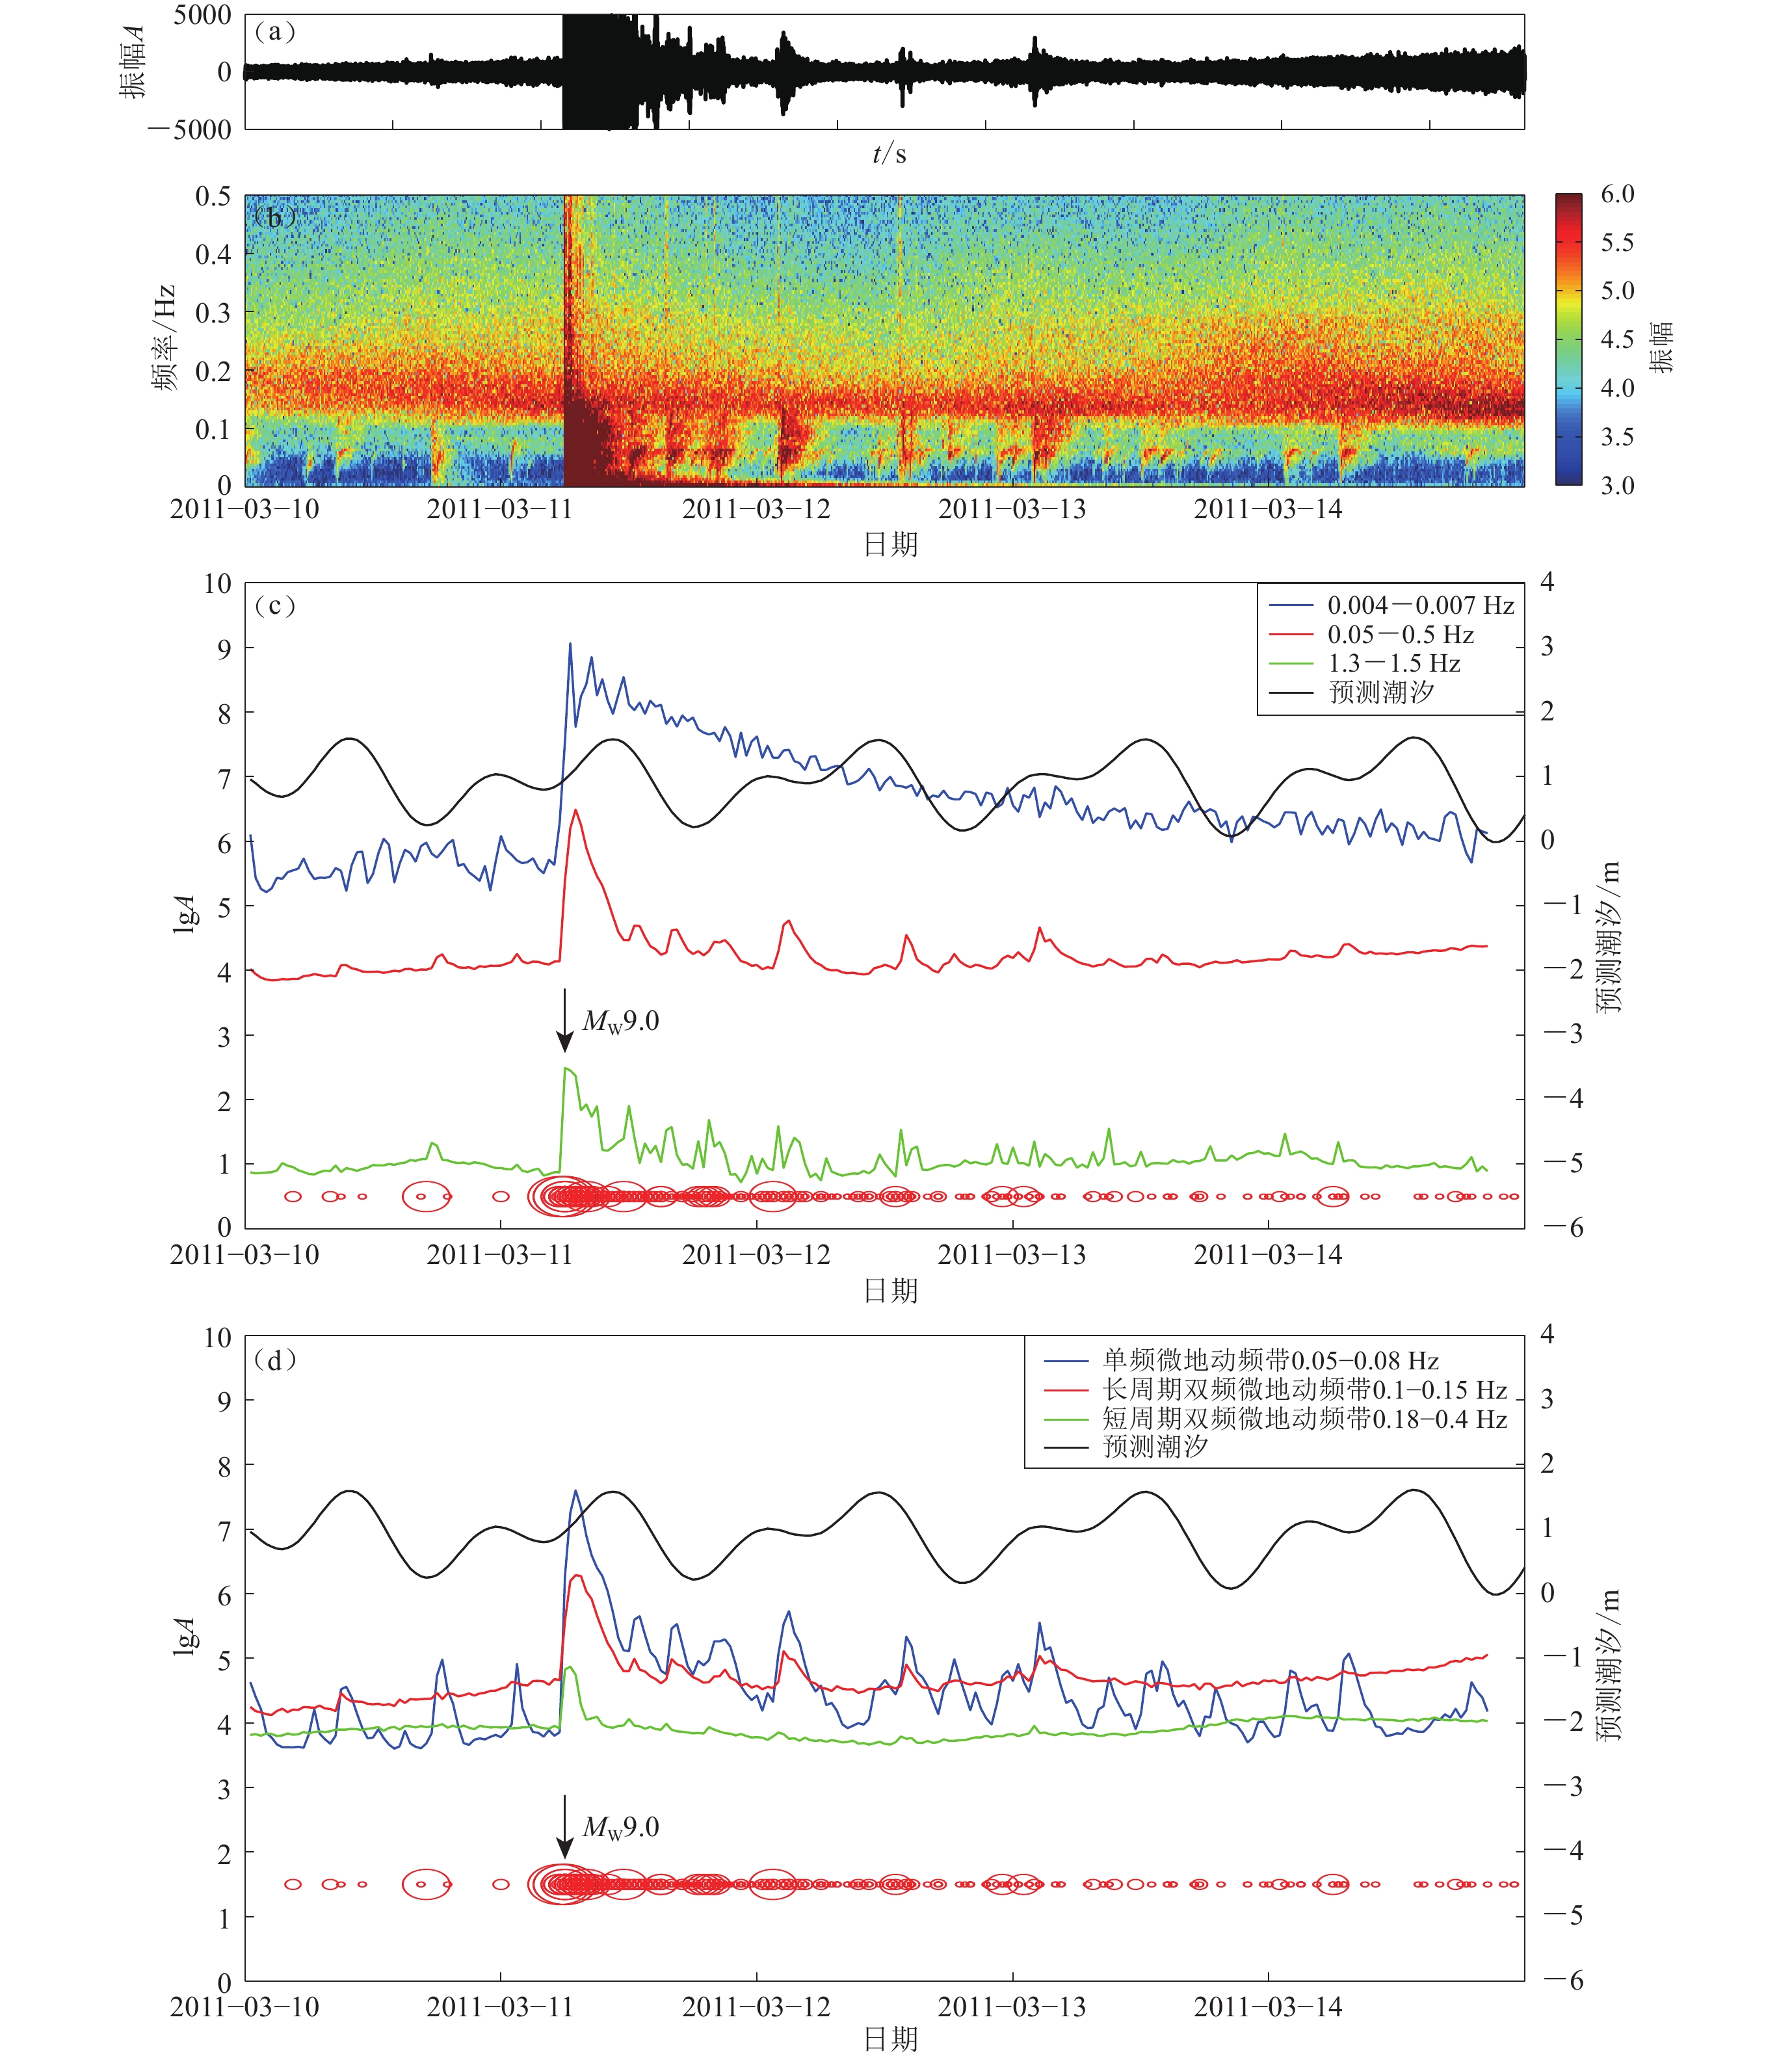
图 2 2011年3月10日至15日TA.O02D台站垂直分量的时频分析结果
(a) 波形图;(b) 时频图;(c) 不同频段的半小时平均振幅A曲线;(d) 微地动频带内不同频段的半小时平均振幅A曲线。图(c)和(d)中红色圆圈表示M≥5地震的发生时刻和震级大小。地震目录引自美国国家地震信息中心(USGS,2020)
Figure 2. Time-frequency analysis results of the vertical component of the station TA.O02D from March 10 to 15,2011
(a) Waveform diagram;(b) Time-frequency diagram;(c) Half-hour average amplitude curves in different frequency bands;(d) Half-hour average amplitude curves of different frequency bands in microseisms. In Figs. (c) and (d),red circles indicate the time and magnitude of M≥5 earthquakes. Earthquake catalogue comes from USGS (2020)
![]()
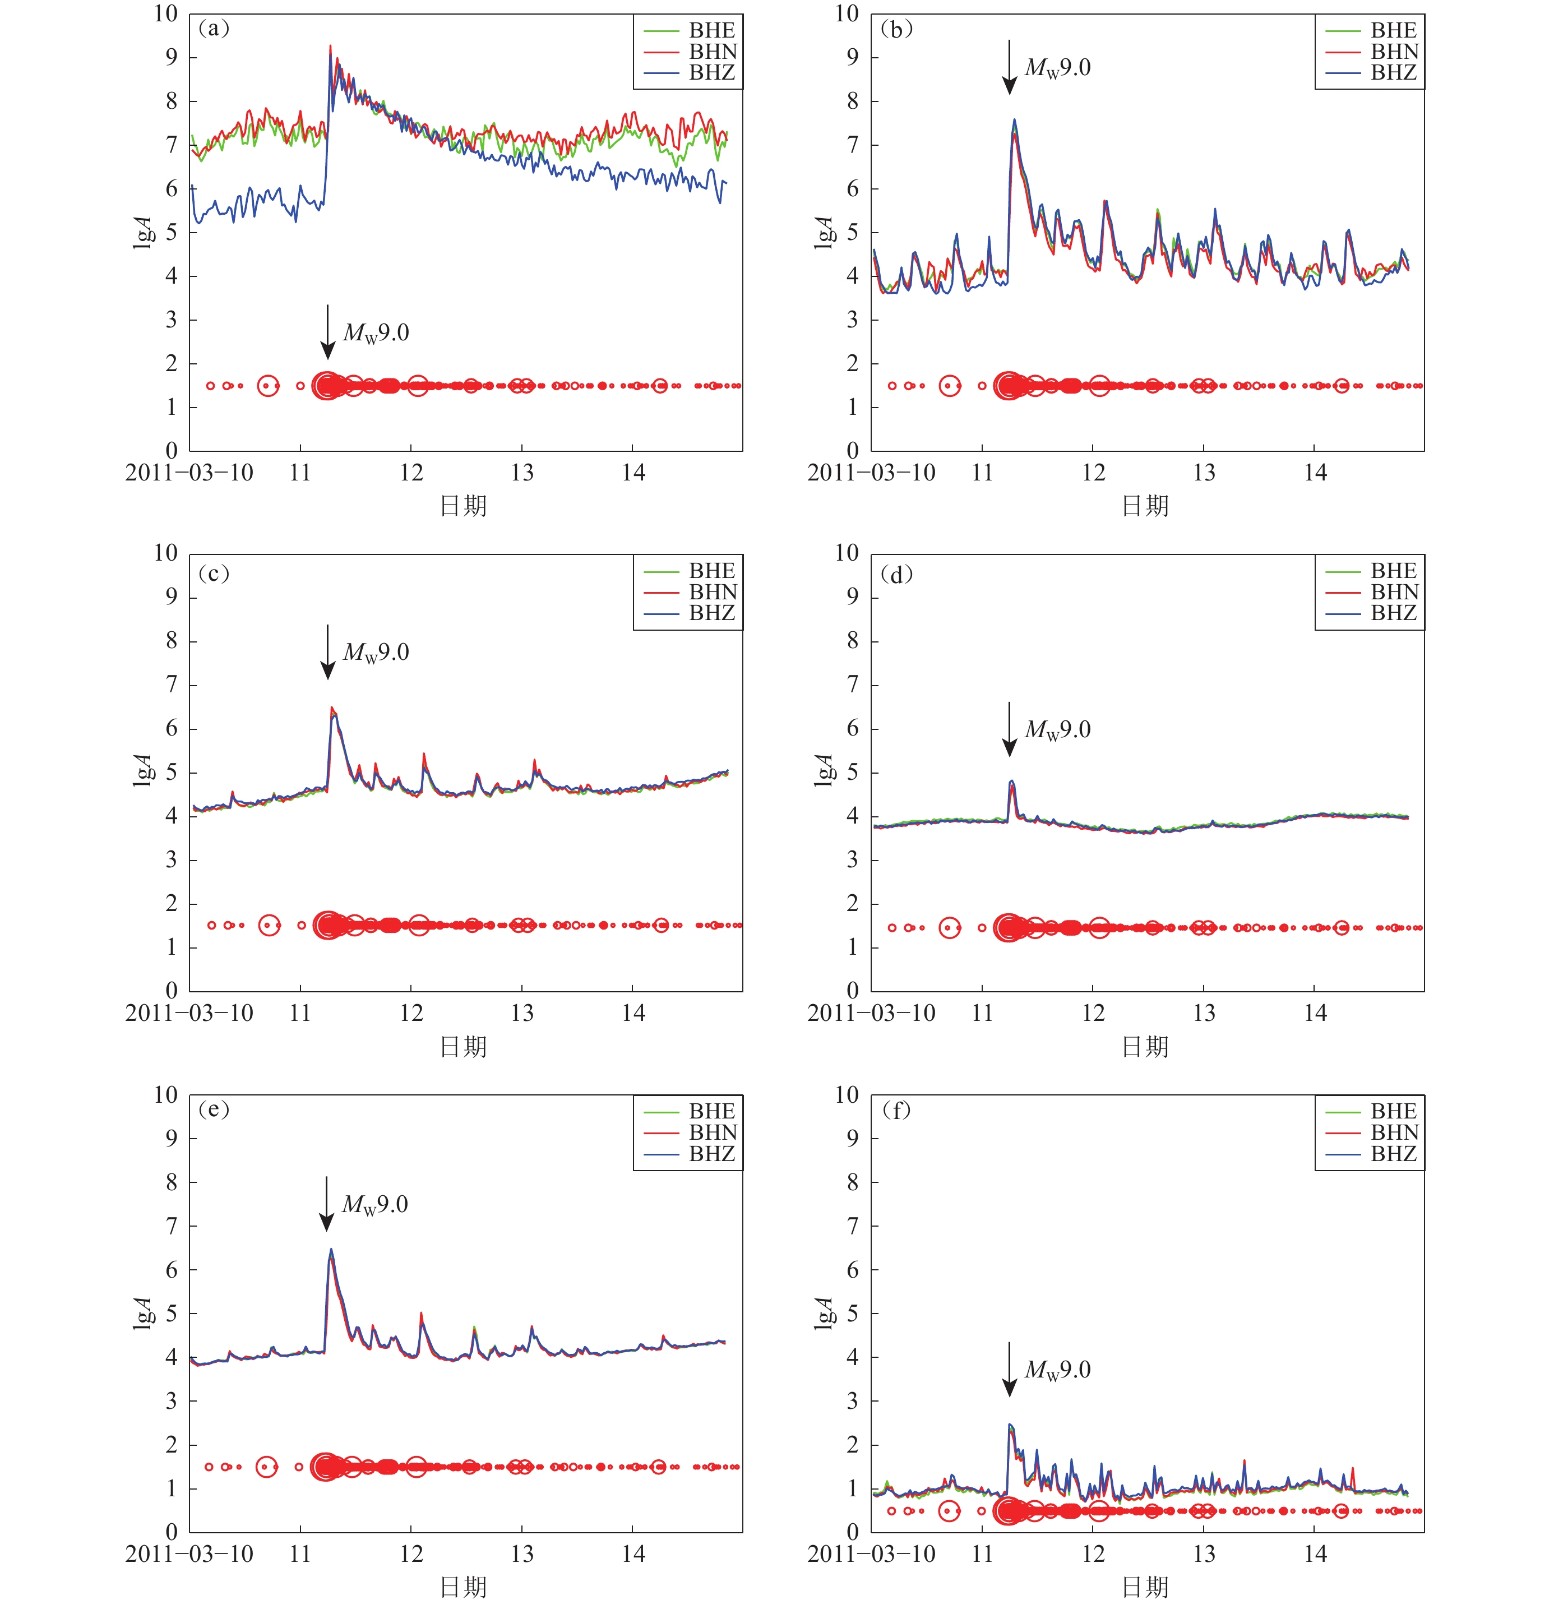
图 3 2011年3月10日至15日TA.O02D台站三分量地震连续波形记录在不同频带的半小时平均振幅A的变化曲线
(a) 地球背景自由振荡频带(0.004—0.007 Hz);(b) 单频微地动频带(0.05—0.08 Hz);(c) 长周期双频微地动频带(0.1—0.15 Hz);(d) 短周期双频微地动频带(0.18—0.4 Hz);(e) 微地动频带(0.05—0.5 Hz);(f) 高频噪声频带(1.3—1.5 Hz)。红色圆圈的意思与图2相同。
Figure 3. The variation curves of half-hour average amplitude A of the three-component seismic continuous waveform records for the station TA.O02D for different frequency bands from March 10 to 15,2011
(a) The Earth’s background free oscillation frenquency band (0.004−0.007 Hz);(b) Single-frequency microseism frenquency band (0.05−0.08 Hz);(c) Long-period double-frequency microseism frenquency band (0.1−0.15 Hz);(d) Short-period double-frequency microseism frenquency band (0.18−0.4 Hz);(e) Microseism frenquency band (0.05−0.5 Hz);(f) The high-frequency noise (1.3−1.5 Hz). The meanings of the red circles are the same as in Fig. 2
![]()
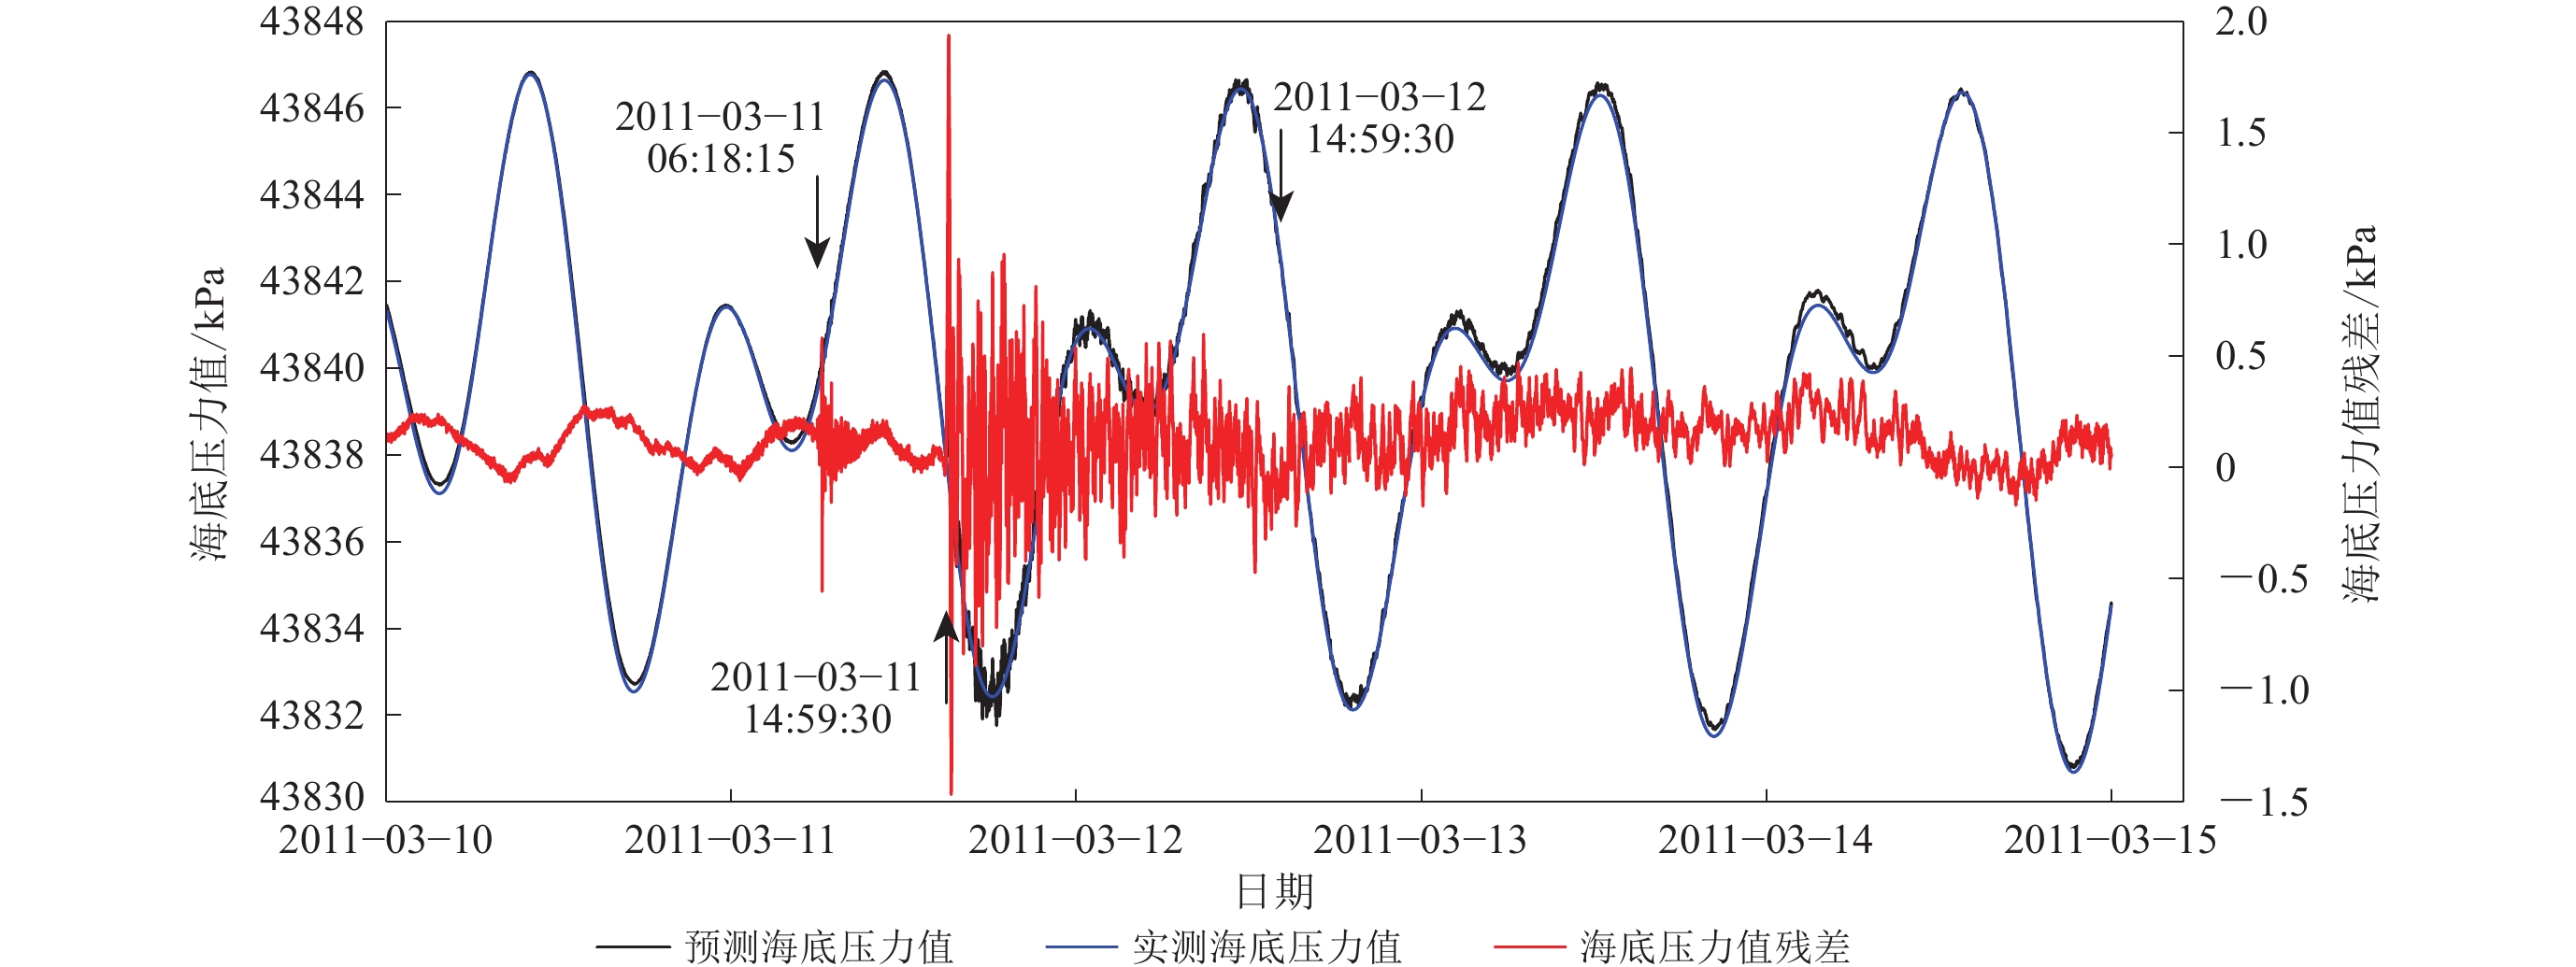
图 4 日本MW9.0地震前后DART46411台站记录到的2011年3月10日至15日的海底压力值
箭头指示台站记录的海啸频段的海浪实测与预测高度残差幅值超过3 cm阈值进入快速汇报模式(提供海啸预警信息)的时刻
Figure 4. The seafloor pressure values recorded by the station DART46411 during the 2011 Japanese tsunami from March 10 to 15,2011
The arrows indicate the moments when the residuals between measured and predicted waves heightin the tsunami band recorded by the station exceeds the 3 cm threshold and enters the rapid reporting mode (which provides tsunami warning information)
![]()
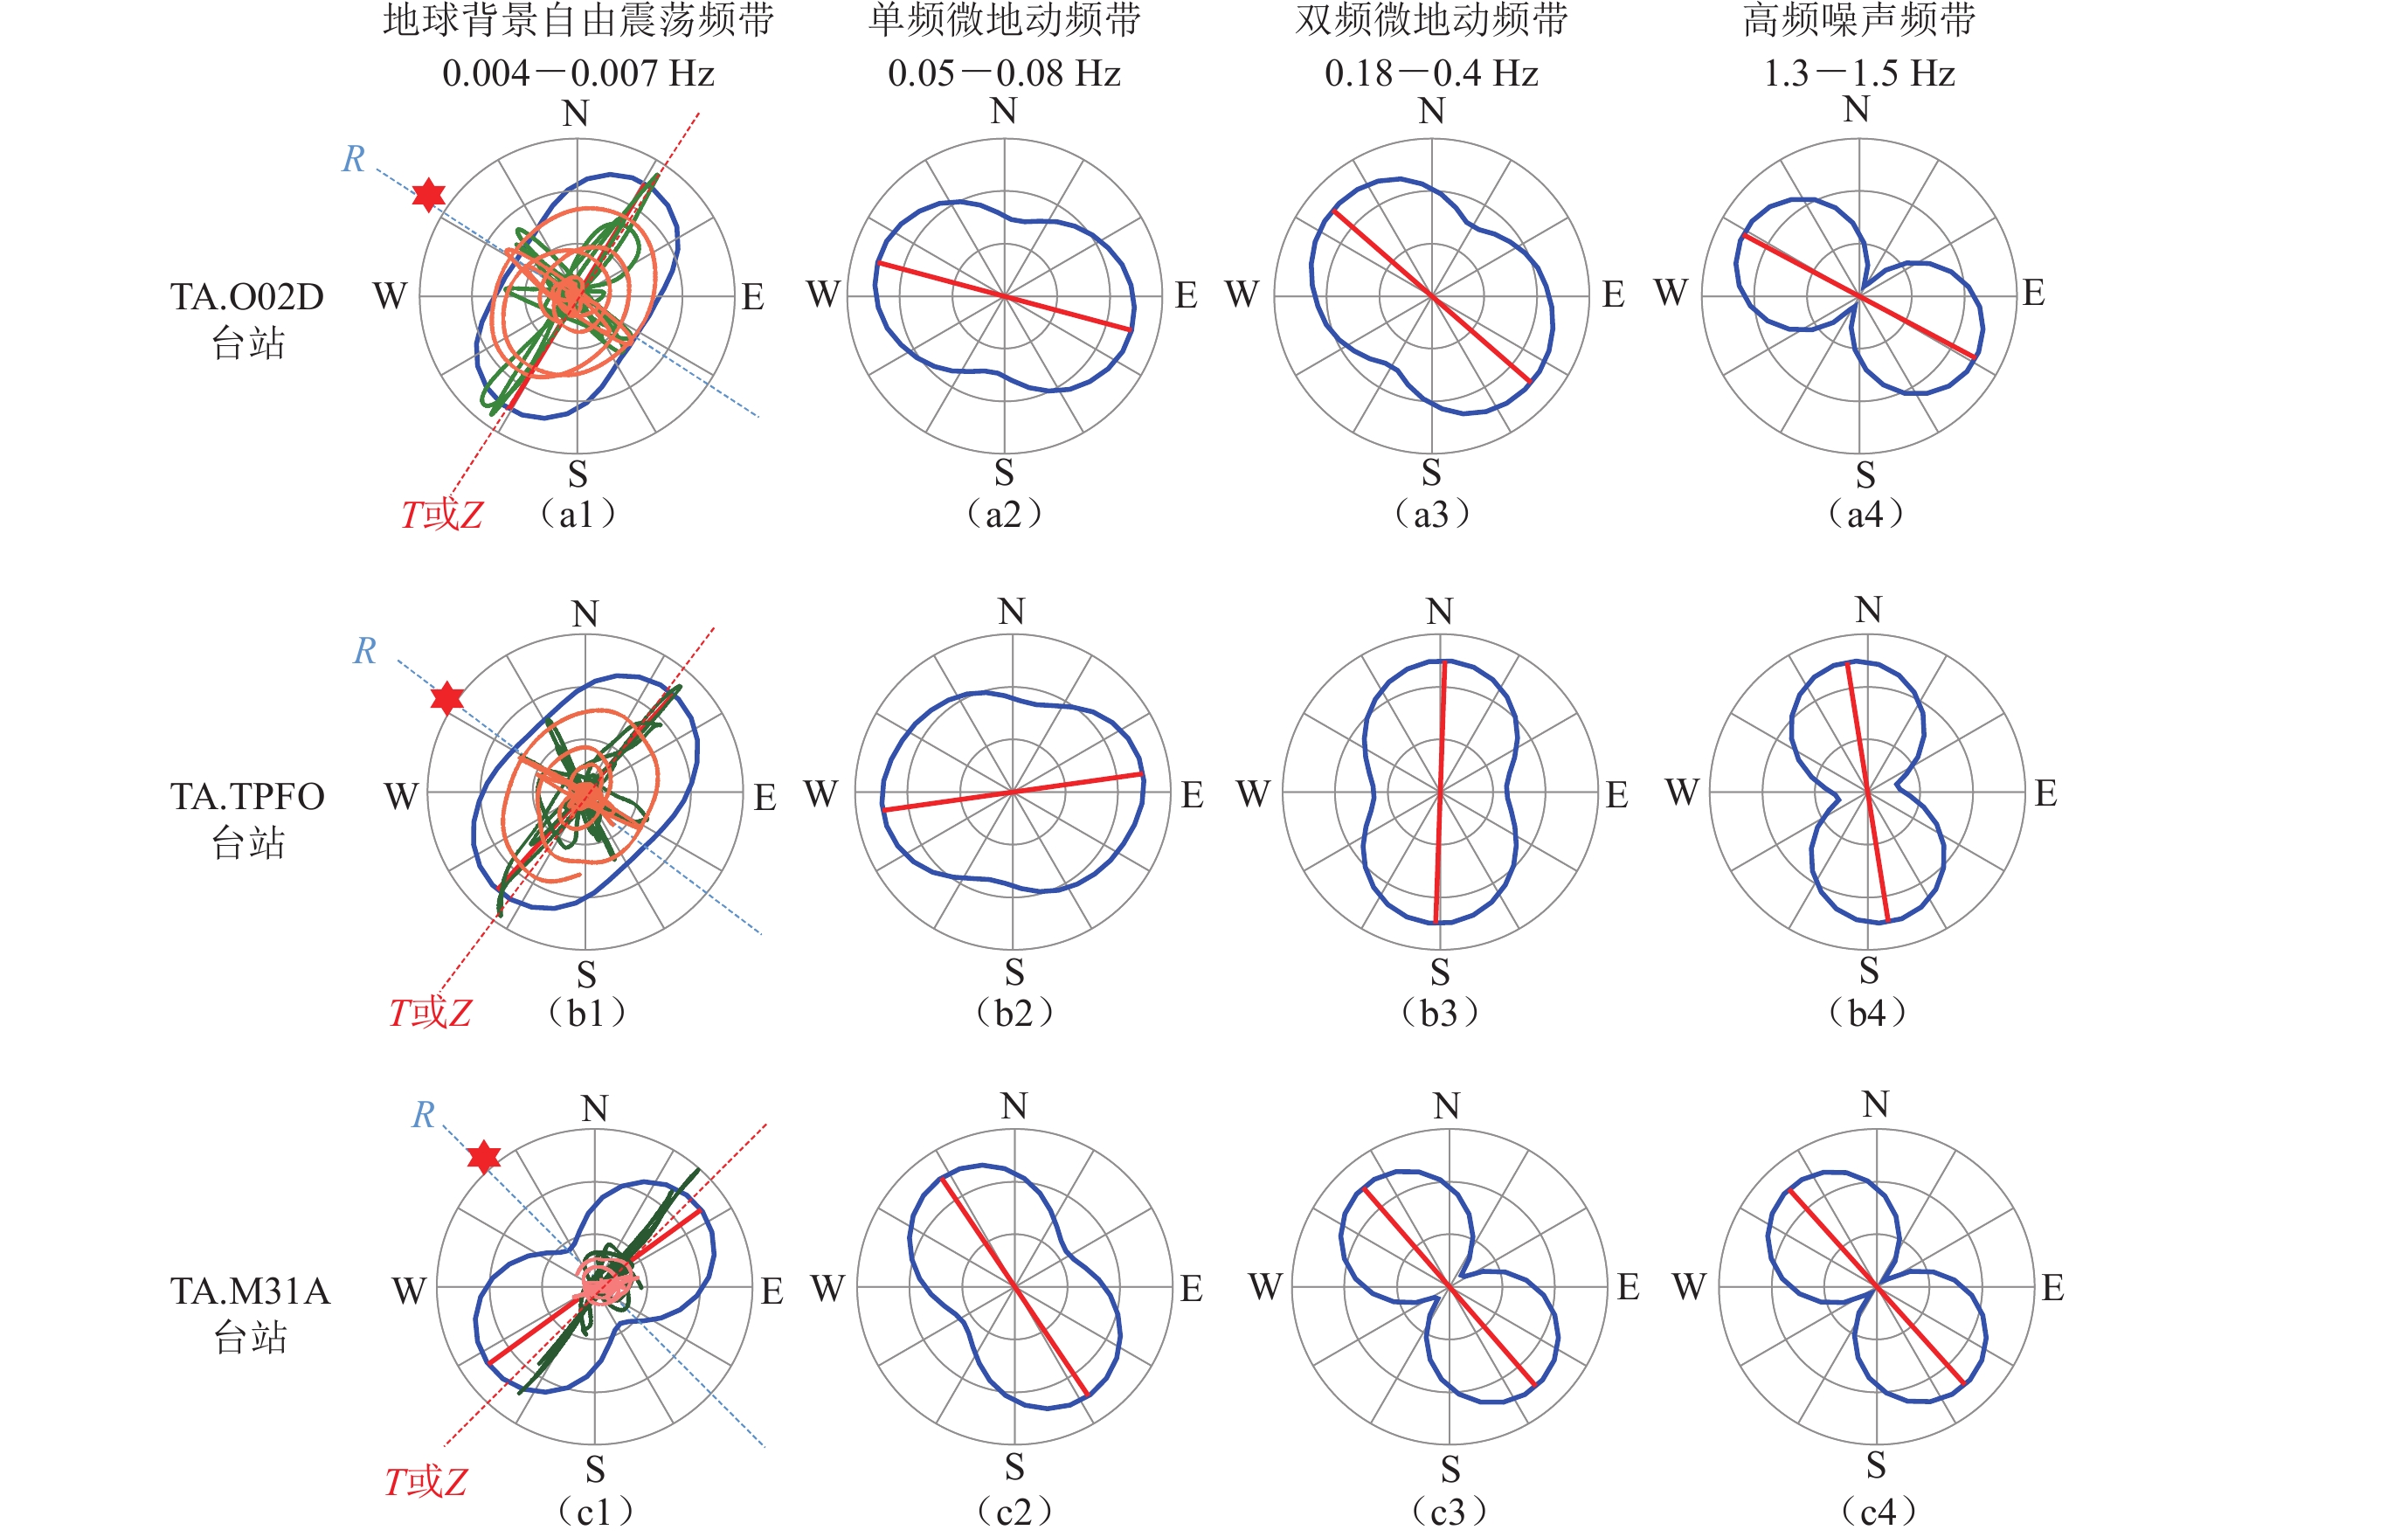
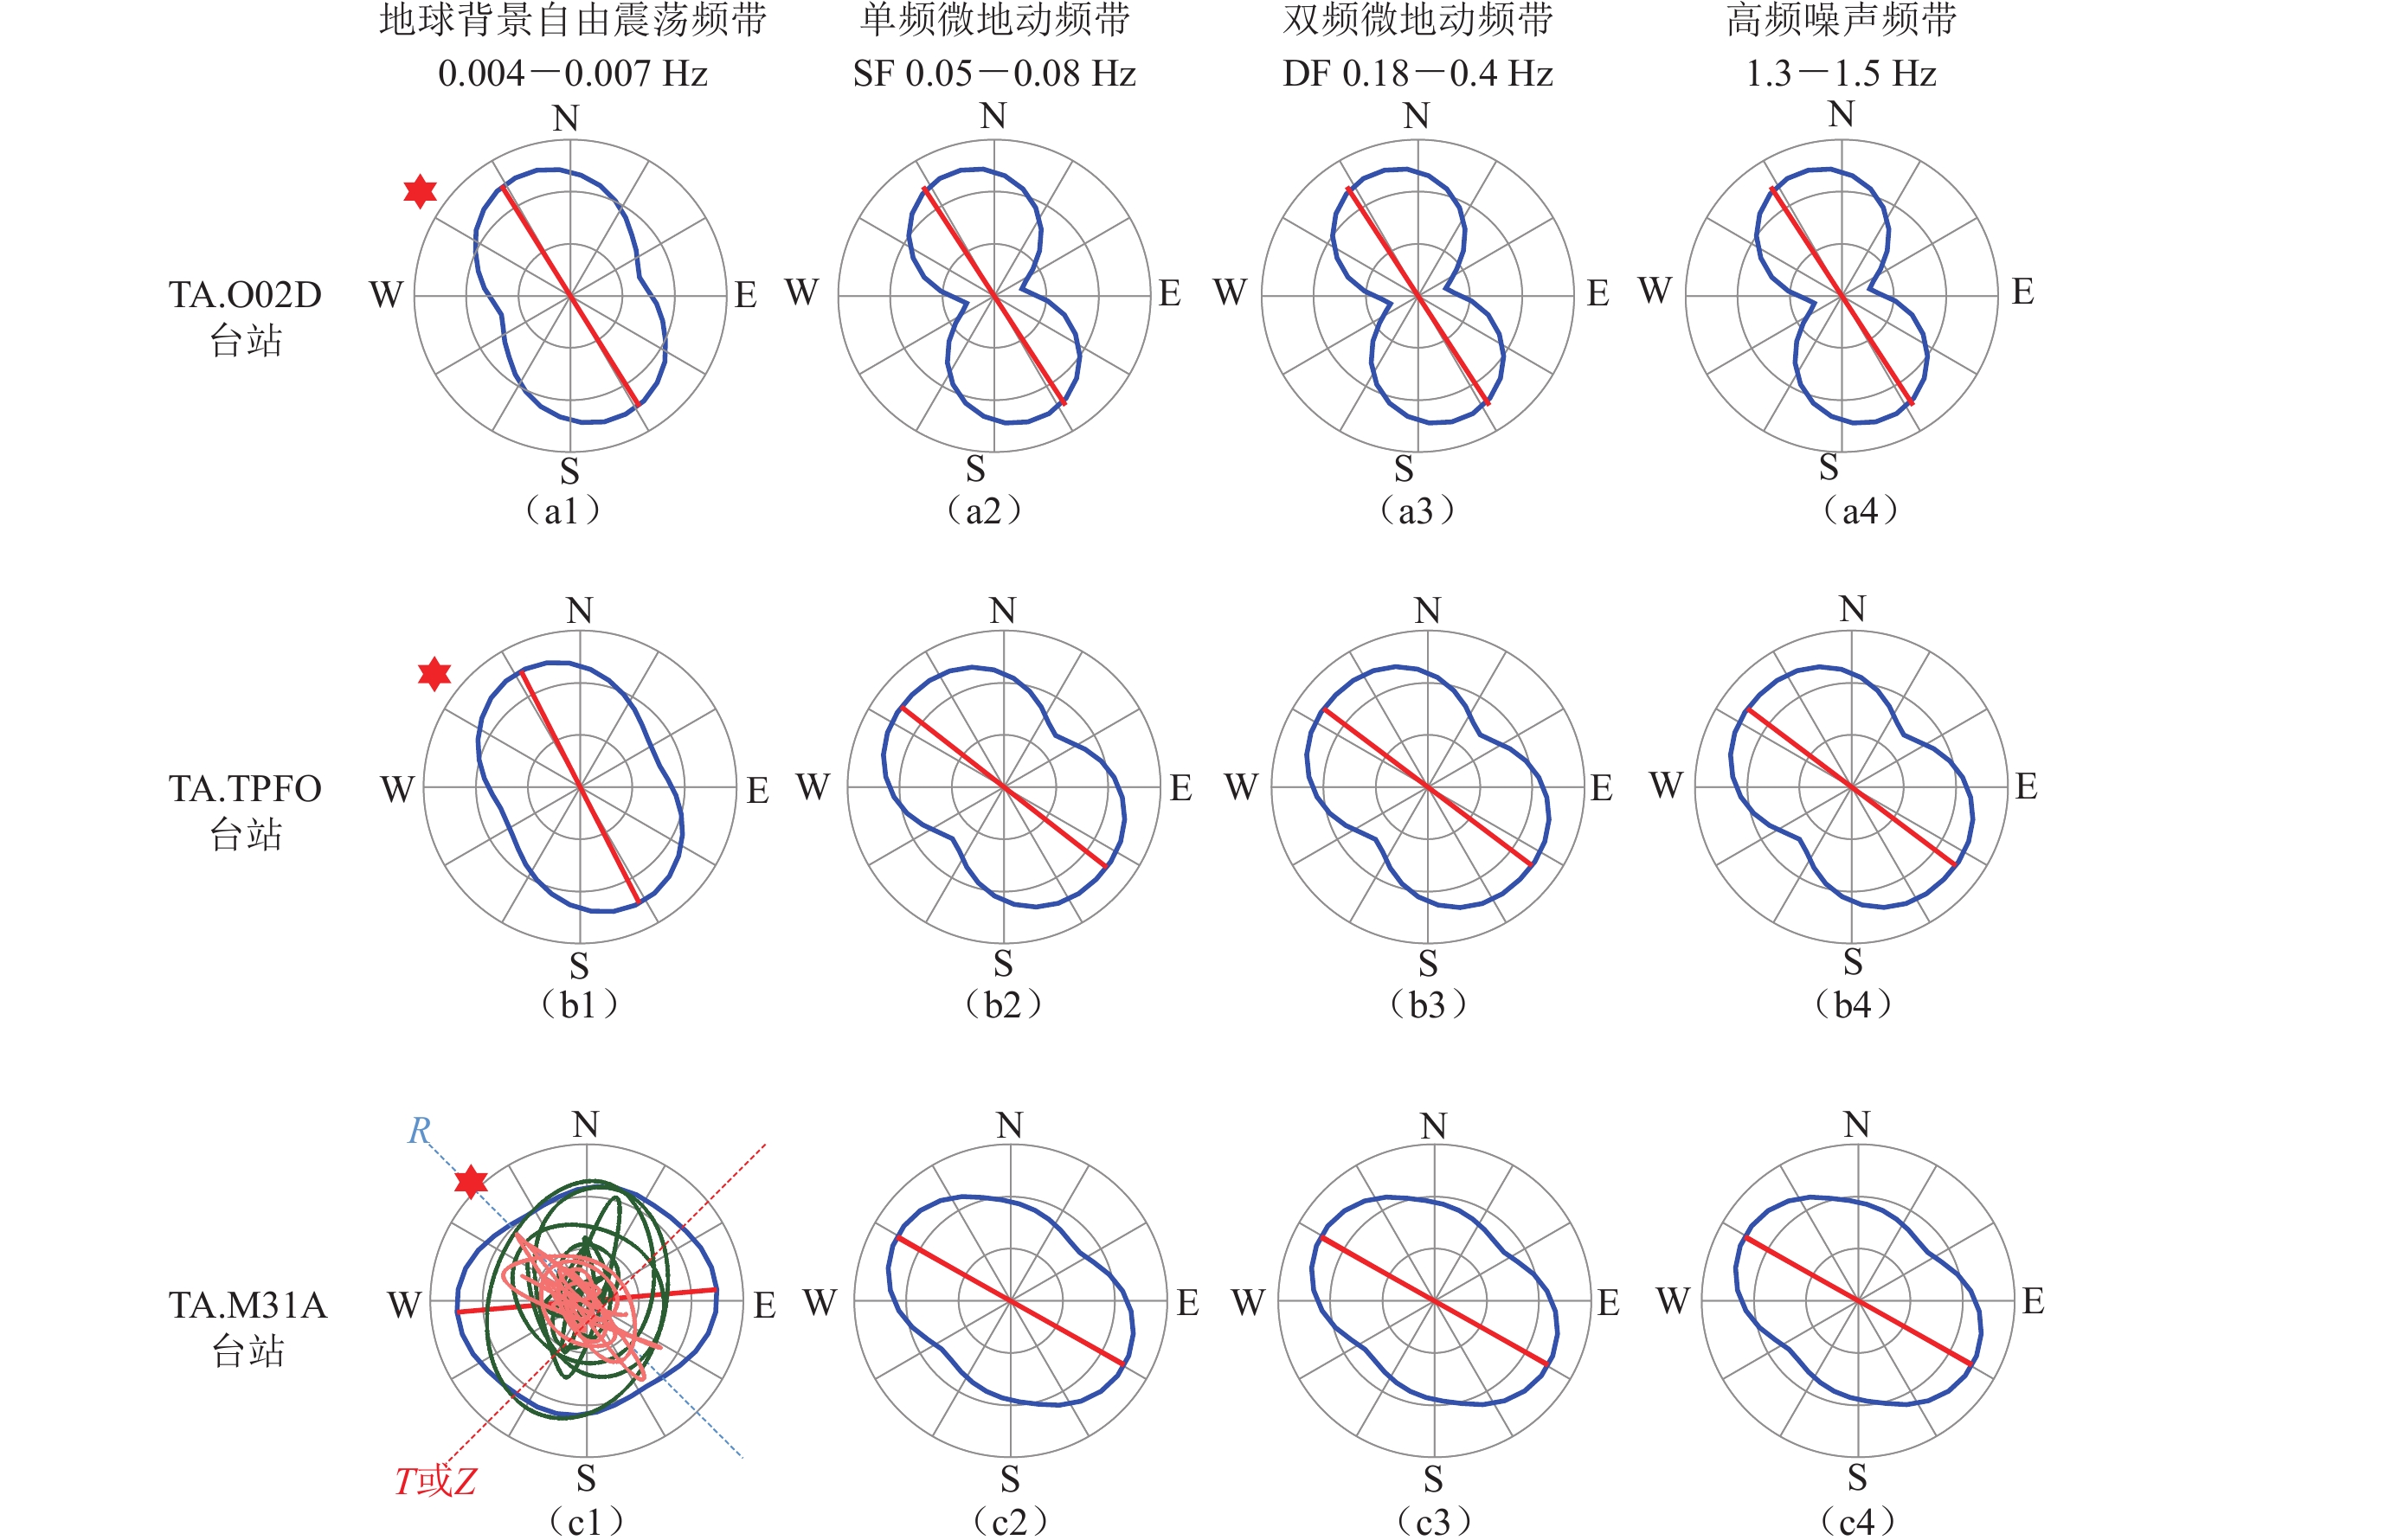
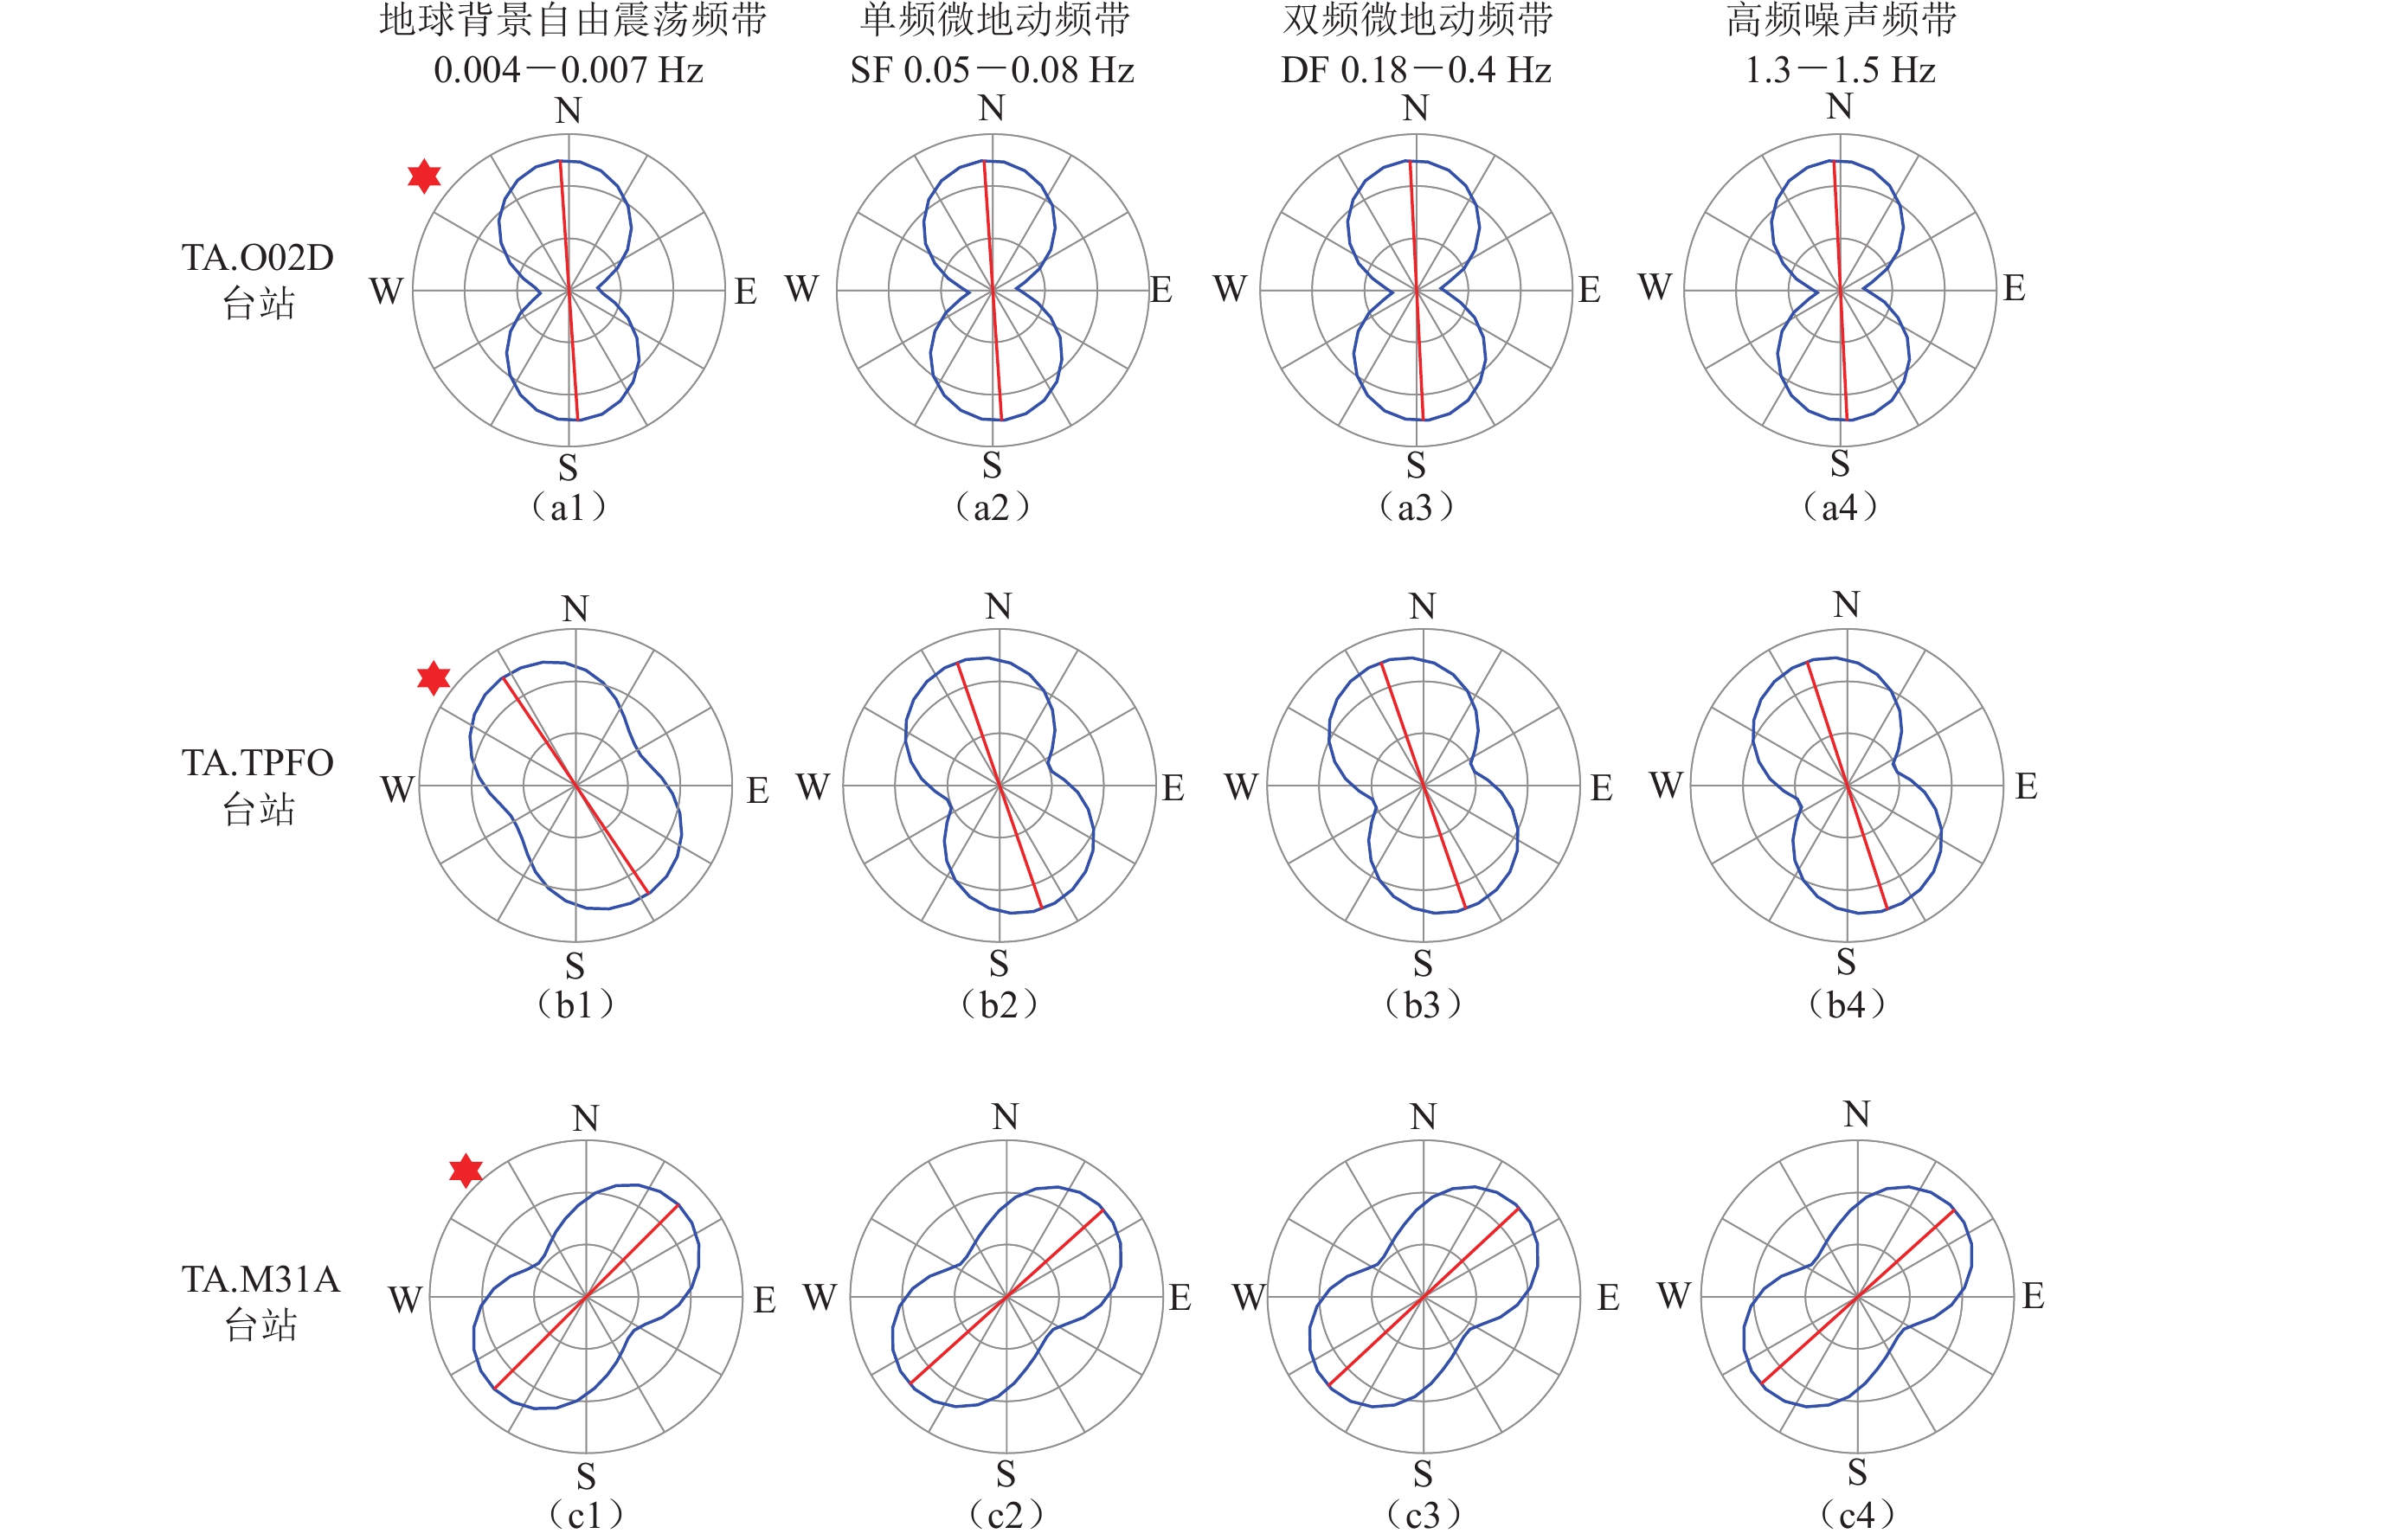
图 5 台站TA.O02D (a)、TA.TPFO (b)和TA.M31A (c)的连续地震波形记录在3月11日6:00—6:30时窗内的极化分析结果
红色直线表示在该时间窗口内各频段内连续地震波形记录的主极化方向,蓝色实线表示各频段内连续地震波形记录在各方位上的振幅。第一列中,红色星形表示对应时间窗口内M≥5.0余震相对地震台站的大圆路径方位,绿色曲线表示该时间窗口内连续地震波形记录的R-T水平面内的质点振动图,橙色曲线表示R-Z竖直面内的质点振动图,蓝色虚线表示质点振动图中的R分量方向,红色虚线对R-T和R-Z质点振动图来说分别代表T分量和垂直分量Z的方向
Figure 5. Polarization analysis results of the continuous seismic waveforms of the stations TA.O02D (a), TA.TPFO (b) and TA.M31A (c) recorded from 6:00 to 6:30 on March 11
Red lines indicate the predominant polarization direction of the continuous seismic waveforms recorded in each frequency band,and blue solid lines indicate the amplitude of the continuous seismic waveform recorded in each azimuth in each frequency band. In the first column subfigures,the red stars indicate the position of the great circle path of the M≥5 aftershocks relative to the seismic stations in the corresponding time window,green curves indicates the particle vibration diagram in the R-T horizontal plane,orange curves indicate the particle vibration diagram in the R-Z vertical plane. Blue dotted lines indicate the direction of the component R in the particle vibration diagrams,red dotted lines represent the direction of the component T and the vertical component Z of the R-T and R-Z particle vibration diagrams,respectively
![]()
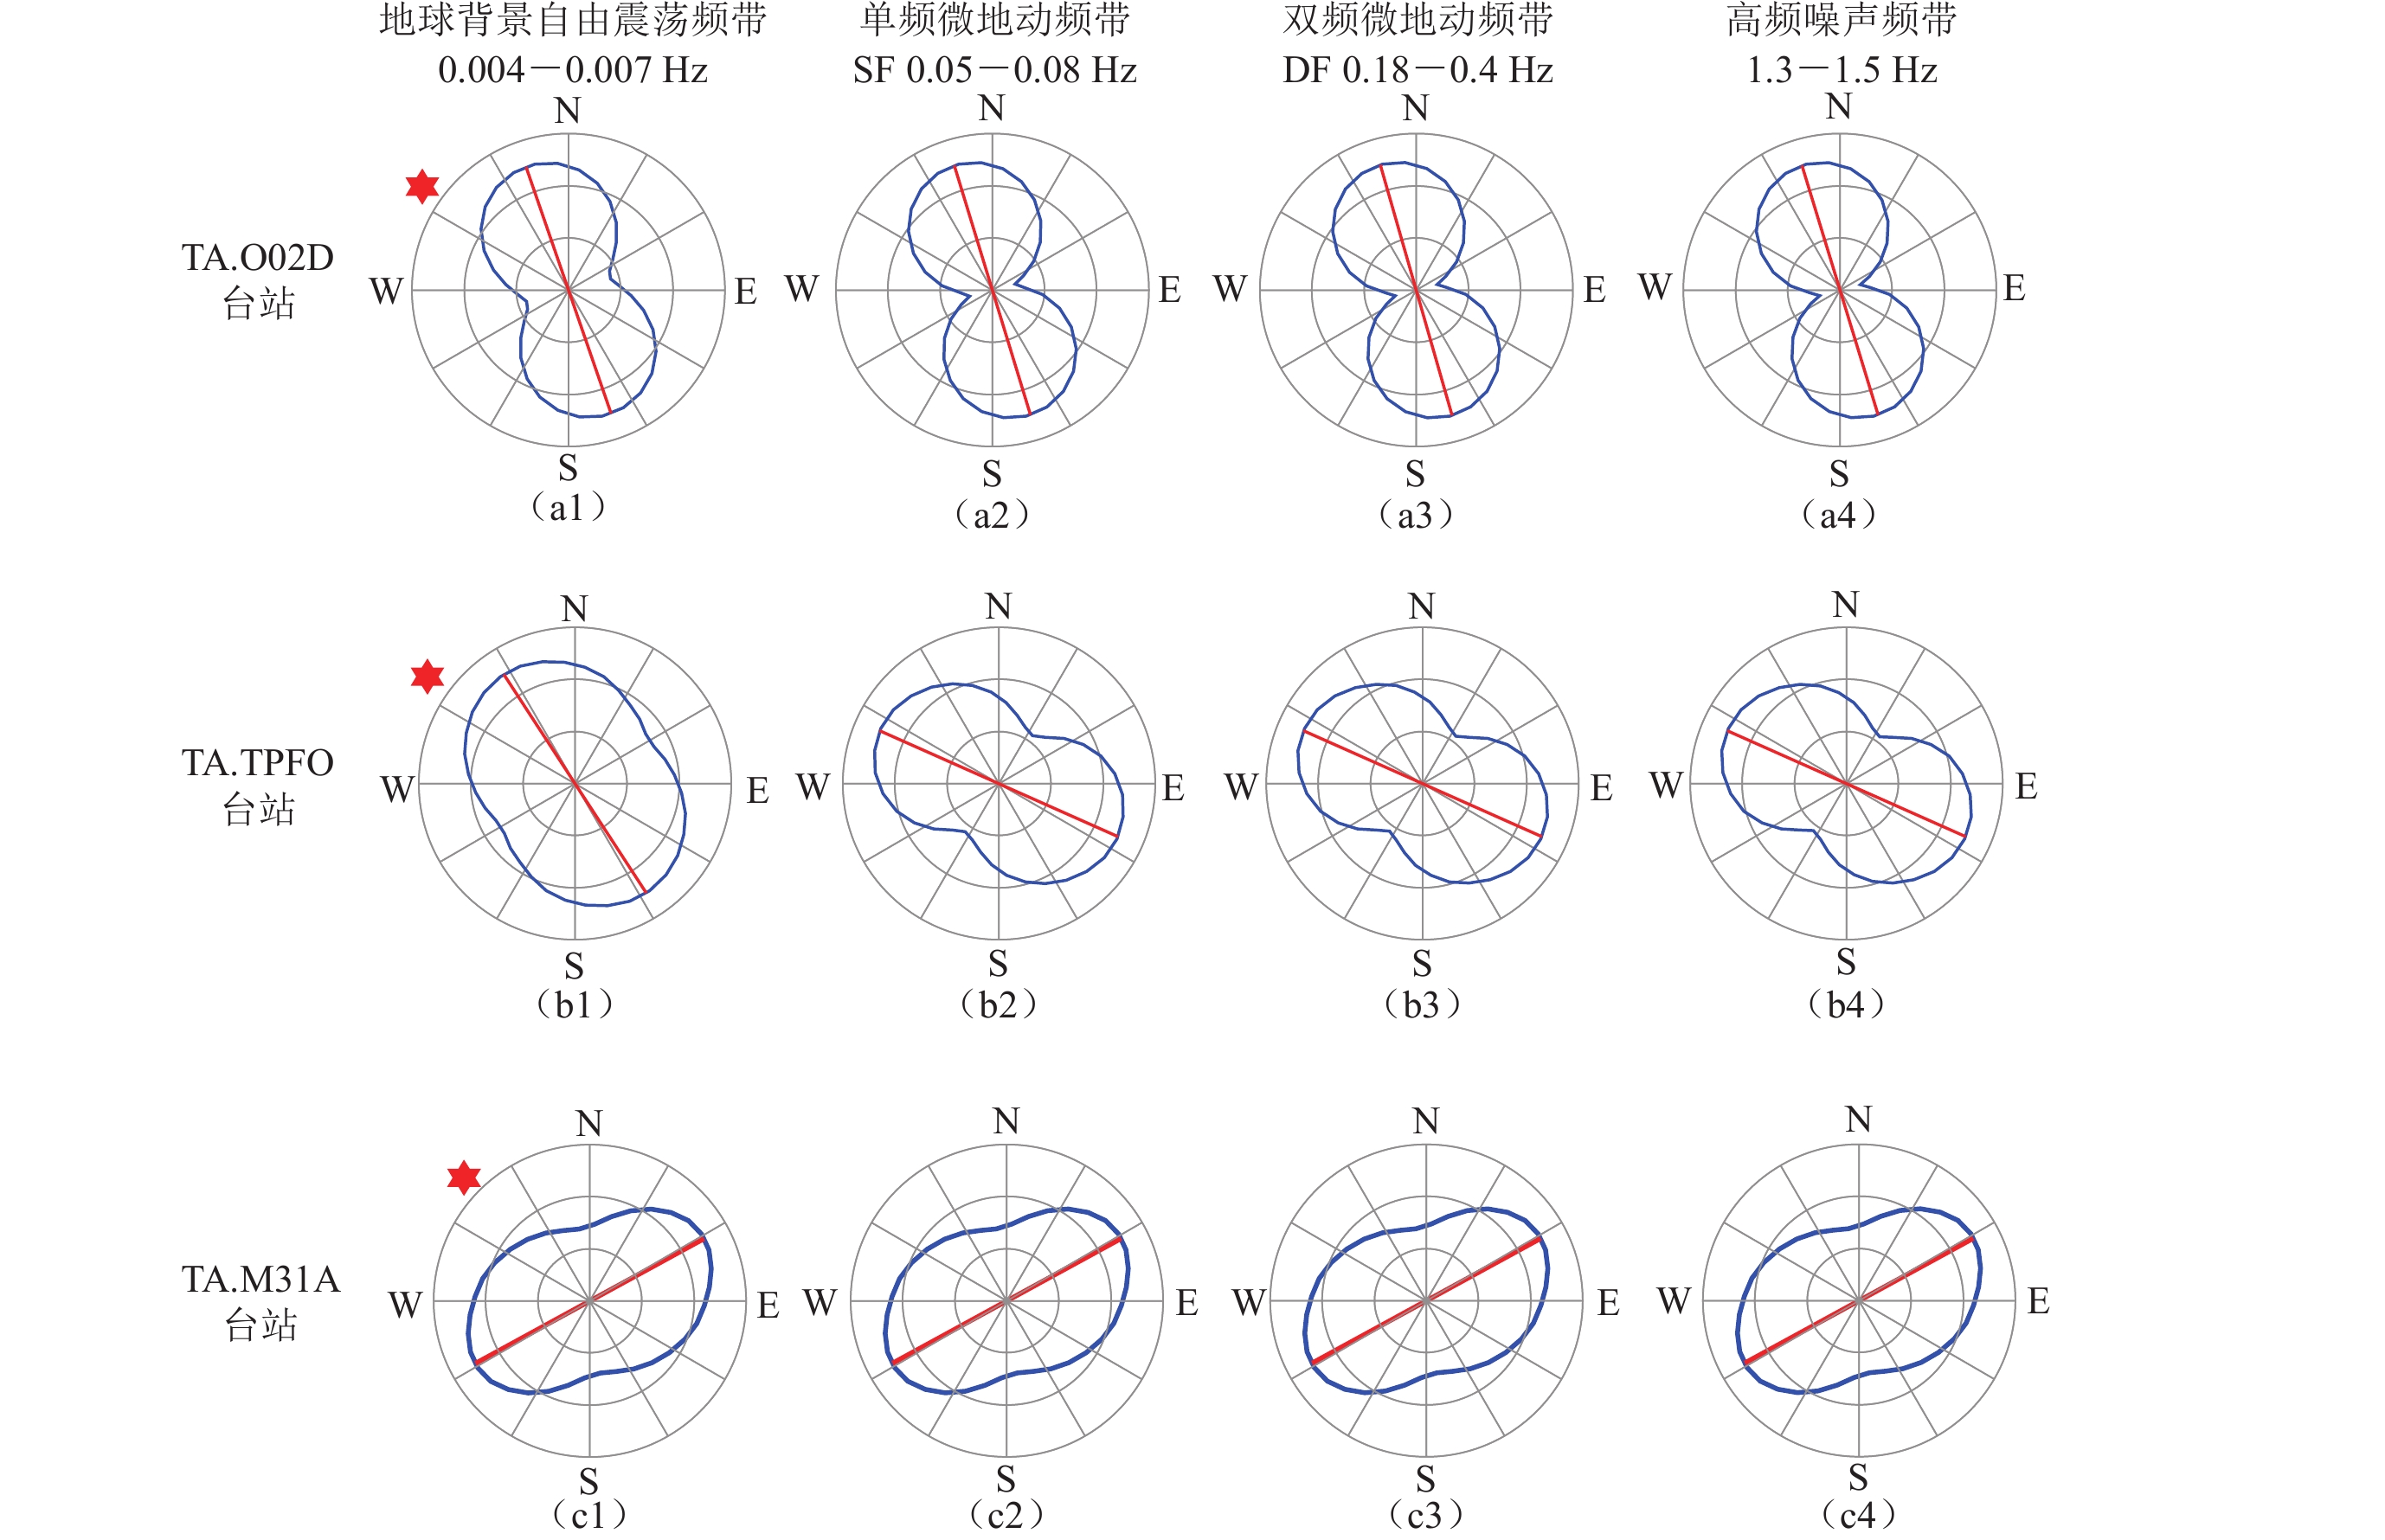
图 6 台站TA.O02D (a),TA.TPFO (b)和TA.M31A (c)的连续地震波形记录在时间窗3月11日15:00—15:30内的极化分析结果(图注说明同图5)
Figure 6. Polarization analysis results of the continuous seismic waveforms of the stations TA.O02D (a),TA.TPFO (b) and TA.M31A (c) recorded from 15:00 to 15:30 on March 11 (The illustrations are the same as Fig. 5)
![]()
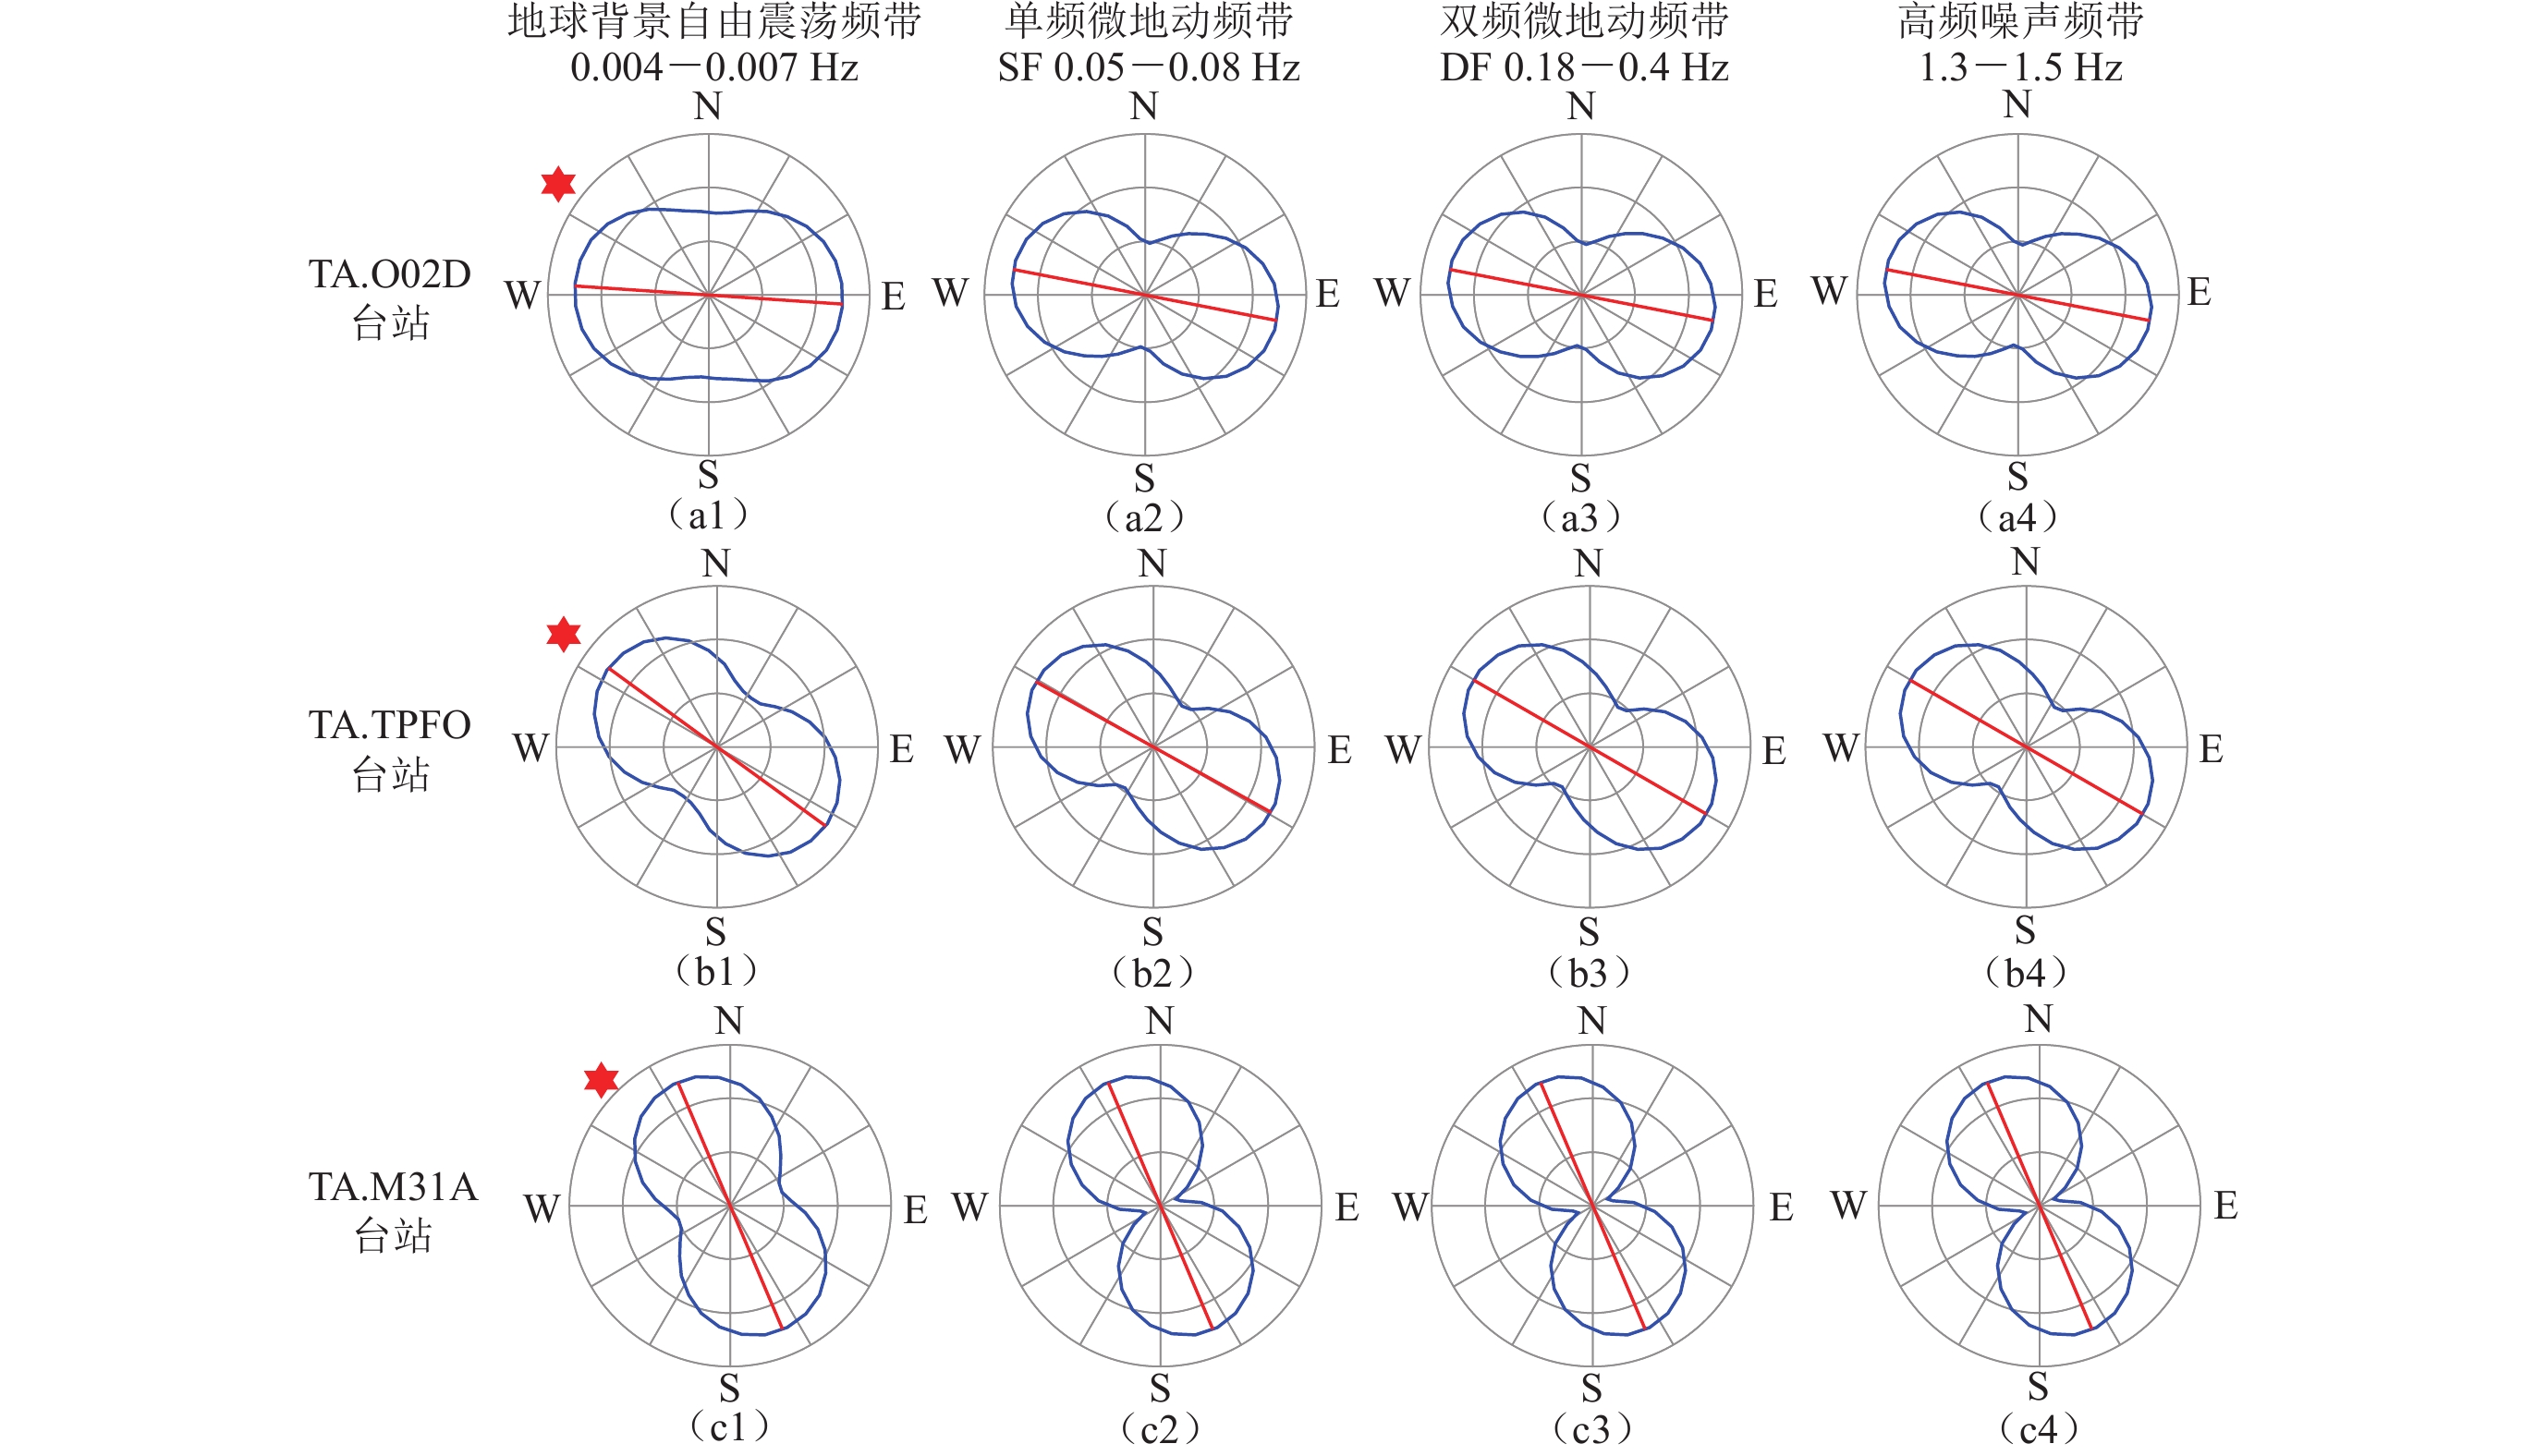
图 7 台站TA.O02D (a),TA.TPFO (b)和TA.M31A (c)的连续地震波形记录在时间窗3月11日15:30—16:00内的极化分析结果(图注说明同图5)
Figure 7. Polarization analysis results of the continuous seismic waveform of the stations TA.O02D (a),TA.TPFO (b) and TA.M31A (c) recorded from 15:30 to 16:00 on March 11,2011 (The illustrations are the same as Fig.5)
![]()
![]()
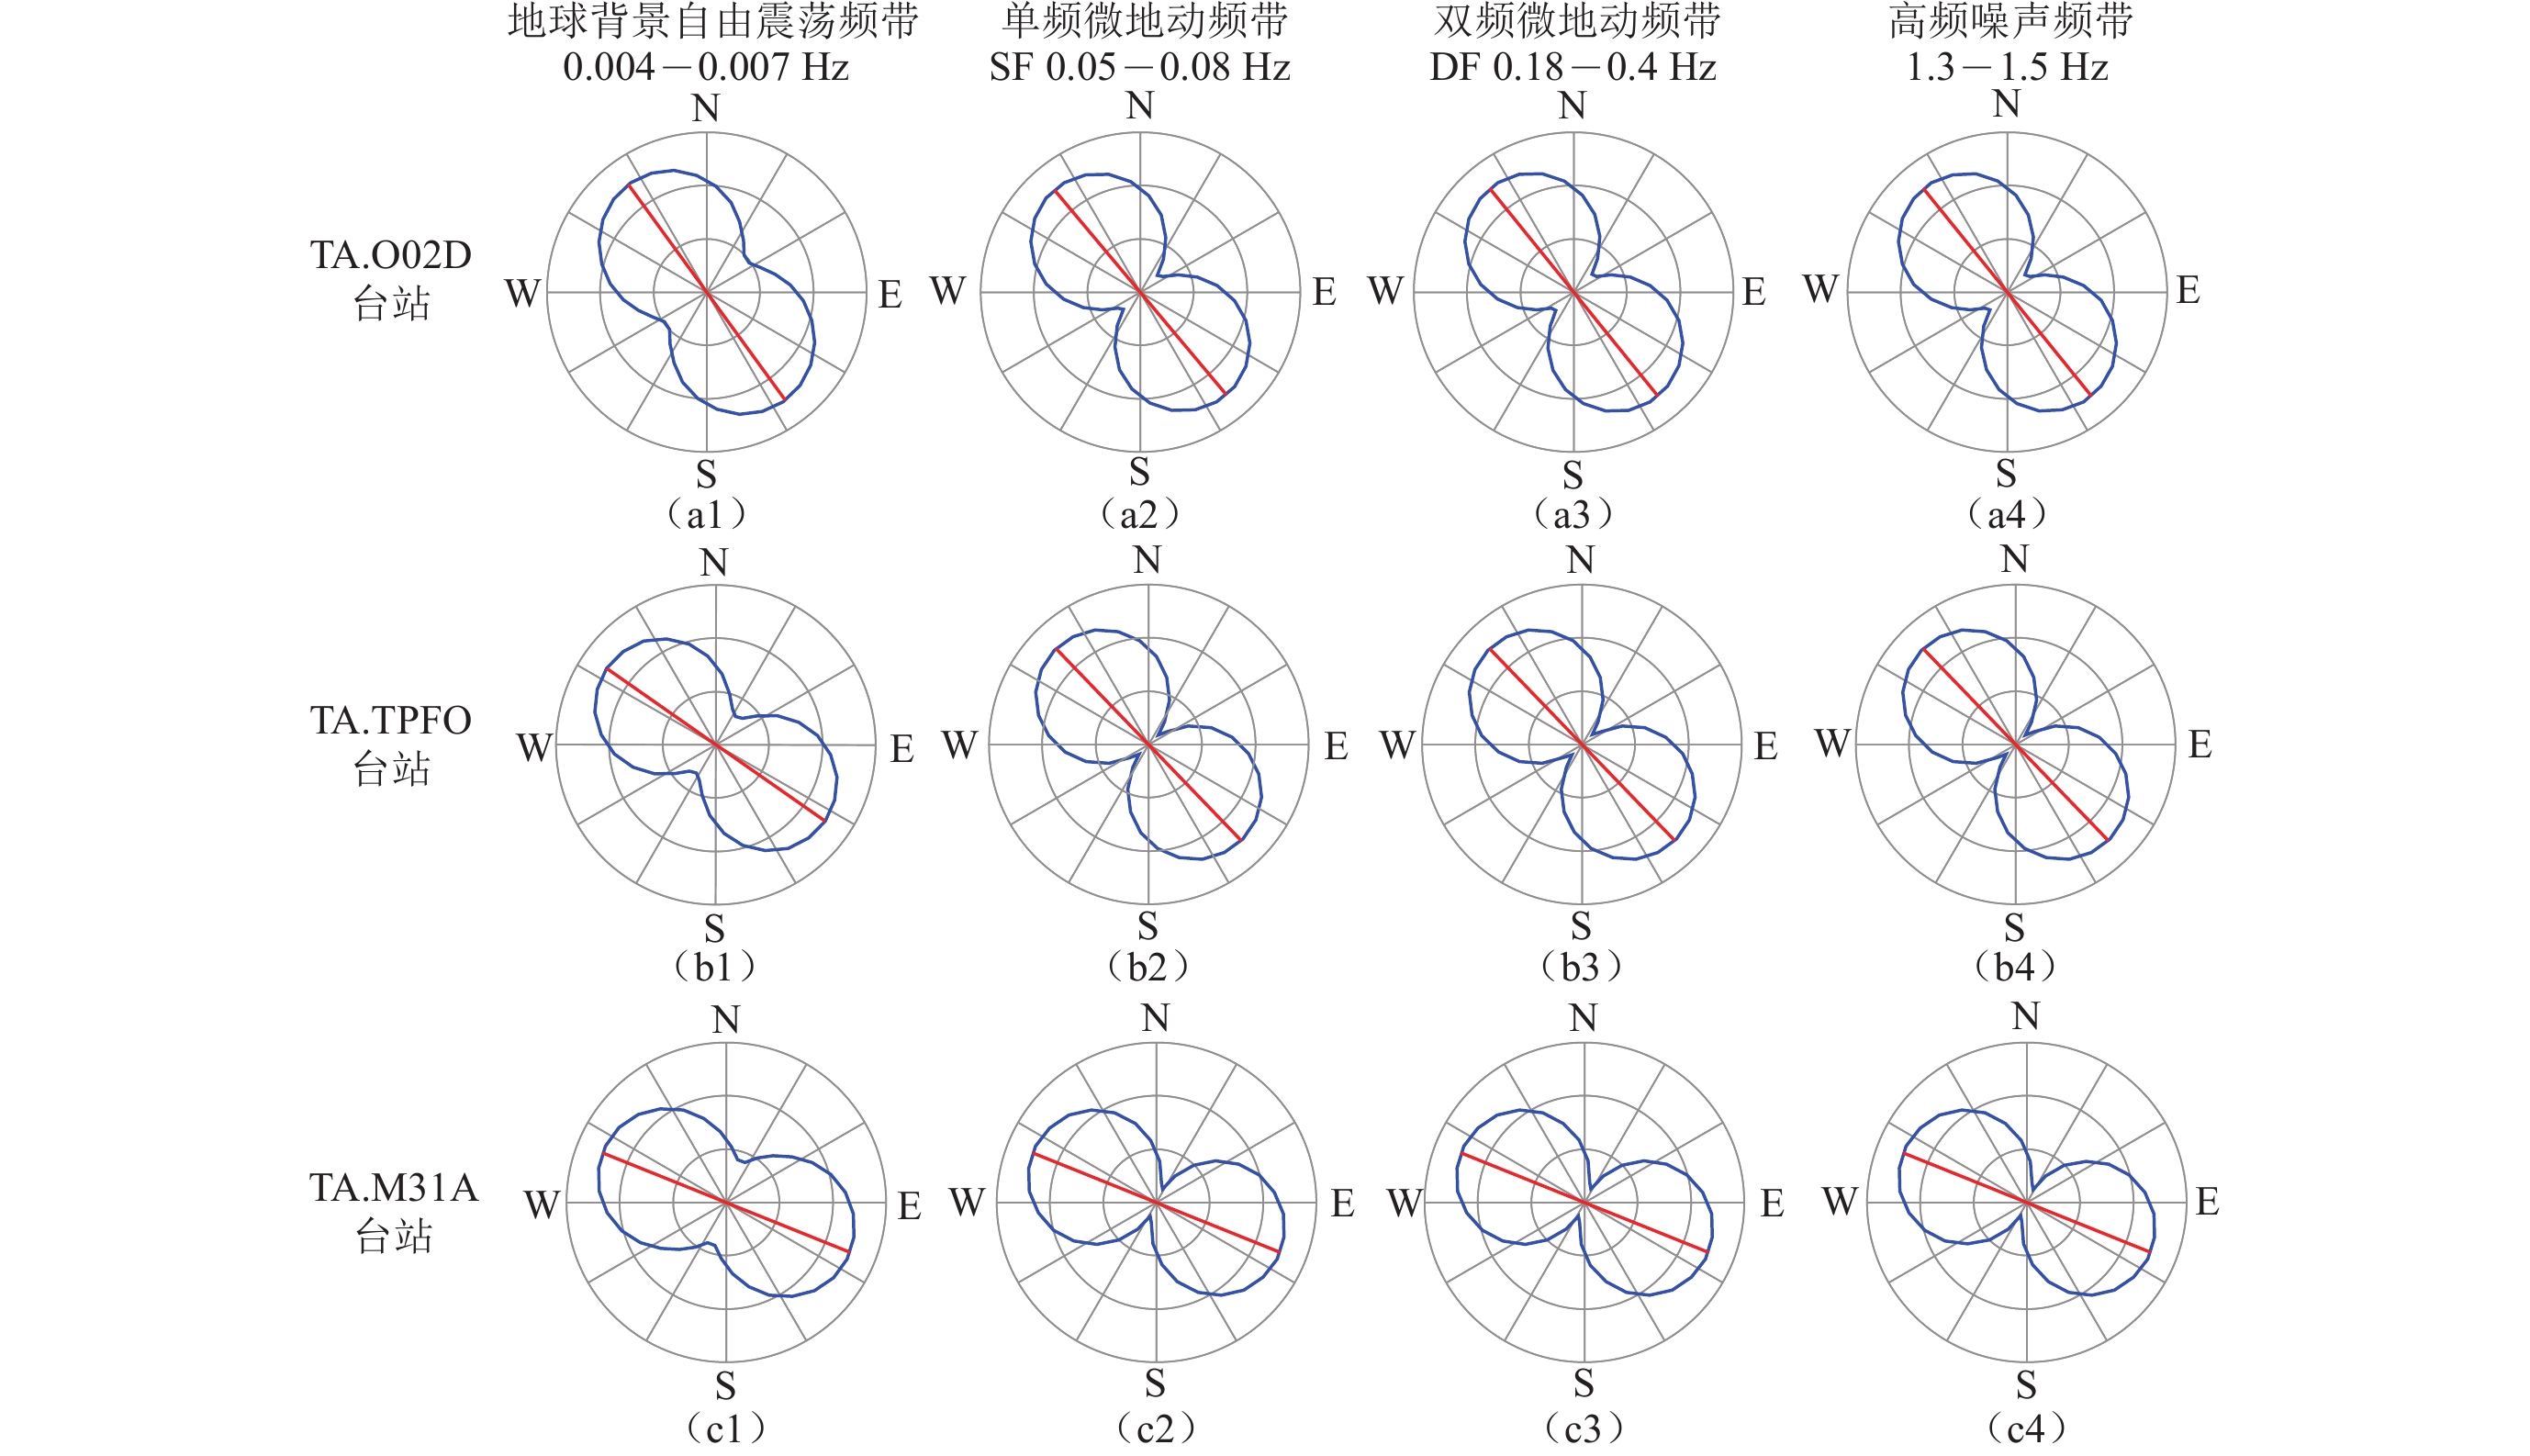
图 9 台站TA.O02D (a),TA.TPFO (b)和TA.M31A (c)的连续地震波形记录在时间窗3月11日22:00—22:30内的极化分析结果(该时窗内无M≥5.0地震发生,图注说明同图5)
Figure 9. Polarization analysis results of the continuous seismic waveforms of the stations TA.O02D (a),TA.TPFO (b) and TA.M31A (c) recorded from 22:00 to 22:30 on March 11 (Note:No M≥5.0 earthquake occurred in the time window,and the illustrations are the same as Fig. 5)
![]()
图 10 台站TA.O02D (a),TA.TPFO (b)和TA.M31A (c)的连续地震波形记录在时间窗3月12日15:00—15:30内的极化分析结果(图注说明同图5)
Figure 10. Polarization analysis results of the continuous seismic waveforms of the stations TA.O02D (a),TA.TPFO (b) and TA.M31A (c) recorded from 15:00 to 15:30 on March 12,2011 (Illustrations are the same as Fig.5)
-
叶琳,于福江,吴玮. 2005. 我国海啸灾害及预警现状与建议[J]. 海洋预报,22(增刊1):147–157. doi: 10.3969/j.issn.1003-0239.2005.z1.021 Ye L,Yu F J,Wu W. 2005. The disaster and warning of tsunami in China and the suggestion in future[J]. Marine Forecasts,22(Z1):147–157 (in Chinese). doi: 10.3969/j.issn.1003-0239.2005.z1.021(inChinese)
Benioff H,Harrison J C,LaCoste L,Munk W H,Slichter L B. 1959. Searching for the Earth’s free oscillations[J]. J Geophys Res,64(9):1334–1337. doi: 10.1029/JZ064i009p01334
Bensen G D,Ritzwoller M H,Barmin M P,Levshin A L,Lin F,Moschetti M P,Shapiro N M,Yang Y. 2007. Processing seismic ambient noise data to obtain reliable broad-band surface wave dispersion measurements[J]. Geophys J Int,169(3):1239–1260. doi: 10.1111/j.1365-246X.2007.03374.x
Bromirski P D,Duennebier F K,Stephen R A. 2005. Mid-ocean microseisms[J]. Geochem Geophys Geosyst,6(4):Q04009. doi: 10.1029/2004gc000768
Bromirski P D. 2009. Earth vibrations[J]. Science,324(5930):1026–1027.
Bromirski P D,Gerstoft P. 2009. Dominant source regions of the Earth’s “hum” are coastal[J]. Geophys Res Lett,36(13):L13303. doi: 10.1029/2009gl038903
Cicconi G,Dagnino I,Eva C. 1983. Comparative spectra of microseisms and swell in the Ligurian Sea[J]. Dev Solid Earth Geophys,15:237–241. doi: 10.1016/B978-0-444-99662-6.50051-4
Ekström G. 2001. Time domain analysis of Earth’s long-period background seismic radiation[J]. J Geophys Res:Solid Earth,106(B11):26483–26493. doi: 10.1029/2000JB000086
Fine I V,Kulikov E A,Cherniawsky J Y. 2013. Japan’s 2011 tsunami:Characteristics of wave propagation from observations and numerical modelling[J]. Pure Appl Geophys,170(6/7/8):1295–1307.
Fujii Y,Satake K. 2007. Tsunami source of the 2004 Sumatra-Andaman earthquake inferred from tide gauge and satellite data[J]. Bull Seismol Soc Am,97(1A):S192–S207. doi: 10.1785/0120050613
Fujii Y,Satake K. 2008. Tsunami sources of the November 2006 and January 2007 great Kuril earthquakes[J]. Bull Seismol Soc Am,98(3):1559–1571. doi: 10.1785/0120070221
Fujii Y,Satake K,Sakai S,Shinohara M,Kanazawa T. 2011. Tsunami source of the 2011 off the Pacific coast of Tohoku earthquake[J]. Earth Planets Space,63(7):815–820.
Fukao Y,Nishida K,Suda N,Nawa K,Kobayashi N. 2002. A theory of the Earth’s background free oscillations[J]. J Geophys Res:Solid Earth,107(B9):2206. doi: 10.1029/2001jb000153
Gerstoft P,Shearer P M,Harmon N,Zhang J. 2008. Global P,PP,and PKP wave microseisms observed from distant storms[J]. Geophys Res Lett,35(23):L23306. doi: 10.1029/2008gl036111
Gilbert F,MacDonald G. 1959. Free oscillations of the Earth[J]. J Geophys Res,64:1103–1104.
Hasselmann K. 1963. A statistical analysis of the generation of microseisms[J]. Rev Geophys,1(2):177–210. doi: 10.1029/RG001i002p00177
Heidarzadeh M,Satake K. 2013. Waveform and spectral analyses of the 2011 Japan tsunami records on tide gauge and DART stations across the Pacific Ocean[J]. Pure Appl Geophys,170(6/7/8):1275–1293. doi: 10.1007/s00024-012-0558-5
Kobayashi N,Nishida K. 1998. Continuous excitation of planetary free oscillations by atmospheric disturbances[J]. Nature,395(6700):357–360. doi: 10.1038/26427
Koper K D,Burlacu R. 2015. The fine structure of double-frequency microseisms recorded by seismometers in North America[J]. J Geophys Res:Solid Earth,120(3):1677–1691. doi: 10.1002/2014jb011820
Lacoss R T,Kelly E J,Toksöz M N. 1969. Estimation of seismic noise structure using arrays[J]. Geophysics,34(1):21–38. doi: 10.1190/1.1439995
Longuet-Higgins M S. 1950. A theory of the origin of microseisms[J]. Philos Trans R Soc Lond A:Math Phys Eng Sci,243(857):1–35. doi: 10.1098/rsta.1950.0012
Longuet-Higgins M S,Ursell F. 1948. Sea waves and microseisms[J]. Nature,162(4122):700. doi: 10.1038/162700a0
McCreery C S,Duennebier F K,Sutton G H. 1993. Correlation of deep ocean noise (0.4−30 Hz) with wind,and the Holu Spectrum:A worldwide constant[J]. J Acoust Soc Am,93(5):2639–2648. doi: 10.1121/1.405838
Mungov G,Eblé M,Bouchard R. 2013. DART® tsunameter retrospective and real-time data:A reflection on 10 years of processing in support of tsunami research and operations[J]. Pure Appl Geophys,170(9/10):1369–1384.
Munk W H. 1963. Some comments regarding diffusion and absorption of tsunamis[C]//Proceedings of the Tsunami Meeting, X Pacific Science Congress. Paris: IUGG Monogr: 31–41.
Nishida K,Kobayashi N. 1999. Statistical features of Earth’s continuous free oscillations[J]. J Geophys Res:Solid Earth,104(B12):28741–28750. doi: 10.1029/1999jb900286
Nishida K,Kobayashi N,Fukao Y. 2000. Resonant oscillations between the solid earth and the atmosphere[J]. Science,287(5461):2244–2246. doi: 10.1126/science.287.5461.2244
Obrebski M J,Ardhuin F,Stutzmann E,Schimmel M. 2012. How moderate sea states can generate loud seismic noise in the deep ocean[J]. Geophys Res Lett,39(11):L11601.
Pugh D, Woodworth P. 2014. Sea-Level Science: Understanding Tides, Surges, Tsunamis and Mean Sea-Level Changes[M]. Cambridge: Cambridge University Press: 60–96.
Rhie J,Romanowicz B. 2004. Excitation of Earth’s continuous free oscillations by atmosphere-ocean-seafloor coupling[J]. Nature,431(7008):552–556. doi: 10.1038/nature02942
Rhie J,Romanowicz B. 2006. A study of the relation between ocean storms and the Earth’s hum[J]. Geochem Geophys Geosyst,7(10):Q10004. doi: 10.1029/2006gc001274
Satake K,Fujii Y,Harada T,Namegaya Y. 2013. Time and space distribution of coseismic slip of the 2011 Tohoku earthquake as inferred from tsunami waveform data[J]. Bull Seismol Soc Am,103(2B):1473–1492. doi: 10.1785/0120120122
Shapiro S L,Carlson L E,Astin J A,Freedman B. 2006. Mechanisms of mindfulness[J]. J Clin Psychol,62(3):373–386. doi: 10.1002/jclp.20237
Shevchenko G,Ivelskaya T,Loskutov A. 2014. Characteristics of the 2011 great Tohoku tsunami on the Russian far east coast:Deep-water and coastal observations[J]. Pure Appl Geophys,171(12):3329–3350. doi: 10.1007/s00024-013-0727-1
Stehly L,Campillo M,Shapiro N M. 2006. A study of the seismic noise from its long-range correlation properties[J]. J Geophys Res:Solid Earth,111(B10):B10306. doi: 10.1029/2005jb004237
Suda N,Nawa K,Fukao Y. 1998. Earth’s background free oscillations[J]. Science,279(5359):2089–2091. doi: 10.1126/science.279.5359.2089
Sun T H Z,Xue M,Le K P,Zhang Y W,Xu H P. 2013. Signatures of ocean storms on seismic records in South China Sea and East China Sea[J]. Mar Geophys Res,34(3/4):431–448. doi: 10.1007/s11001-013-9204-6
Tanimoto T,Um J. 1999. Cause of continuous oscillations of the Earth[J]. J Geophys Res:Solid Earth,104(B12):28723–28739. doi: 10.1029/1999jb900252
Tanimoto T. 2005. The oceanic excitation hypothesis for the continuous oscillations of the Earth[J]. Geophys J Int,160(1):276–288. doi: 10.1111/j.1365-246X.2004.02484.x
Tanimoto T,Ishimaru S,Alvizuri C. 2006. Seasonality in particle motion of microseisms[J]. Geophys J Int,166(1):253–266. doi: 10.1111/j.1365-246X.2006.02931.x
Tanimoto T. 2007. Excitation of microseisms[J]. Geophys Res Lett,34(5):L05308. doi: 10.1029/2006gl029046
Titov V,Rabinovich A B,Mofjeld H O,Thomson R E,Gonzalez F I. 2005. The global reach of the 26 December 2004 Sumatra tsunami[J]. Science,309(5743):2045–2048. doi: 10.1126/science.1114576
Toksöz M N,Lacoss R T. 1968. Microseisms:Mode structure and sources[J]. Science,159(3817):872–873. doi: 10.1126/science.159.3817.872
USGS. 2020. Search earthquake catalog[EB/OL]. [2020-03-12]. https://earthquake.usgs.gov/earthquakes/search/.
Watada S, Masters G. 2001. Oceanic excitation of the continuous oscillations of the Earth[J]. Eos Trans AGU, 82: SS2A-062082.
Webb S C. 2007. The Earth’s ‘hum’ is driven by ocean waves over the continental shelves[J]. Nature,445(7129):754–756. doi: 10.1038/nature05536
Xiao H,Xue M,Yang T,Liu C G,Hua Q F,Xia S H,Huang H B,Le B M,Yu Y Q,Huo D,Pan M H,Li L,Gao J Y. 2018. The characteristics of microseisms in South China Sea:Results from a combined data set of OBSs,broadband land seismic stations,and a global wave height model[J]. J Geophys Res:Solid Earth,123(5):3923–3942. doi: 10.1029/2017jb015291
Ye L L,Lay T,Kanamori H. 2013. Ground shaking and seismic source spectra for large earthquakes around the megathrust fault offshore of northeastern Honshu,Japan[J]. Bull Seismol Soc Am,103(2B):1221–1241. doi: 10.1785/0120120115
Zhang J,Gerstoft P,Shearer P M. 2009. High-frequency P-wave seismic noise driven by ocean winds[J]. Geophys Res Lett,36(9):L09302. doi: 10.1029/2009gl037761
Zhang J,Gerstoft P,Bromirski P D. 2010a. Pelagic and coastal sources of P-wave microseisms:Generation under tropical cyclones[J]. Geophys Res Lett,37(15):L15301. doi: 10.1029/2010gl044288
Zhang J,Gerstoft P,Shearer P M. 2010b. Resolving P-wave travel-time anomalies using seismic array observations of oceanic storms[J]. Earth Planet Sci Lett,292(3/4):419–427. doi: 10.1016/j.jpgl.2010.02.014
-
期刊类型引用(5)
1. 焦豪,马强,周凤玺. P波入射下饱和冻土自由场地地震地面运动分析. 冰川冻土. 2024(01): 137-151 .  百度学术
百度学术
2. 周凤玺,姚桃岐,柳鸿博. P_1波在非饱和土自由边界上反射的能量特性研究. 振动工程学报. 2024(12): 2066-2077 . 百度学术
3. 柯小飞,陈少林,张洪翔. 海水-海床体系在P-SV波入射时的动力响应分析. 建筑结构. 2018(S2): 915-919 . 百度学术
4. 赵宇昕,陈少林. 关于传递矩阵法分析饱和成层介质响应问题的讨论. 力学学报. 2016(05): 1145-1158 . 百度学术
5. 赵瑞斌,毕铭,张彦,刘中宪,吴朝阳. 半空间SV波斜入射在土体中的应力路径及空心圆柱动扭剪试验模拟. 世界地震工程. 2016(04): 231-238 . 百度学术
其他类型引用(11)

 下载:
下载:


计量
- 文章访问数: 863
- HTML全文浏览量: 507
- PDF下载量: 65
- 被引次数: 16
