Quantitative evaluation of modeling error in Lg-wave attenuation model
-
摘要: 对Lg波衰减模型中建模误差的统计特征进行了系统研究,并建立了地壳二维Lg波衰减模型。由于Lg波振幅可能受到几何扩散函数的强烈影响,合理评估反演过程的误差对于能否使用最小二乘意义下的反演非常重要。通过在川滇及其邻近地区收集的建模误差样本,使用K-S数值检验方法、Q-Q图和正态分布图形检验方法对Lg波衰减层析成像反演的输入数据中建模误差的分布特征进行了统计分析。采用奇异值分解(SVD)和反投影方法,分别获得了川滇地区的QLg模型,定量计算模型的协方差矩阵和分辨率矩阵,定量评估了QLg模型中每个格点的分辨率和误差。结果表明:在一阶近似条件下建模误差服从正态分布;通过开发的数据筛选程序,可以产生一个接近完美正态分布的数据集;与反投影方法相比,利用SVD方法获得的地壳Q值的分辨率更高;在射线覆盖较好的区域,QLg模型的分辨率达到100 km,相对误差小于3%。Abstract: In this study, we performed comprehensive statistical studies for the characteristics of the modeling error in Lg-wave attenuation model and obtained a two-dimensional crustal Lg-wave attenuation model. The amplitudes of Lg-wave can be strongly influenced by the geometrical spreading function and it is essential to reasonably evaluate the error of the inversion process if we use the inverted method under the meaning of least squares. Based on the modeling error samples collected in the Sichuan-Yunnan region and its adjacent areas, we use three statistical test methods, namely the K-S test, the Q-Q plot, and the normal distribution plot, to analyze the distribution characteristics of modeling errors in the input data of Lg- wave attenuation tomography inversion. We used both the SVD-based tomographic method and the back-projection method to invert for the Lg Q model of the Sichuan-Yunnan region and its adjacent area respectively. Then, we calculated the covariance matrix and the resolution matrix of the model and evaluated the resolution and error of each grid point in the Lg Q model quantitatively. Our results indicate that the modeling errors in the input data obeyed a normal distribution under first-order approximation. By using the data screening technique, we generated a new dataset with nearly perfect normally distributed for Q tomography. Compared with the result of back-projection, the SVD-based method could allow for obtaining a finer resolution of crustal Q value in the areas with dense ray path coverages, where the model resolution can be resolved within a range of 100 km with a relative error of less than 3%.
-
-
图 1 研究所用地震事件震中(a)和研究区台站(b)分布图
图中红色矩形框代表研究区域和台站所在区域;黑线为主要地块分界线,灰线为主要断裂带,下同
Figure 1. Distribution of epicenters of events (a) and seismic stations (b) in this study
Red rectangular represents the extent of the study area;the black solid lines indicate the major tectonic block boundaries and the grey dashed lines indicate faults,the same below
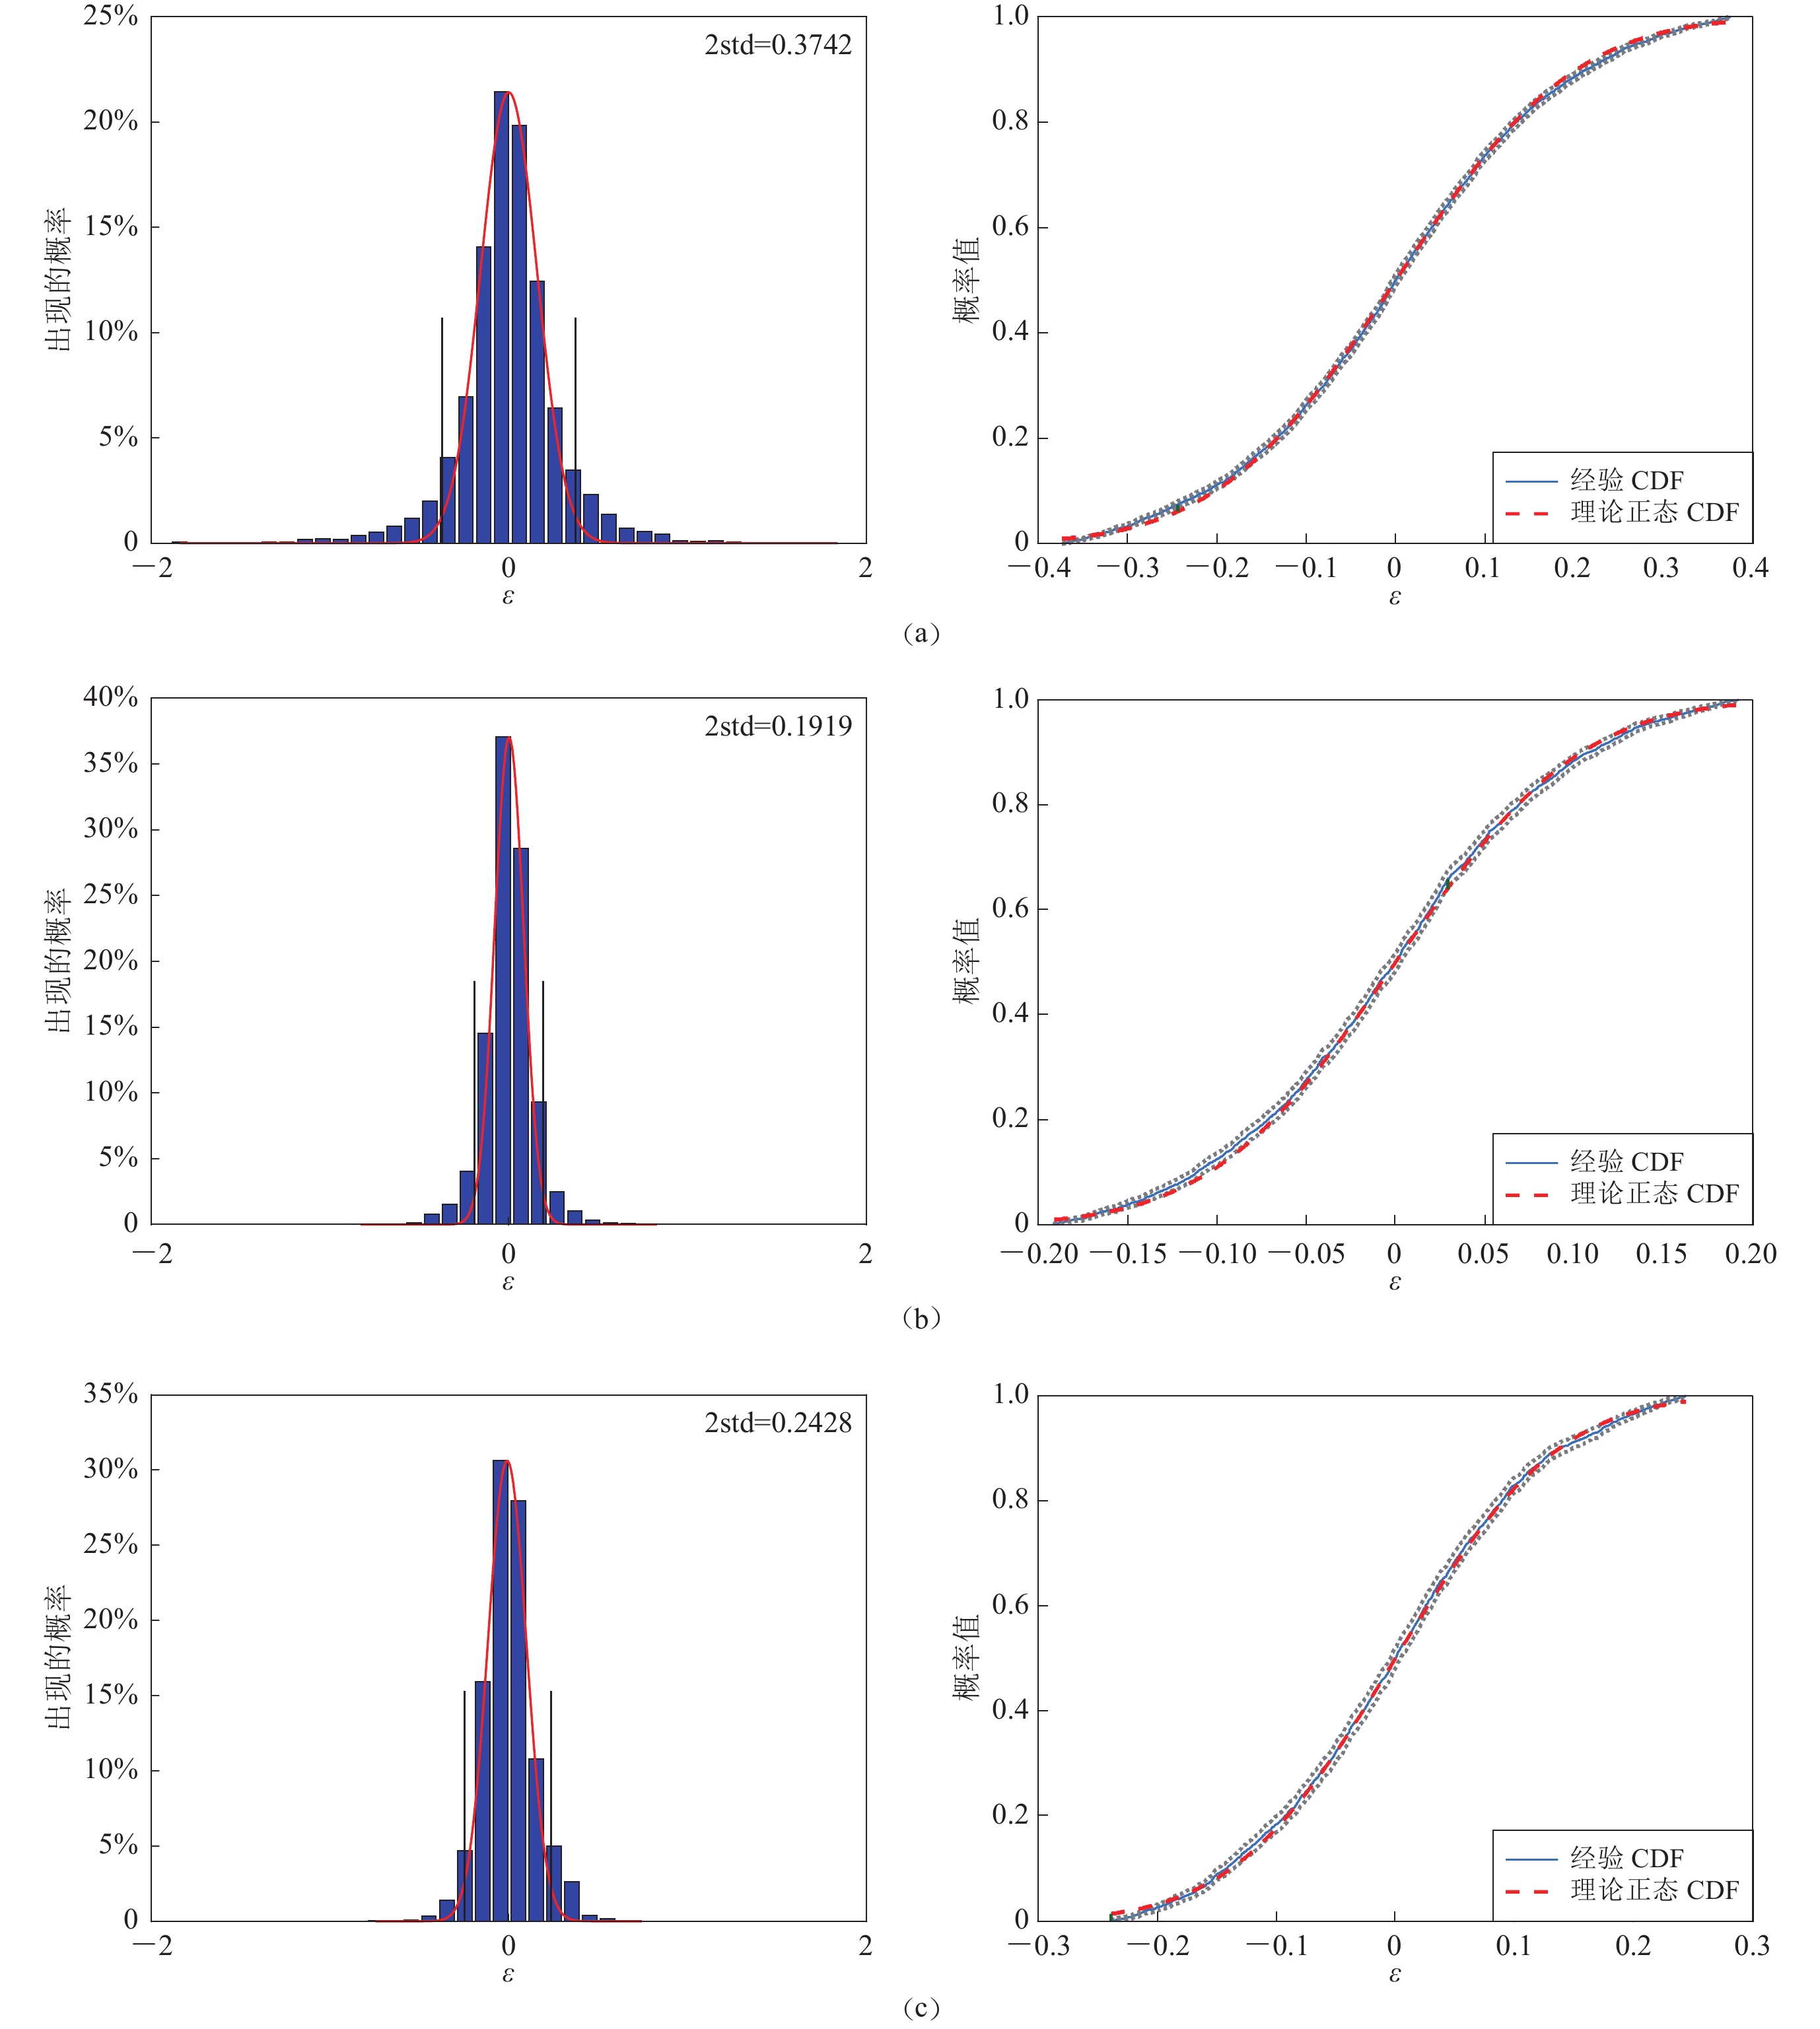
图 3 建模误差
$\varepsilon$ 样本分布(左)和K-S检测图(右)(a) TS方法;(b) RTS方法;(c)RTE方法。左图中两条黑色直线标记了数据筛选准则|ε-median(ε)|>2std(ε)的区间,红色线表示最佳的正态概率密度函数值;右图中灰色线代表着95%置信区间的CDF的上下界限,绿色小线段代表着K-S检验的经验CDF和理论CDF之间的最大垂向差值
Figure 3. Distribution of samples of modeling error
$\varepsilon$ (left)and results of K-S test (right)(a) TS method;(b) RTS method ;(c) RTS method. The black lines in the left figure mark the interval of |ε-median(ε)|>2std(ε),which we use as criteria for data screening and the best-fit theoretical normal PDF of the screened samples is plotted over the distribution map with the red line. The grey lines in the right figure indicate lower and upper 95 percent confidence bounds for the CDF and the green segment indicates the maximum distance from the empirical CDF to the theoretical normal CDF which is used in the K-S test
表 1 使用TS,RTS和RTE方法估计ε的详细信息
Table 1 Estimated ε information using TS, RTS and RTE methods
方法 $ {\varepsilon } $样本的
数量误差在两个标准差
内的$ \varepsilon $占比ECDF和NCDF的
相关系数K-S测试结果 标准差
std$ ( \varepsilon ) $方差Var$ ( \varepsilon ) $ P值 显著性水平$ \alpha $ TS 8 220 87.09% 99.99% 在置信度为95%下接受零假设 0.158 5 0.025 1 0.693 1 0.05 RTS 3 652 88.12% 99.98% 在置信度为95%下接受零假设 0.081 6 0.006 7 0.324 0 0.05 RTE 2 839 93.59% 99.64% 在置信度为95%下接受零假设 0.104 9 0.011 0 0.280 1 0.05 -
邓起东,张培震,冉勇康,杨晓平,闵伟,楚全芝. 2002. 中国活动构造基本特征[J]. 中国科学:D辑,32(12):1020–1030. Deng Q D,Zhang P Z,Ran Y K,Yang X P,Min W,Chu Q Z. 2003. Basic characteristics of active tectonics of China[J]. Science in China:Series D,46(4):356–372.
盛骤, 谢式千, 潘承毅. 2008. 概率论与数理统计[M]. 北京: 高等教育出版社: 119–126. Sheng Z, Xie S Q, Pan C Y. 2008. Probability Theory and Mathematical Statistics[M]. Beijing: Higher Education Press: 119–126 (in Chinese).
郑秀芬,欧阳飚,张东宁,姚志祥,梁建宏,郑洁. 2009. “国家数字测震台网数据备份中心”技术系统建设及其对汶川大地震研究的数据支撑[J]. 地球物理学报,52(5):1412–1417. Zheng X F,Ouyang B,Zhang D N,Yao Z X,Liang J H,Zheng J. 2009. Technical system construction of Data Backup Centre for China Seismograph Network and the data support to researches on the Wenchuan earthquake[J]. Chinese Journal of Geophysics,52(5):1412–1417 (in Chinese).
周连庆,赵翠萍,修济刚,陈章立. 2008. 川滇地区Lg波Q值层析成像[J]. 地球物理学报,51(6):1745–1752. doi: 10.3321/j.issn:0001-5733.2008.06.015 Zhou L Q,Zhao C P,Xiu J G,Chen Z L. 2008. Tomography of QLg in Sichuan-Yunnan zone[J]. Chinese Journal of Geophysics,51(6):1745–1752 (in Chinese).
Akinci A,Del Pezzo E,Ibáñez J M. 1995. Separation of scattering and intrinsic attenuation in southern Spain and western Anatolia (Turkey)[J]. Geophys J Int,121(2):337–353. doi: 10.1111/j.1365-246X.1995.tb05715.x
Backus G,Gilbert F. 1970. Uniqueness in the inversion of inaccurate gross Earth data[J]. Philosophical Transactions of the Royal Society of London. Series A:Mathematical and Physical Sciences,266(1173):123–192.
Bostock M G,Kennett B L N. 1990. The effect of 3-D structure on Lg propagation patterns[J]. Geophys J Int,101(2):355–364. doi: 10.1111/j.1365-246X.1990.tb06574.x
Chen Y L,Xie J K. 2017. Resolution,uncertainty and data predictability of tomographic Lg attenuation models:Application to southeastern China[J]. Geophys J Int,210(1):166–183. doi: 10.1093/gji/ggx147
Chun K Y,West G F,Kokoski R J,Samson C. 1987. A novel technique for measuring Lg attenuation-results from eastern Canada between 1 to 10 Hz[J]. Bull Seismol Soc Am,77(2):398–419. doi: 10.1785/BSSA0770020398
Dai A,Tang C C,Liu L,Xu R. 2020. Seismic attenuation tomography in southwestern China:Insight into the evolution of crustal flow in the Tibetan Plateau[J]. Tectonophysics,792:228589. doi: 10.1016/j.tecto.2020.228589
Gallegos A,Ranasinghe N,Ni J,Sandvol E. 2014. Lg attenuation in the central and eastern United States as revealed by the Earth Scope Transportable Array[J]. Earth Planet Sci Lett,402:187–196. doi: 10.1016/j.jpgl.2014.01.049
Gibbons S J,Kværna T,Ringdal F. 2010. Considerations in phase estimation and event location using small-aperture regional seismic arrays[J]. Pure Appl Geophys,167(4/5):381–399.
Gök R,Sandvol E,Türkelli N,Seber D,Barazangi M. 2003. Sn attenuation in the Anatolian and Iranian plateau and surrounding regions[J]. Geophys Res Lett,30(24):8042.
Gung Y,Romanowicz B. 2004. Q tomography of the upper mantle using three-component long-period waveforms[J]. Geophys J Int,157(2):813–830. doi: 10.1111/j.1365-246X.2004.02265.x
Hearn T M,Wang S Y,Pei S P,Xu Z H,Ni J F,Yu Y X. 2008. Seismic amplitude tomography for crustal attenuation beneath China[J]. Geophys J Int,174(1):223–234. doi: 10.1111/j.1365-246X.2008.03776.x
Ji C,Tsuboi S,Komatitsch D,Tromp J. 2005. Rayleigh-wave multipathing along the West coast of North America[J]. Bull Seismol Soc Am,95(6):2115–2124. doi: 10.1785/0120040180
Kennett B L N. 1986. Lg waves and structural boundaries[J]. Bull Seismol Soc Am,76(4):1133–1141.
Larsen R M, 1998. Lanczos Bidiagonalization With Partial Reorthogonalization[D]. Jutland: Aarhus University: 8–87.
Liang X F,Sandvol E,Kay S,Heit B,Yuan X H,Mulcahy P,Chen C,Brown L,Comte D,Alvarado P. 2014. Delamination of southern Puna lithosphere revealed by body wave attenuation tomography[J]. J Geophys Res:Solid Earth,119(1):549–566. doi: 10.1002/2013JB010309
Marden J I. 2004. Positions and QQ plots[J]. Statist Sci,19(4):606–614.
Massey F J. 1951. The Kolmogorov-Smirnov test for goodness of fit[J]. J Am Statist Associat,46(253):68–78. doi: 10.1080/01621459.1951.10500769
McNamara D E,Owens T J,Walter W R. 1996. Propagation characteristics of L
g across the Tibetan Plateau[J]. Bull Seismol Soc Am,86(2):457–469. doi: 10.1785/BSSA0860020457 Menke W,Holmes R C,Xie J K. 2006. On the nonuniqueness of the coupled origin time-velocity tomography problem[J]. Bull Seismol Soc Am,96(3):1131–1139. doi: 10.1785/0120050192
Mitchell B J. 1995. Anelastic structure and evolution of the continental crust and upper mantle from seismic surface wave attenuation[J]. Rev Geophys,33(4):441–462. doi: 10.1029/95RG02074
Mitchell B J,Hwang H J. 1987. Effect of low Q sediments and crustal Q on L
g attenuation in the United States[J]. Bull Seismol Soc Am,77(4):1197–1210. doi: 10.1785/BSSA0770041197 Mitchell B J,Pan Y,Xie J K,Cong L L. 1997. L
g coda Q variation across Eurasia and its relation to crustal evolution[J]. J Geophys Res:Solid Earth,102(B10):22767–22779. doi: 10.1029/97JB01894 Nolet G. 1987. Seismic Tomography: With Applications in Global Seismology and Exploration Geophysics[M]. Dordrecht: Springer: 1–24.
Nuttli O W. 1980. The excitation and attenuation of seismic crustal phases in Iran[J]. Bull Seismol Soc Am,70(2):469–485. doi: 10.1785/BSSA0700020469
Pasyanos M E,Matzel E M,Walter W R,Rodgers A J. 2009. Broad-band L
g attenuation modelling in the Middle East[J]. Geophys J Int,177(3):1166–1176. doi: 10.1111/j.1365-246X.2009.04128.x Pei S P,Zhao J M,Rowe C A,Wang S Y,Hearn T M,Xu Z H,Liu H B,Sun Y S. 2006. ML amplitude tomography in North China[J]. Bull Seismol Soc Am,96(4A):1560–1566. doi: 10.1785/0120060021
Pukelsheim F. 1994. The three sigma rule[J]. Am Statist,48(2):88–91.
Rietbrock A. 2001. P wave attenuation structure in the fault area of the 1995 Kobe earthquake[J]. J Geophys Res:Solid Earth,106(B3):4141–4154. doi: 10.1029/2000JB900234
Rodgers A J,Ni J F,Hearn T M. 1997. Propagation characteristics of short-period Sn and Lg in the Middle East[J]. Bull Seismol Soc Am,87(2):396–413.
Romanowicz B. 1998. Attenuation tomography of the earth’s mantle:A review of current status[J]. Pure Appl Geophys,153(2):257–272.
Schurr B,Asch G,Rietbrock A,Trumbull R,Haberland C. 2003. Complex patterns of fluid and melt transport in the central Andean subduction zone revealed by attenuation tomography[J]. Earth Planet Sci Lett,215(1/2):105–119.
Sereno T J Jr,Bratt S R,Bache T C. 1988. Simultaneous inversion of regional wave spectra for attenuation and seismic moment in Scandinavia[J]. J Geophys Res:Solid Earth,93(B3):2019–2035. doi: 10.1029/JB093iB03p02019
Street R L,Herrmann R B,Nuttli O W. 1975. Spectral characteristics of the L
g wave generated by central United States earthquakes[J]. Geophys J Int,41(1):51–63. doi: 10.1111/j.1365-246X.1975.tb05484.x Tian H Y,He C S,Santosh M. 2021. S-wave velocity structure of the Sichuan-Yunnan region,China:Implications for extrusion of Tibet Plateau and seismic activities[J]. Earth Space Sci,8(7):e2021EA001640.
Vrbik J. 2020. Deriving CDF of Kolmogorov-Smirnov test statistic[J]. Appl Math,11(3):227–246. doi: 10.4236/am.2020.113018
Wei Z,Zhao L. 2019. Lg Q model and its implication on high-frequency ground motion for earthquakes in the Sichuan and Yunnan region[J]. Earth Planet Phys,3(6):526–536.
Wheelan C. 2013. Naked Statistics[M]. London: W W Norton & Company: 19–292.
Xie J K. 1993. Simultaneous inversion for source spectrum and path Q using L
g with application to three semipalatinsk explosions[J]. Bull Seismol Soc Am,83(5):1547–1562. doi: 10.1785/BSSA0830051547 Xie J K. 1998. Spectral inversion of Lg from earthquakes:A modified method with applications to the 1995,western Texas earthquake sequence[J]. Bull Seismol Soc Am,88(6):1525–1537.
Xie J. 2002. Lg Q in the eastern Tibetan Plateau[J]. Bull Seismol Soc Am,92(2):871–876. doi: 10.1785/0120010154
Xie J,Mitchell B J. 1990. A back-projection method for imaging large-scale lateral variations of L
g coda Q with application to continental Africa[J]. Geophys J Int,100(2):161–181. doi: 10.1111/j.1365-246X.1990.tb02477.x Xie J,Gok R,Ni J,Aoki Y. 2004. Lateral variations of crustal seismic attenuation along the INDEPTH profiles in Tibet from LgQ inversion[J]. J Geophys Res:Solid Earth,109(B10):B10308.
Xie J,Wu Z,Liu R,Schaff D,Liu Y,Liang J. 2006. Tomographic regionalization of crustal Lg Q in eastern Eurasia[J]. Geophys Res Lett,33(3):L03315.
Yang X. 2002. A numerical investigation of Lg geometrical spreading[J]. Bull Seismol Soc Am,92(8):3067–3079. doi: 10.1785/0120020046
Zhao L F,Xie X B,Wang W M,Zhang J H,Yao Z X. 2010. Seismic Lg-wave Q tomography in and around northeast China[J]. J Geophys Res:Solid Earth,115(B8):B08307.
Zhao L F,Xie X B,He J K,Tian X B,Yao Z X. 2013. Crustal flow pattern beneath the Tibetan Plateau constrained by regional Lg-wave Q tomography[J]. Earth Planet Sci Lett,383:113–122. doi: 10.1016/j.jpgl.2013.09.038
Zhao L F,Xie X B. 2016. Strong Lg-wave attenuation in the Middle East continental collision orogenic belt[J]. Tectonophysics,674:135–146. doi: 10.1016/j.tecto.2016.02.025
Zor E,Sandvol E,Xie J,Türkelli N,Mitchell B,Gasanov A H,Yetirmishli G. 2007. Crustal attenuation within the Turkish Plateau and surrounding regions[J]. Bull Seismol Soc Am,97(1B):151–161. doi: 10.1785/0120050227


 下载:
下载:


