

Rupture process of the MS6.9 Menyuan,Qinghai, earthquake on January 8,2022
-
摘要:
基于近台强震波形数据可快速且稳定地反演地震破裂过程。利用国家地震烈度速报与预警工程实施过程中青海地区新建和改建的强震动观测台站的波形数据,基于迭代反褶积和叠加法(IDS)对2022年1月8日青海门源MS6.9地震的震源破裂过程进行了反演。反演结果显示:破裂为自初始破裂点向ESE向扩展的单侧破裂,持续时间约为14 s (主要集中在2—8 s),最大滑动量为3.6 m,破裂长度约为20 km。破裂在纵向上自深部向浅部扩展,这与现场调查的地表破裂吻合。余震序列空间分布展示出显著的分段特征,预示了破裂区复杂的构造。
Abstract:Based on the waveform data observed by the near field strong-motion stations, the earthquake rupture process can be quickly and stably inverted. This paper collected waveform data recorded by the strong-motion stations constructed recently and reconstructed in Qinghai during the implementation of the National Seismic Intensity Rapid Report and Early Warning Project. Based on these data, we performed the inversion for the rupture process of the MS6.9 Menyuan, Qinghai, earthquake on January 8, 2022 by the iterative deconvolution and stacking (IDS) method. The rupture model from inversion shows that the rupture extends from the initial rupture point towards the ESE direction, with a duration of about 14 seconds (mainly focus on 2−8 seconds), a maximum slip of 3.6 m, and a rupture length of about 20 km. The rupture extends longitudinally from the deep to the shallow, which is consistent with the surface rupture found in the field investigation. The spatial distribution of aftershock sequences shows significant segmentation characteristics, indicating complex tectonic transitions in the rupture zone.
-
Keywords:
- 2022 Menyuan earthquake /
- source rupture process /
- strong motion data /
- IDS method
-
引言
据中国地震台网中心(2022)测定,2022年1月8日1时45分27秒在青海省海北州门源县发生MS6.9地震,其震中位于(101.26°E,37.77°N),震源深度为10 km。此次地震发生在青藏高原东北缘,处于欧亚板块与印度板块碰撞的远程效应区域。该区域的地质构造复杂,地表高程变化剧烈,区域地壳厚度由高原内部的65 km下降到边缘的55 km (Pan,Niu,2011;Deng et al,2015;Wang et al,2016)。区域断裂带多呈现NE−SE向的走滑断层和逆冲断层,以适应印度板块向高原的俯冲作用。
这次门源地震发生在祁连—海原断裂带上,该断裂是一个可以孕育M8强震的断裂带,在二十世纪发生过两次M8地震,分别是1920年海原大地震(郭增建,吴瑾冰,2000)和1927年古浪大地震(邹谨敞等,1994)。GPS观测显示海原断裂带的左旋速率为4—5 mm/a (Zheng et al,2017)。自二十世纪七十年代有地震仪器记录以来,本次门源MS6.9地震附近50 km范围内共发生M≥5.0地震9次,其中M≥6.0地震3次,分别是1986年门源MS6.4地震、2016年门源MS6.4地震和此次地震。中国地震局(2022)组织的这次地震现场调查显示,Ⅷ度烈度区域为1143 km2,地震造成的地表破裂长约22 km,地表破裂性质以左旋走滑为主。
快速、可靠地获得强震的破裂过程对于震后灾害评估和救灾工作具有重要的指导意义,同时也是震源物理过程研究的重要内容。由于长周期远震波形数据反演破裂过程的时空分辨能力有限,只能给出MW7.0以上地震的大致破裂模式,缺乏对破裂细节的约束,而高频近场强震观测波形数据可以更好地约束破裂过程的细节,因而能提供更多的地震破裂细节。为此,本文拟利用新布设的和改建的强震台网记录到的波形数据,基于迭代反褶积和叠加法(iterative deconvolution and stacking,缩写为IDS)(Zhang et al,2014)反演这次门源MS6.9地震的破裂过程,并通过与其它机构的结果对比来展示本文破裂过程在反演的时效性和破裂过程细节方面的优势。
1. 方法与数据处理
本文采用IDS方法(Zhang et al,2014)基于强震数据进行破裂过程反演。IDS方法融合了经典的波形反演和反投影方法,基于近场观测数据,可以实现快速、稳定以及高度流程自动化的地震破裂过程反演。特别是利用近年来发展起来的强震观测台网和高频GPS观测台网的实时波形数据,地震破裂过程反演的时效性显著增强。该方法目前已经比较成熟,且在2014年南纳帕(South Napa)MW6.1地震(Zhang et al,2015)和2019年九寨沟MS7.0地震(郑绪君等,2017)的应用中都取得了较好的结果。
随着国家地震烈度速报与预警工程的实施,青海地区相继建成并完善了实时传输的强震台网,为本研究提供了数据基础。强震观测的主要目的是获取强震的近场观测记录,通常布设在活动断裂和人口稠密区域。这次门源地震震中150 km范围内有强震台34个,台站分布情况如图1所示。可见强震台主要分布在地震的南部,东北部稀缺。这样的台站分布可选用IDS方法来反演破裂过程。这是因为以往的震例显示IDS方法适用于地震台网方位角覆盖不完全的区域,例如2008—2017年期间日本东部海域MW6.5以上地震的强震台站方位角覆盖不足180°,利用该方法也得到了稳定的破裂过程(Zheng et al,2020)。强震台网配备的地震仪器包括三分量TDA-33M型、JS-A2型和QA-2g型地震计,采样率为100 Hz,其对地面加速度的平坦响应频带范围分别是DC−200 Hz,DC−100 Hz和DC−170 Hz。
![]() 图 1 2022门源MS6.9地震周边强震台站分布紫色三角形表示最终参与反演的强震台站Figure 1. Distribution of strong motion stations near 2022 Menyuan MS6.9 earthquakePurple triangles are the strong motion stations used for inversion
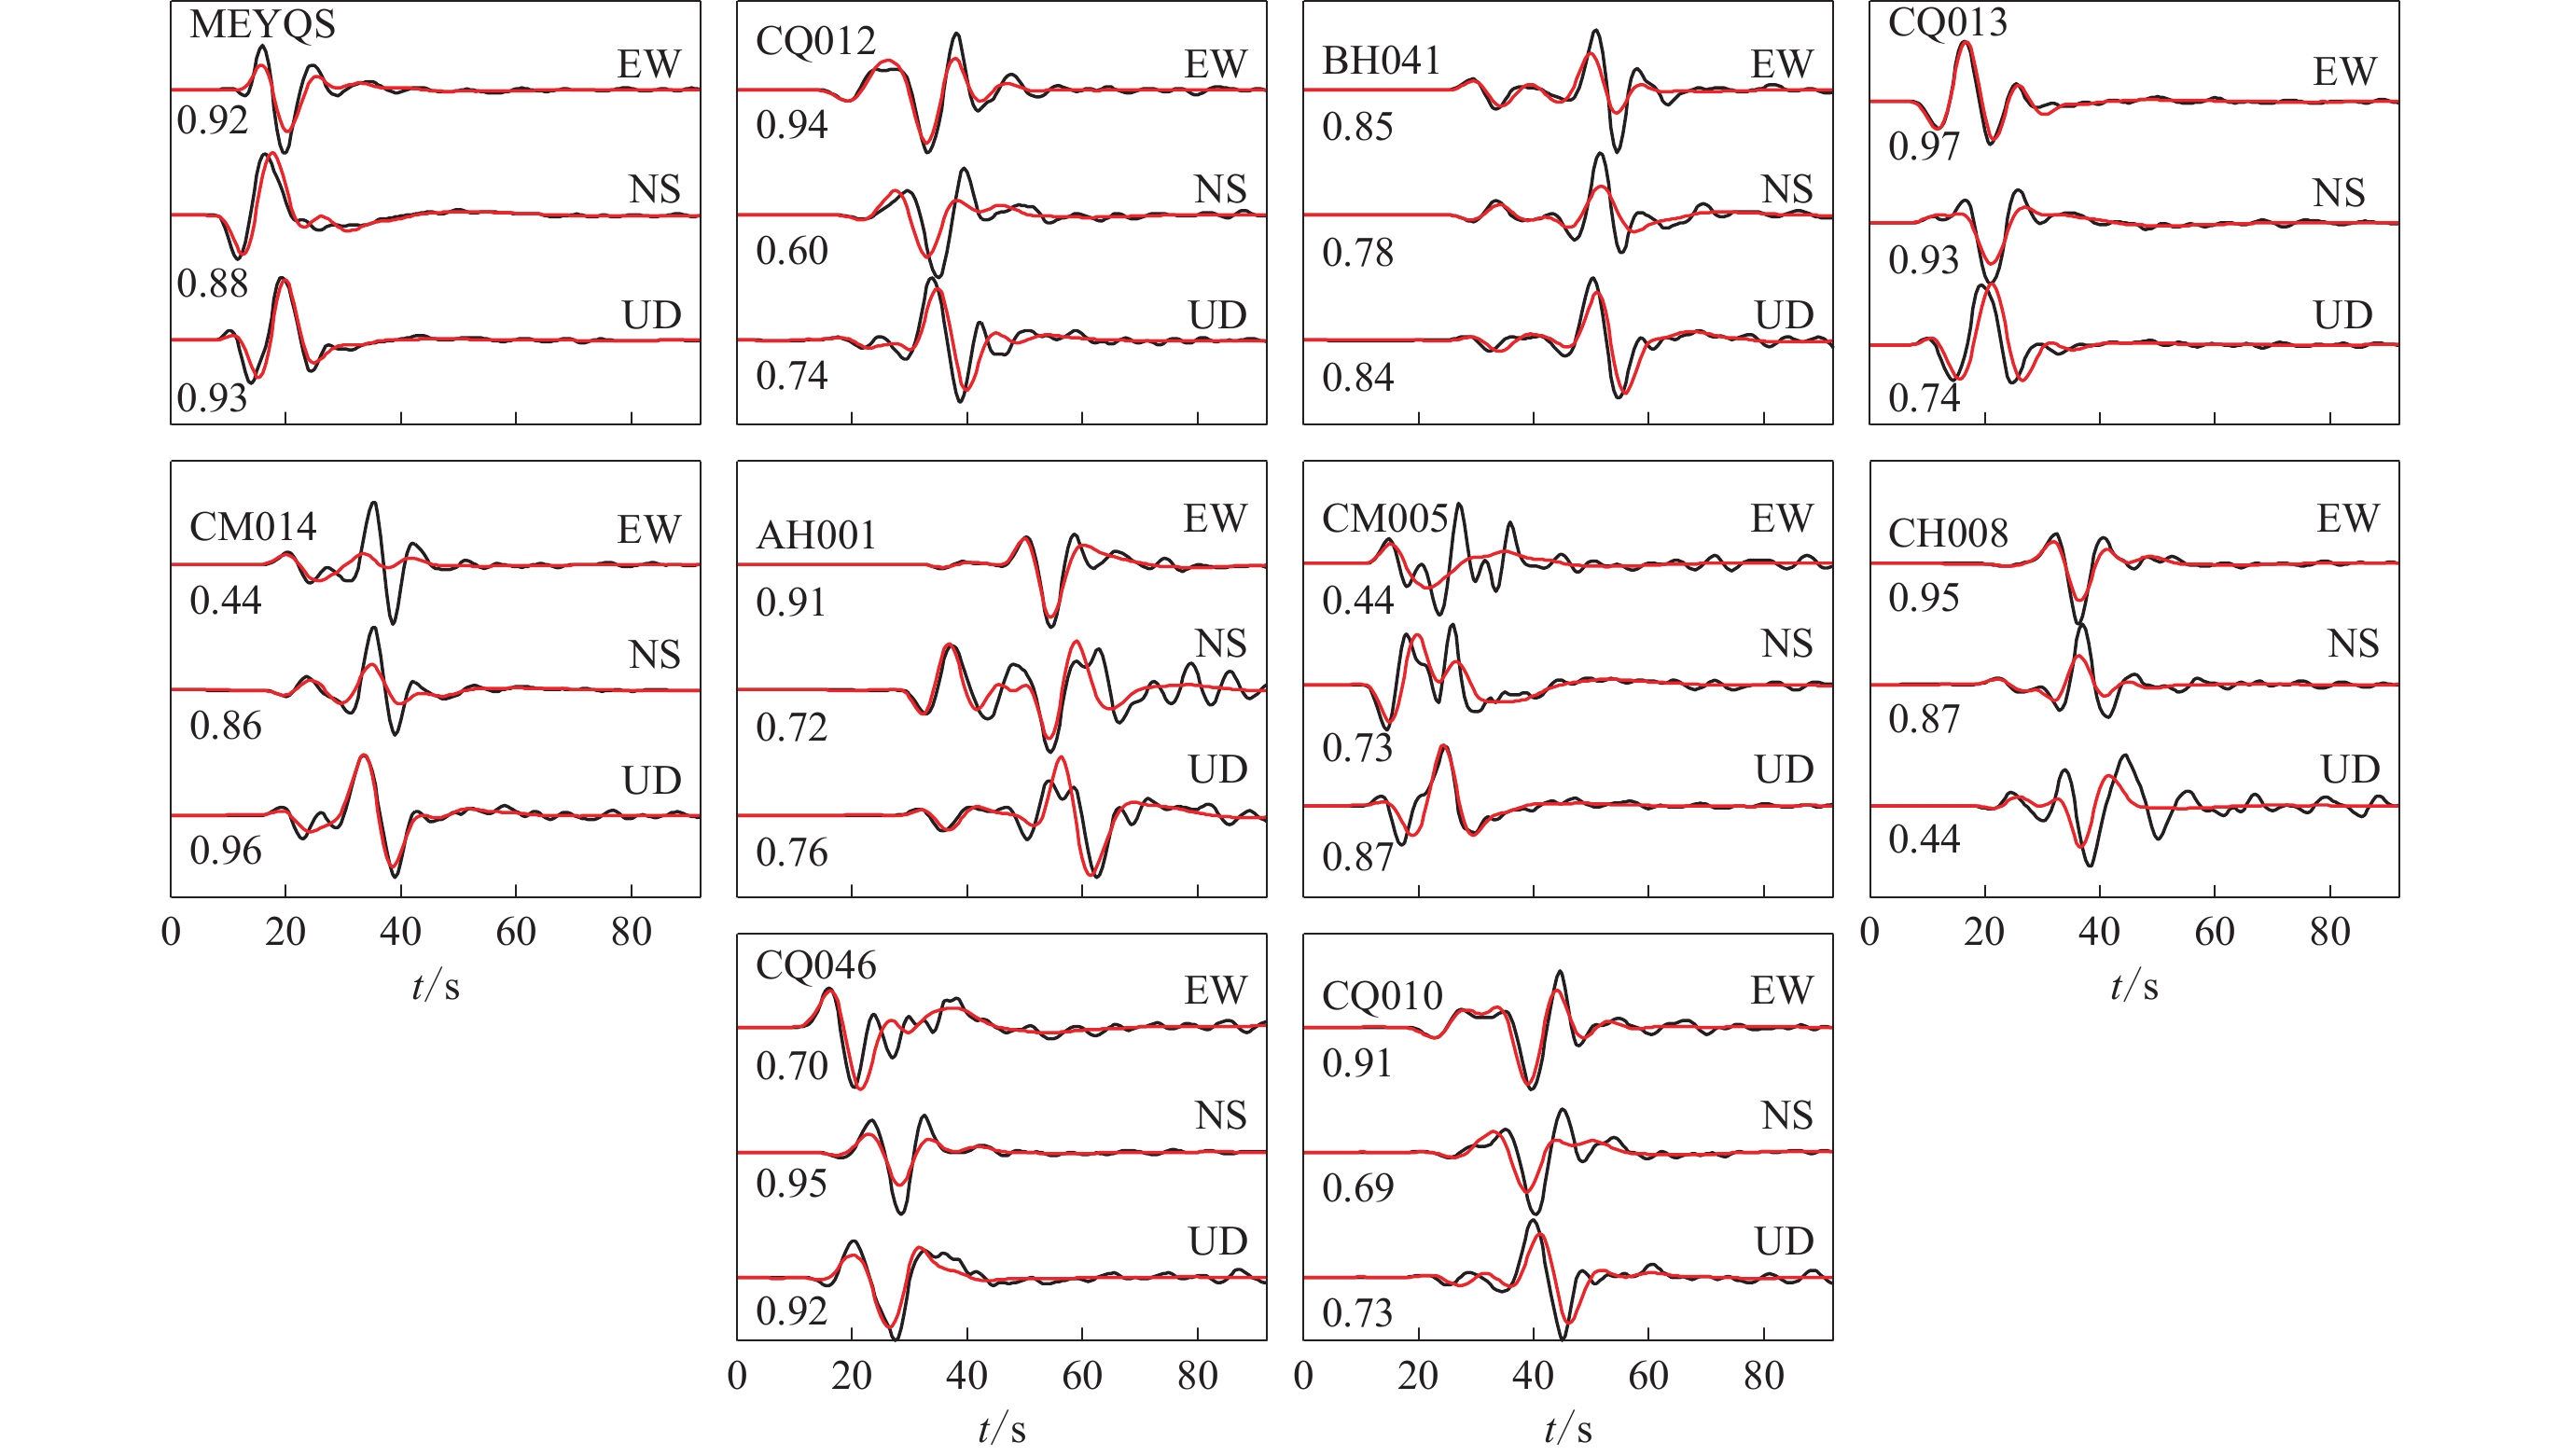
图 1 2022门源MS6.9地震周边强震台站分布紫色三角形表示最终参与反演的强震台站Figure 1. Distribution of strong motion stations near 2022 Menyuan MS6.9 earthquakePurple triangles are the strong motion stations used for inversion门源MS6.9地震的波形可通过中国地震台网中心布设的实时地震波形数据服务器获取,震源位置和发震时刻采用地震速报结果。由于使用大量近台数据,地震速报结果是可靠的。断层面参数选用中国地震台网中心的震源机制解(杨志高等,2022),该结果基于国内甚宽频带地震台和全球台网(global seismic network,缩写为 GSN)台站,震后20 min由 W 震相反演方法(Kanamori,Rivera,2008)获得。反演震源机制解的节面Ⅰ为走向102°、倾角69°、滑动角−2°,节面Ⅱ为走向193°、倾角89°、滑动角−159°,矩震级为MW6.6,其中节面Ⅰ的走向与祁连—海原断裂带以及余震序列的长轴方位较为接近,因此选用节面Ⅰ参数作为震源破裂过程的断层面参数。破裂面尺度基于震级与破裂长宽之间的经验关系(Wells,Coppersmith,1994)计算得到,长度和宽度分别为34 km和14 km。子断层网格大小设为2 km×2 km,以此划分出沿走向和沿倾向的17×7个网格。格林函数使用Qseis (Wang,1999)程序,基于震源所处位置的crust1.0模型(Laske et al,2012)进行计算。地震数据筛选主要根据震中距、波形信噪比以及波形拟合度进行。具体的筛选步骤为:选取距震中150 km以内的台站;剔除存在明显漂移现象的波形数据,以避免积分后波形出现较大畸变;多次迭代过程中剔除拟合度较低(<0.4)的台站。进行10次迭代运算后筛选出10个波形拟合度较高的台站(图1中紫色三角形所示),其观测波形与理论波形在振幅和形状上有较好的一致性(图2)。
![]() 图 2 2022年门源MS6.9地震的理论波形与观测波形对比台站名称标示在波形图的左上;黑线表示各个强震台的三分量观测波形,自上而下分别是EW,NS和UD分量的波形,红线表示基于破裂过程的理论地震图,观测地震图与理论地震图的拟合度标示在各分量波形左下Figure 2. Comparison of theoretical and observed waveforms of the 2022 Menyuan MS6.9 earthquakeStation codes are marked on the upper left of waveforms. The black lines represent the three-component observation waveform observed by strong motion station. Each panel represents the east-west,north-south,and vertical components from top to bottom,respectively。The red lines represent the theoretical seismograms based on the inverted rupture process,and the cross correlation between the observed and the theoretical waveform is marked on the lower left of each waveform
图 2 2022年门源MS6.9地震的理论波形与观测波形对比台站名称标示在波形图的左上;黑线表示各个强震台的三分量观测波形,自上而下分别是EW,NS和UD分量的波形,红线表示基于破裂过程的理论地震图,观测地震图与理论地震图的拟合度标示在各分量波形左下Figure 2. Comparison of theoretical and observed waveforms of the 2022 Menyuan MS6.9 earthquakeStation codes are marked on the upper left of waveforms. The black lines represent the three-component observation waveform observed by strong motion station. Each panel represents the east-west,north-south,and vertical components from top to bottom,respectively。The red lines represent the theoretical seismograms based on the inverted rupture process,and the cross correlation between the observed and the theoretical waveform is marked on the lower left of each waveform2. 结果
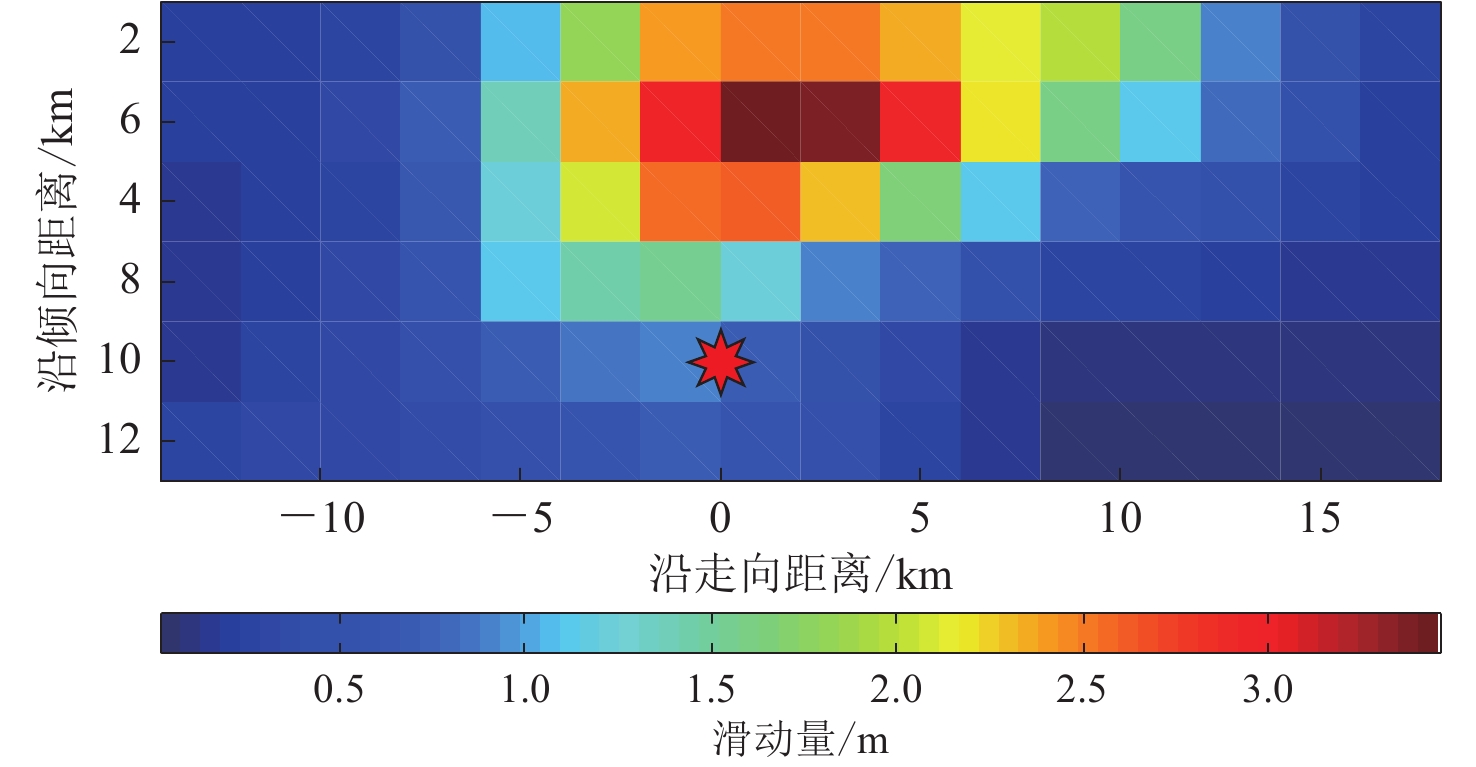
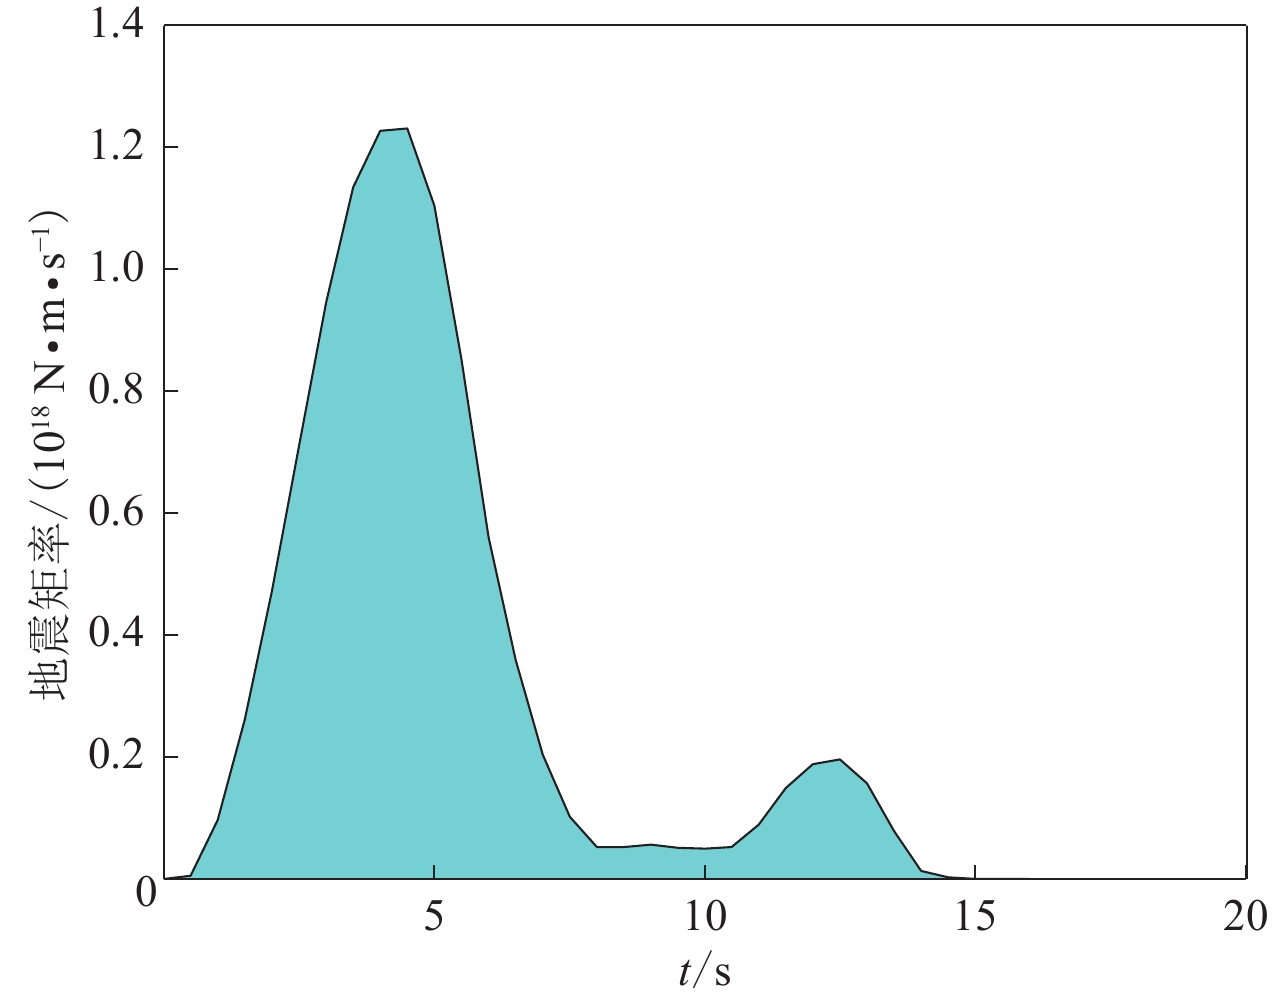
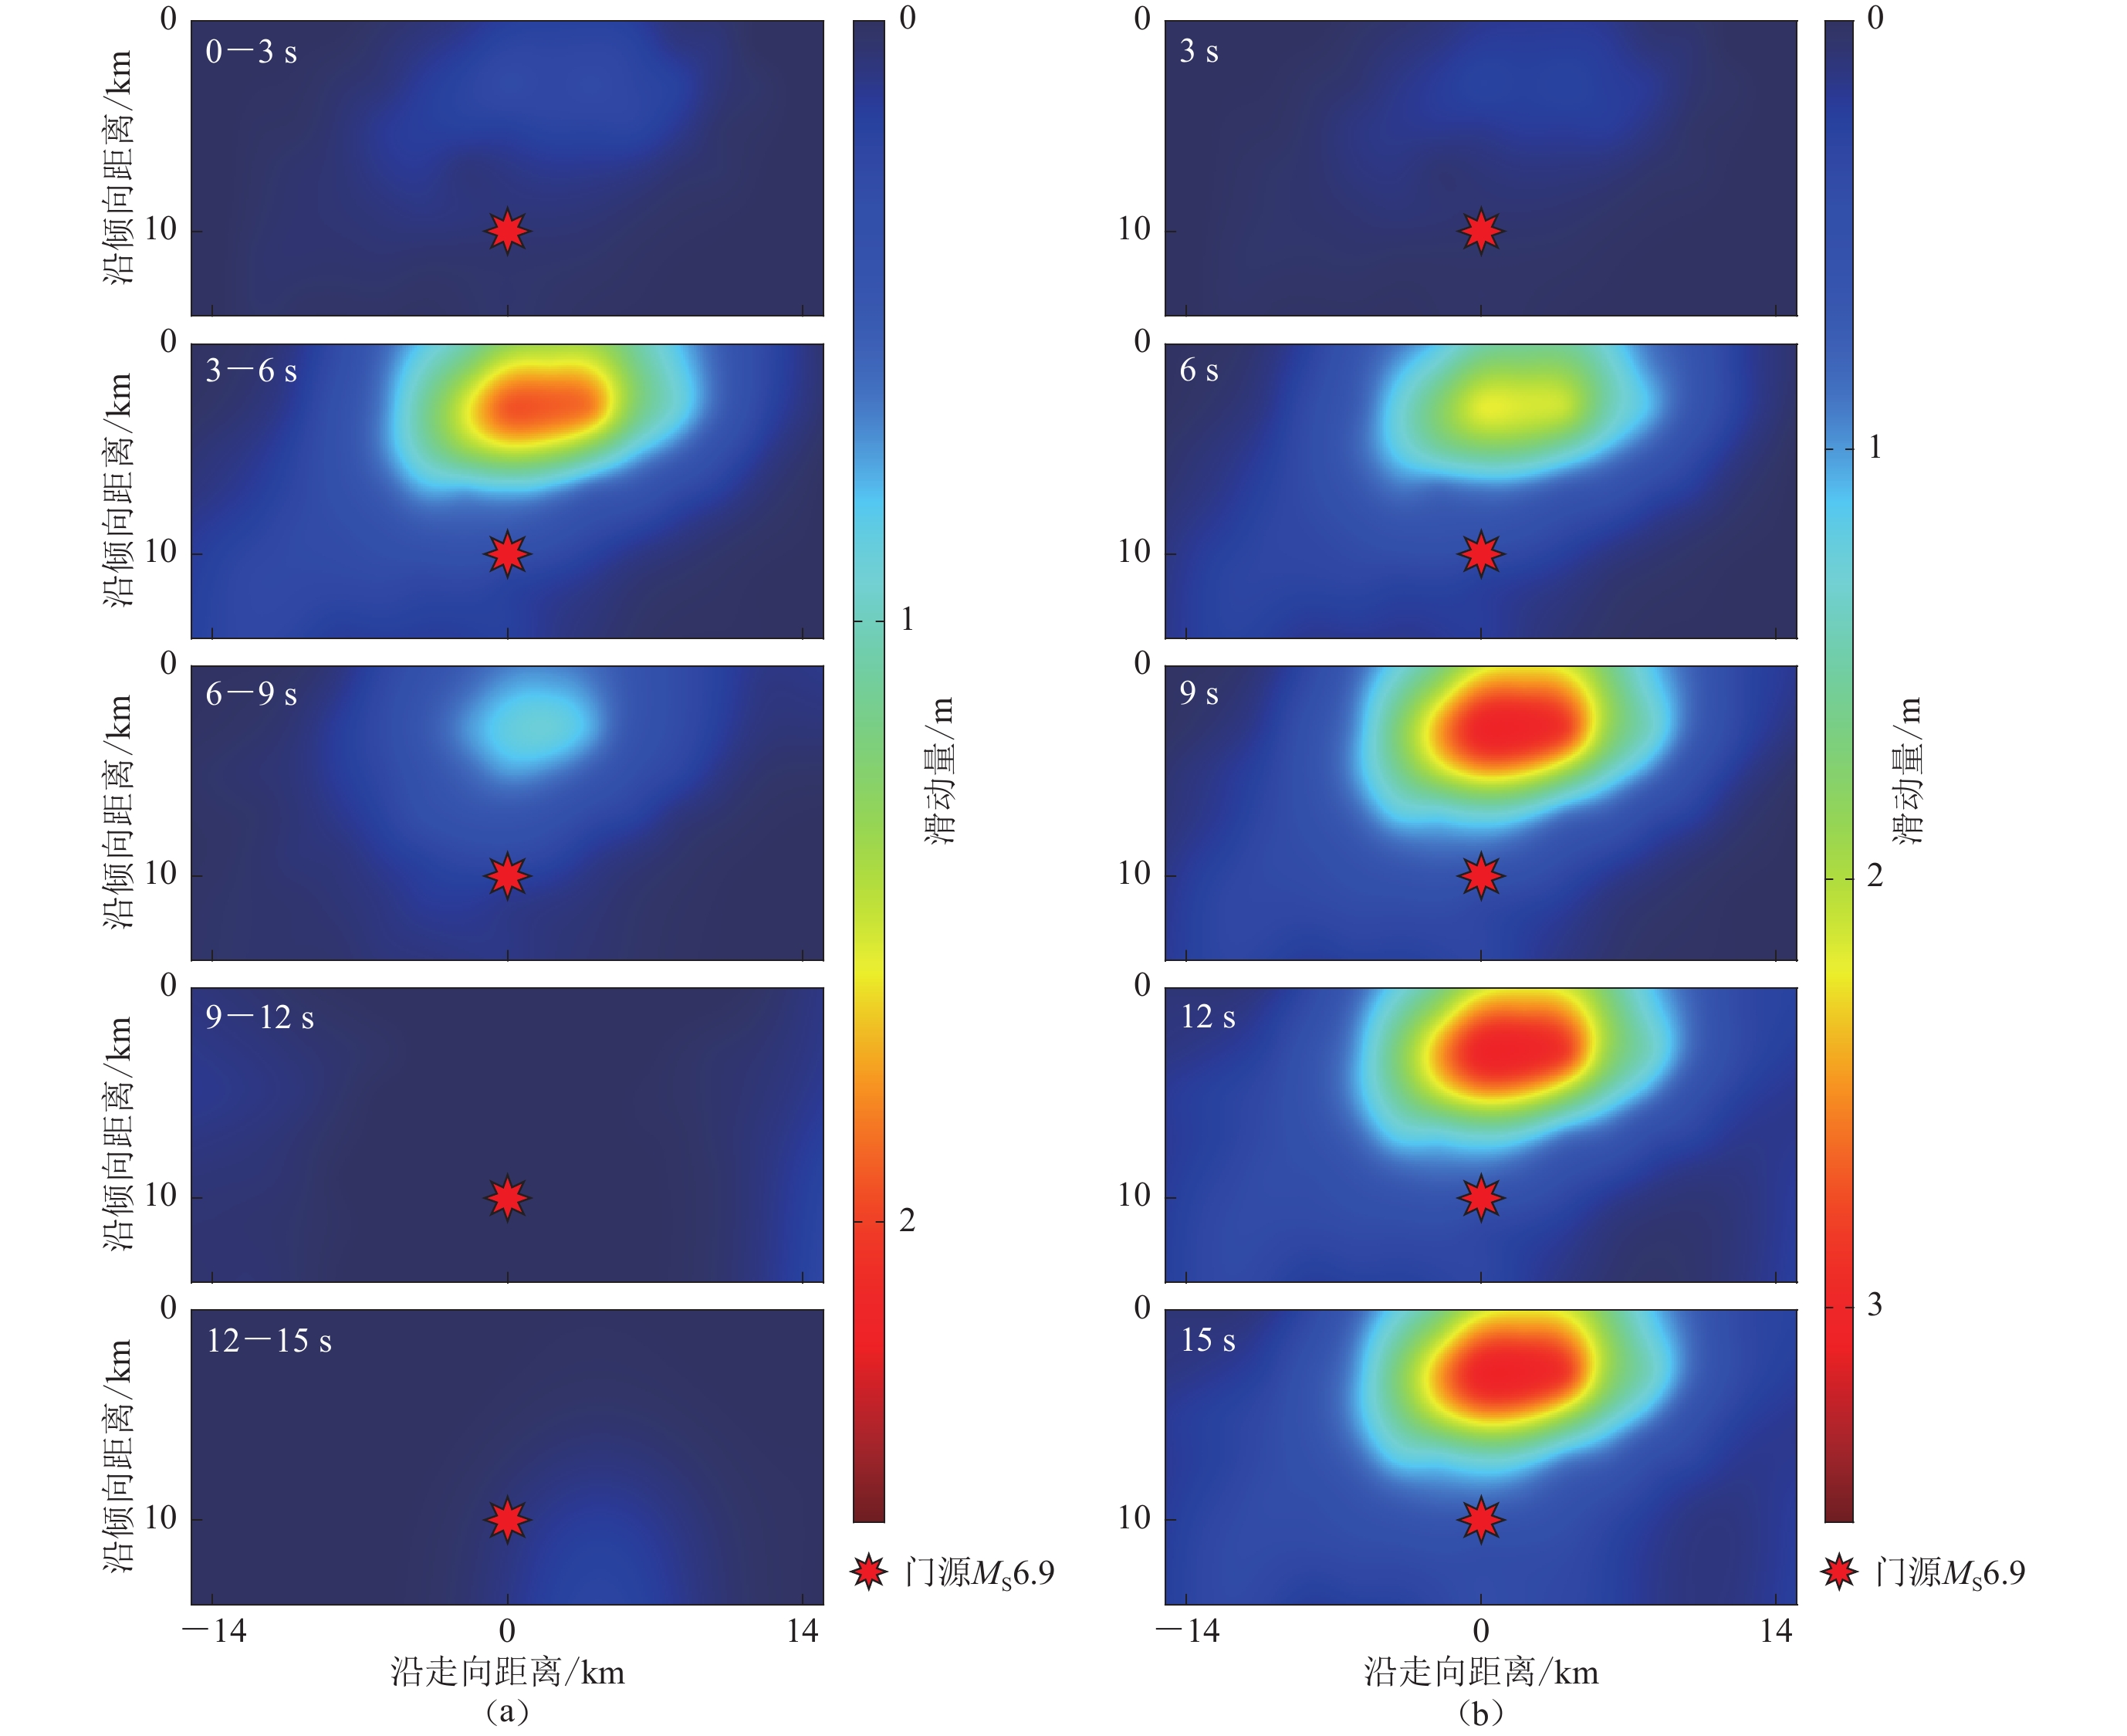
图3给出断层面静态滑动量分布,可见:整体上地震的破裂以单侧为主,破裂主要自初始破裂点向ESE方位扩展,破裂中心位于震中偏ESE向约2—4 km;破裂中心的最大滑动量为3.6 m,深度约4 km;破裂整体长约20 km,向WNW向扩展约6 km,向SE向扩展约14 km。破裂过程纵向上展示出由深部向浅部扩展的特征,且浅部可见明显的滑动量。该静态滑动分布与基于大地测量方法的结果(Li et al,2022;Yang et al,2022)一致。根据震后现场考察结果(中国地震局,2022),地表可见22 km长的破裂带,烈度为Ⅸ度的区域面积约157 km2,烈度为Ⅷ度的区域为1143 km2。根据震级与Ⅷ度区域面积的经验关系(陈培善,刘家森,1975),当矩震级为MW6.6时,Ⅷ度区域的面积为360 km2。这次地震引起的实际烈度Ⅷ度区域面积远大于经验值,可能是由于破裂由深部向浅部扩散并导致地表破裂带引起。震源时间函数主要包括一次持续8 s的主破裂和一次持续4 s的次级破裂。地震破裂过程持续时间约为14 s (图4),略大于MW6.6地震的通常破裂持续时间11 s (Duputel et al,2012)。结合时空破裂过程结果(图5)可以看出:破裂速率在3—6 s达到峰值,主要集中在震中附近且接近地表;9 s之后滑动累积量趋于稳定,整个破裂中8 s前的主破裂事件占主导。
![]() 图 3 2022年门源MS6.9地震断层面静态滑动分布(星形表示主震位置)Figure 3. Static slip distribution on the fault plane of the MS6.9 Menyuan earthquake in 2022 (The red star indicates the epicenter of the main shock)
图 3 2022年门源MS6.9地震断层面静态滑动分布(星形表示主震位置)Figure 3. Static slip distribution on the fault plane of the MS6.9 Menyuan earthquake in 2022 (The red star indicates the epicenter of the main shock)![]() 图 4 2022年门源MS6.9地震震源时间函数Figure 4. Source time function of the MS6.9 Menyuan earthquake in 2022
图 4 2022年门源MS6.9地震震源时间函数Figure 4. Source time function of the MS6.9 Menyuan earthquake in 2022![]() 图 5 2022年门源MS6.9地震时空破裂过程(a) 滑动速率分布;(b) 累积滑动量分布Figure 5. The spatio-temporal rupture process of the 2022 Menyuan MS6.9 earthquakee(a) Distribution of slip rate;(b) Distribution of cumulative slip
图 5 2022年门源MS6.9地震时空破裂过程(a) 滑动速率分布;(b) 累积滑动量分布Figure 5. The spatio-temporal rupture process of the 2022 Menyuan MS6.9 earthquakee(a) Distribution of slip rate;(b) Distribution of cumulative slip相比过去触发式的强震台站存在较多到时不准、波形异常和仪器灵敏度更新不及时等问题,实时传输的波形数据弥补了触发台站的不足,可以快速检测到这些异常并实时进行更新和修正。通过强震波形反演破裂过程得到的矩震级为MW6.6,这与利用长周期远震数据的W震相反演方法得到的结果一致,说明强震台仪器的灵敏度等参数配置妥当。
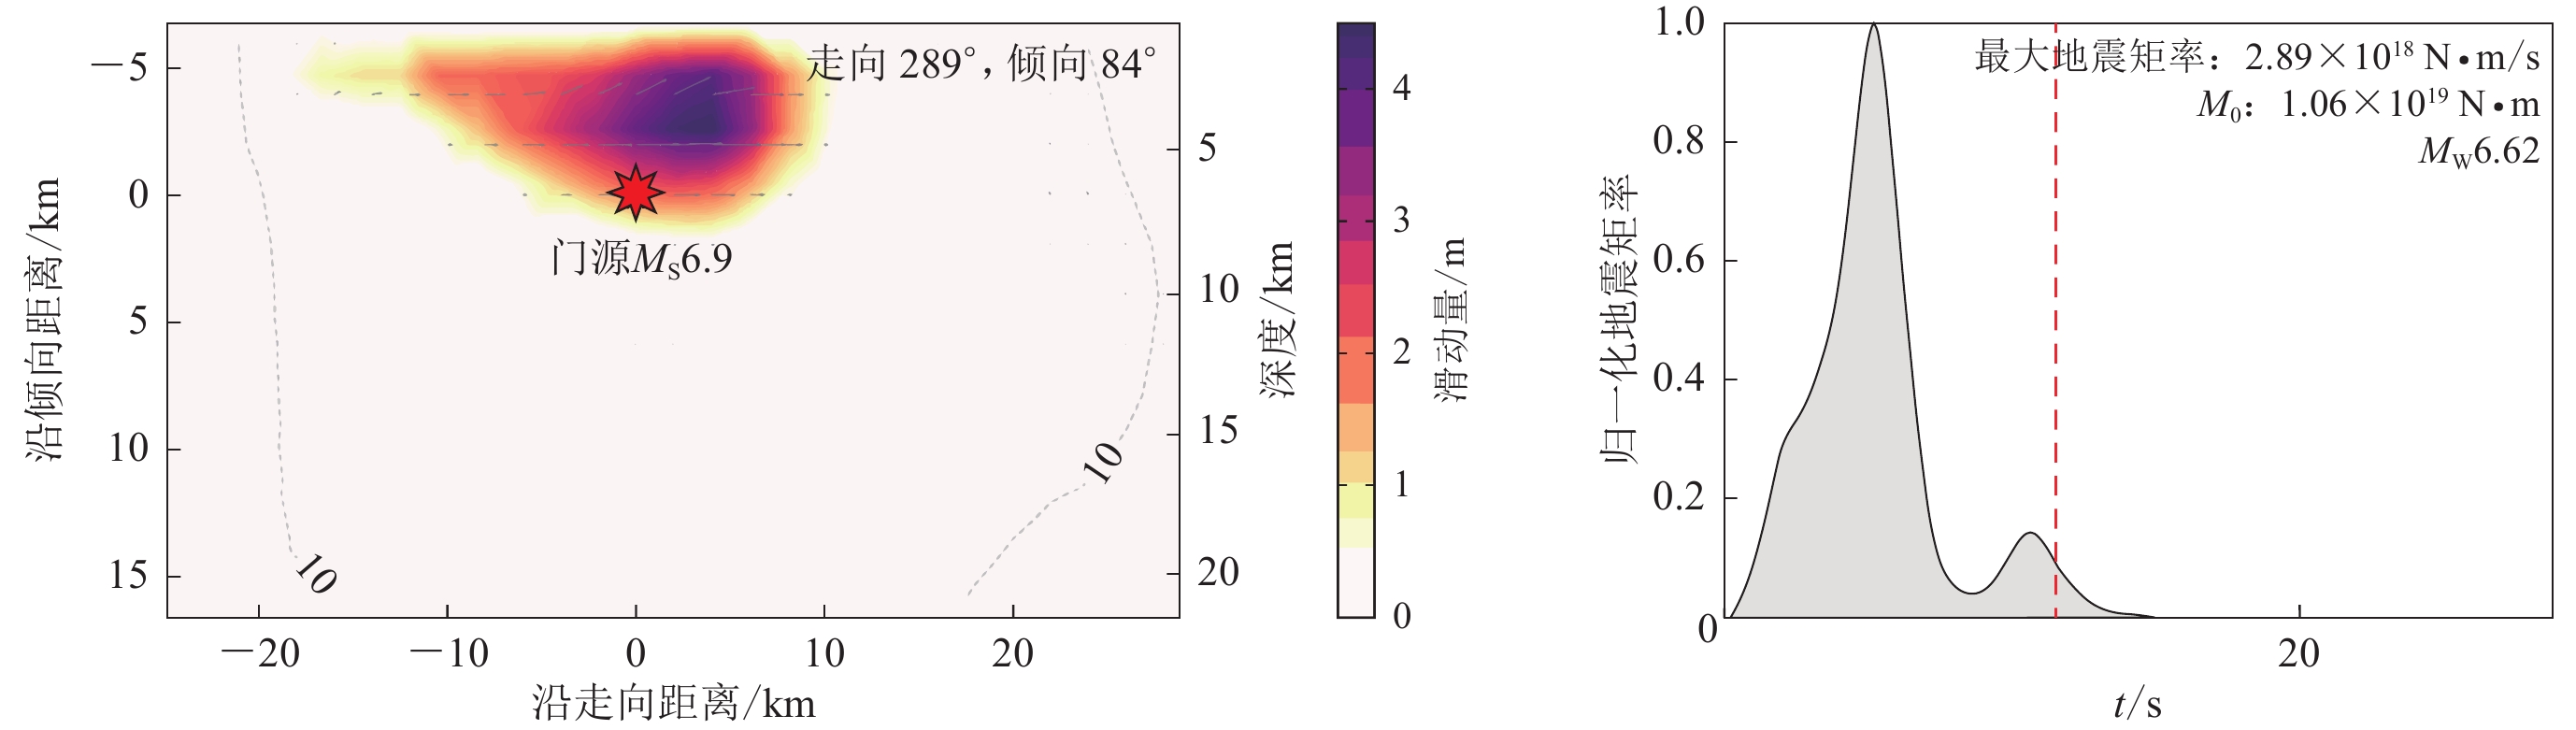
USGS (2022)基于长周期远震波形拟合反演的门源地震破裂过程如图6所示,其断层面模型的走向和倾向分别为289°和84°。对于高倾角走滑型地震而言,两个断层面比较接近,前者向南倾斜,后者向北倾斜。Zhang等(2015)对IDS方法的测试表明断层面参数在±15°范围内的变化不会显著影响主要破裂过程,我们使用USGS的断层面参数(289°和84°)计算后得到的破裂过程与本文参数(102°和69°)的结果几乎无差别,二者最大的不同之处在于破裂中心的位置。USGS结果显示破裂中心位于初始破裂偏西部,而本文结果显示中心位置在初始破裂以东。再者,远震波形拟合与强震波形拟合的破裂过程在空间分辨率上存在差别。远震波形拟合破裂过程的算法通常允许观测波形时间窗前后偏移以搜索最佳波形拟合度,但对破裂绝对位置的分辨能力弱;强震资料反演过程不允许波形窗偏移,有一定的破裂绝对位置定位能力(Zhang et al,2014)。
![]()
时效性是强震数据反演破裂过程的优势之一。强震台网相较于GSN能够更早地接收到波形数据。此次反演使用距震中150 km范围内的台站,波形窗长度为50 s,震后2 min即可获得所需时间窗完整的波形数据。在准备好格林函数的情况下,以历史强震震源机制解作为断层面参数则可在震后3—5 min产出初步强震破裂过程。考虑到强震的震源机制通常与历史地震的震源机制有较好的一致性,因此初步破裂过程也具备一定的参考价值。对于MW6.0左右的地震,通常在震后5—10 min内可以自动产出基于近震波形反演的震源机制解,半小时内可以产出基于远震波形(例如W震相方法)反演的震源机制解。以当前地震震源机制解为断层面参数输入时,可以在震后半小时持续更新破裂过程。
主震破裂的高滑动区域与低余震活动区域之间存在相关性(Beroza,1991;Das,Henry,2003;Chousianitis,Konca,2021),前者通常对应于较少的余震活动(Das,Henry,2003)。本次地震破裂过程的高滑动区域对应于较弱的余震活动(图7),这与Das和Henry (2003)报告的震例一致。解释这种现象的一个简单模型是,高滑动区域也是高强度区域,仅在主震期间滑动(Beroza,1991)并将应力完全释放(Chousianitis,Konca,2021)。
![]() 图 7 2022年门源MS6.9地震序列(主震以白色星形表示,余震以黑色圆点表示)与2016年门源MS6.4地震序列(主震以紫色星形表示,余震以紫色圆点表示)空间分布对比Figure 7. Spatial distribution comparison between the 2022 MS6.9 Menyuan earthquake sequence (the white star stands for mainshock and the black dots indicate aftershocks) and the 2016 MS6.4 Menyuan earthquake sequence (the purple star stands for mainshock and the purple dots indicate aftershocks)
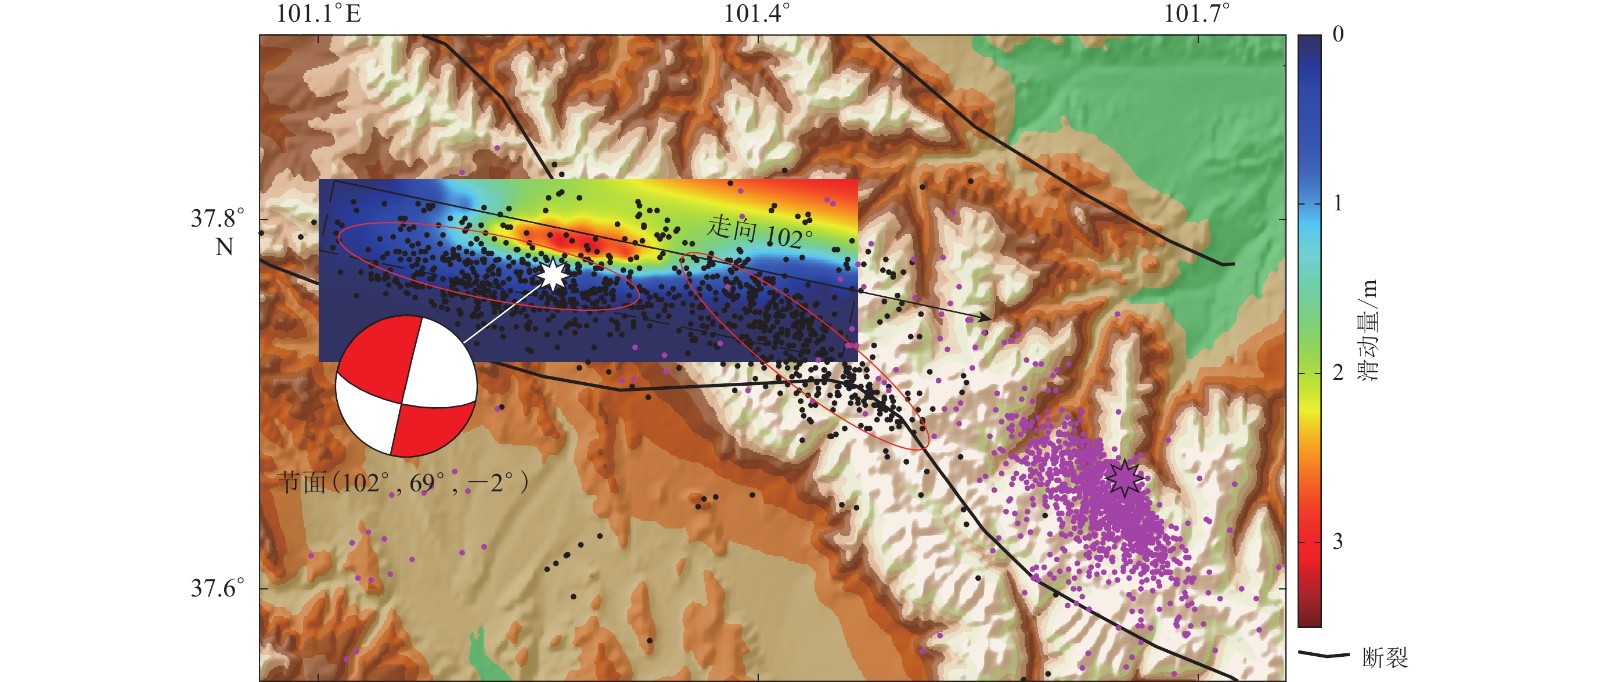
图 7 2022年门源MS6.9地震序列(主震以白色星形表示,余震以黑色圆点表示)与2016年门源MS6.4地震序列(主震以紫色星形表示,余震以紫色圆点表示)空间分布对比Figure 7. Spatial distribution comparison between the 2022 MS6.9 Menyuan earthquake sequence (the white star stands for mainshock and the black dots indicate aftershocks) and the 2016 MS6.4 Menyuan earthquake sequence (the purple star stands for mainshock and the purple dots indicate aftershocks)2016年门源MS6.4地震是距离本次地震最近的一次强震,两者的关系值得讨论。2022年门源地震为左旋走滑型事件,2016年地震为逆冲型事件,说明这两次地震的发震断层性质不同,而且发震断层并不完全相同:2016年地震是由冷龙岭断层北侧的断层引起(胡朝忠等,2016)。根据震级与破裂长度的经验关系,2016年门源MS6.4地震的破裂长度为10 km左右。两次地震的位置相差近40 km,可以大体判断两次地震的破裂过程没有连通。截至北京时间2022年1月18日10时,已发生余震近千次且其空间分布展示出分段特征(图7)。震中附近余震空间分布的长轴方向与震源机制解节面吻合,而震中东南部余震的长轴方向与震源机制解节面走向存在一定角度。据现场考察此次地表破裂由两条破裂带组成,分别为NW向冷龙岭断裂西段和EW向托勒山断裂东段(Li et al,2022;Liu et al,2019),这两个断裂带位置与两次地震的余震分布带吻合。余震空间分布的分段性和历史震源机制解差异预示该区域存在强烈的构造转换,且本次地震破裂止于该处。赵凌强等(2022)指出冷龙岭断裂在南北两侧呈现重要物性差异带的特点,也从侧面指示了这一区域构造的转换性。由于这种构造差异性以及挤压应力的持续作用,该地区未来仍有发生强震的可能性。
3. 结论
基于实时强震连续波形数据和W震相反演的震源机制解,本文利用迭代反褶积和叠加法反演了2022年1月8日门源MS6.9地震的破裂过程。破裂过程整体上表现为单侧为主的特征,主要破裂方向是ESE,破裂中心位于震中ESE向2—4 km处。破裂在纵向上自下而上达到地表,这与观测到的约22 km的地表破裂吻合。破裂持续时间约14 s,包含一次持续8 s的主破裂和一次持续4 s的次级破裂。破裂速率在3—6 s达到峰值,破裂集中在2—8 s。破裂过程展示的高滑动区域对应较少的余震活动。相较USGS (2022)基于远震波形拟合方法反演所得的破裂过程,本文结果在空间分辨率和时效性上更有优势。本次MS6.9地震与2016年门源MS6.4地震在空间上相距40 km,推测两次地震的破裂过程没有连通,且二者的发震断层不同。此次地震的余震空间分布的分段性和历史震源机制解差异预示发震区域存在强烈的构造转换,该地区未来仍然有发生强震的可能性。
-
![]()
图 1 2022门源MS6.9地震周边强震台站分布
紫色三角形表示最终参与反演的强震台站
Figure 1. Distribution of strong motion stations near 2022 Menyuan MS6.9 earthquake
Purple triangles are the strong motion stations used for inversion
![]()
图 2 2022年门源MS6.9地震的理论波形与观测波形对比
台站名称标示在波形图的左上;黑线表示各个强震台的三分量观测波形,自上而下分别是EW,NS和UD分量的波形,红线表示基于破裂过程的理论地震图,观测地震图与理论地震图的拟合度标示在各分量波形左下
Figure 2. Comparison of theoretical and observed waveforms of the 2022 Menyuan MS6.9 earthquake
Station codes are marked on the upper left of waveforms. The black lines represent the three-component observation waveform observed by strong motion station. Each panel represents the east-west,north-south,and vertical components from top to bottom,respectively。The red lines represent the theoretical seismograms based on the inverted rupture process,and the cross correlation between the observed and the theoretical waveform is marked on the lower left of each waveform
![]()
图 3 2022年门源MS6.9地震断层面静态滑动分布(星形表示主震位置)
Figure 3. Static slip distribution on the fault plane of the MS6.9 Menyuan earthquake in 2022 (The red star indicates the epicenter of the main shock)
![]()
图 4 2022年门源MS6.9地震震源时间函数
Figure 4. Source time function of the MS6.9 Menyuan earthquake in 2022
![]()
图 5 2022年门源MS6.9地震时空破裂过程
(a) 滑动速率分布;(b) 累积滑动量分布
Figure 5. The spatio-temporal rupture process of the 2022 Menyuan MS6.9 earthquakee
(a) Distribution of slip rate;(b) Distribution of cumulative slip
![]()
![]()
图 7 2022年门源MS6.9地震序列(主震以白色星形表示,余震以黑色圆点表示)与2016年门源MS6.4地震序列(主震以紫色星形表示,余震以紫色圆点表示)空间分布对比
Figure 7. Spatial distribution comparison between the 2022 MS6.9 Menyuan earthquake sequence (the white star stands for mainshock and the black dots indicate aftershocks) and the 2016 MS6.4 Menyuan earthquake sequence (the purple star stands for mainshock and the purple dots indicate aftershocks)
-
陈培善,刘家森. 1975. 用位错模型研究震级与烈度的关系[J]. 地球物理学报,18(3):183–195. Chen P S,Liu J S. 1975. A study of the relation between seismic magnitude and intensity by using the dislocation model[J]. Acta Geophysica Sinica,18(3):183–195 (in Chinese).
郭增建, 吴瑾冰. 2000. 海原大震的历史意义及大震减灾对策的讨论: 纪念海原地震80周年[J]. 国际地震动态(12): 1–4. Guo Z J,Wu J B. 2000. Historical significance of the great Haiyuan earthquake and discussion on measures for disaster reduction of great earthquakes:The eightieth anniversary of Haiyuan earthquake[J]. Recent Developments in World Seismology,(12):1–4 (in Chinese).
胡朝忠,杨攀新,李智敏,黄帅堂,赵妍,陈丹,熊仁伟,陈庆宇. 2016. 2016年1月21日青海门源6.4级地震的发震机制探讨[J]. 地球物理学报,59(5):1637–1646. doi: 10.6038/cjg20160509 Hu C Z,Yang P X,Li Z M,Huang S T,Zhao Y,Chen D,Xiong R W,Chen Q Y. 2016. Seismogenic mechanism of the 21 January 2016 Menyuan,Qinghai MS6.4 earthquake[J]. Chinese Journal of Geophysics,59(5):1637–1646 (in Chinese).
杨志高, 徐泰然, 梁建宏, 邓文泽, 张建勇, 徐佳静. 2022. 中国地震台网中心大震震源机制CMT产品[EB/OL]. [2022-01-15]. https://data.earthquake.cn/datashare/report.shtml?PAGEID=earthquake_dzzyjz. doi: 10.12080/nedc.11.ds.2022.0005 Yang Z G, Xu T R, Liang J H, Deng W Z, Zhang J Y, Xu J J. 2022. China Earthquake Networks Center focal mechanism solution product of strong earthquakes[EB/OL]. [2022-01-15]. https://data.earthquake.cn/datashare/report.shtml?PAGEID=earthquake_dzzyjz. doi: 10.12080/nedc.11.ds.2022.0005 (in Chinese).
郑绪君,张勇,汪荣江. 2017. 采用IDS方法反演强震数据确定2017年8月8日九寨沟地震的破裂过程[J]. 地球物理学报,60(11):4421–4430. doi: 10.6038/cjg20171128 Zheng X J,Zhang Y,Wang R J. 2017. Estimating the rupture process of the 8 August 2017 Jiuzhaigou earthquake by inverting strong-motion data with IDS method[J]. Chinese Journal of Geophysics,60(11):4421–4430 (in Chinese).
赵凌强,孙翔宇,詹艳,杨海波,王庆良,郝明,刘雪华. 2022. 2022年1月8日青海门源MS6.9地震孕震环境和冷龙岭断裂分段延展特征[J]. 地球物理学报,65(4):1536–1546. doi: 10.6038/cjg2022Q0051 Zhao L Q,Sun X Y,Zhan Y,Yang H B,Wang Q L,Hao M,Liu X H. 2022. The seismogenic model of the Menyuan MS6.9 earthquake on January 8,2022,Qinghai Province and segmented extensional characteristics of the Lenglongling fault[J]. Chinese Journal of Geophysics,65(4):1536–1546 (in Chinese).
中国地震局. 2022. 中国地震局发布青海门源6.9级地震烈度图[EB/OL]. [2022-01-12]. https://www.cea.gov.cn/cea/xwzx/fzjzyw/5646200/index.html. China Earthquake Administration. 2022. China Earthquake Administration released the intensity map of MS6.9 earthquake in Menyuan, Qinghai[EB/OL]. [2022-01-12]. https://www.cea.gov.cn/cea/xwzx/fzjzyw/5646200/index.html (in Chinese).
中国地震台网中心. 2022. 青海海北州门源县6.9级地震[EB/OL]. [2022-01-10]. https://news.ceic.ac.cn/CC20220108014528.html. China Earthquake Networks Center. 2022. MS6.9 Menyuan earthquake in Haibei Prefecture, Qinghai Province[EB/OL]. [2022-01-10]. https://news.ceic.ac.cn/CC20220108014528.html (in Chinese).
邹谨敞, 邵顺妹, 蒋荣发. 1994. 古浪地震滑坡的分布规律和构造意义[J]. 中国地震, (2): 168–174. Zou J C,Shao S M,Jiang R F. 1994. Distribution and tectonic implications on the Gulang seismic landslide[J]. Earthquake Research in China,(2):168–174 (in Chinese).
Beroza G C. 1991. Near-source modeling of the Loma Prieta earthquake:Evidence for heterogeneous slip and implications for earthquake hazard[J]. Bull Seismol Soc Am,81(5):1603–1621. doi: 10.1785/bssa0810051603
Chousianitis K,Konca A O. 2021. Rupture process of the 2020 MW7.0 Samos earthquake and its effect on surrounding active faults[J]. Geophys Res Lett,48(14):e2021GL094162. doi: 10.1029/2021GL09416
Das S,Henry C. 2003. Spatial relation between main earthquake slip and its aftershock distribution[J]. Rev Geophys,41(3):1013. doi: 10.1029/2021GL094162
Deng Y F,Shen W S,Xu T,Ritzwoller M H. 2015. Crustal layering in northeastern Tibet:A case study based on joint inversion of receiver functions and surface wave dispersion[J]. Geophys J Int,203(1):692–706. doi: 10.1093/gji/ggv321
Duputel Z,Rivera L,Kanamori H,Hayes G. 2012. W phase source inversion for moderate to large earthquakes (1990−2010)[J]. Geophys J Int,189(2):1125–1147. doi: 10.1111/j.1365-246X.2012.05419.x
Kanamori H,Rivera L. 2008. Source inversion of W phase:Speeding up seismic tsunami warning[J]. Geophys J Int,175(1):222–238. doi: 10.1111/j.1365-246X.2008.03887.x
Laske G,Masters G,Ma Z T,Pasyanos M. 2012. CRUST1.0:An updated global model of Earth’s crust[J]. Geophys Res Abs,14:3743.
Li Y S,Jiang W L,Li Y J,Shen W H,He Z T,Li B Q,Li Q,Jiao Q S,Tian Y F. 2022. Coseismic rupture model and tectonic implications of the January 7 2022,Menyuan MW6.6 earthquake:Constraints from InSAR observations and field investigation[J]. Remote Sens,14(9):2111. doi: 10.3390/rs14092111
Liu M,Li H Y,Peng Z G,Ouyang L B,Ma Y H,Ma J X,Liang Z J,Huang Y F. 2019. Spatial-temporal distribution of early aftershocks following the 2016 MS6.4 Menyuan,Qinghai,China earthquake[J]. Tectonophysics,766:469–479.
Pan S Z,Niu F L. 2011. Large contrasts in crustal structure and composition between the Ordos plateau and the NE Tibetan Plateau from receiver function analysis[J]. Earth Planet Sci Lett,303(3/4):291–298. doi: 10.1016/j.jpgl.2011.01.007
USGS. 2022. M6.6: Northern Qinghai, China[EB/OL]. [2022-01-07]. https://earthquake.usgs.gov/earthquakes/eventpage/us7000g9zq/finite-fault.
Wang Q,Niu F L,Gao Y,Chen Y T. 2016. Crustal structure and deformation beneath the NE margin of the Tibetan Plateau constrained by teleseismic receiver function data[J]. Geophys J Int,204(1):167–179. doi: 10.1093/gji/ggv420
Wang R J. 1999. A simple orthonormalization method for stable and efficient computation of Green’s functions[J]. Bull Seismol Soc Am,89(3):733–741. doi: 10.1785/bssa0890030733
Wells D L,Coppersmith K J. 1994. New empirical relationships among magnitude,rupture length,rupture width,rupture area,and surface displacement[J]. Bull Seismol Soc Am,84(4):974–1002. doi: 10.1785/BSSA0840040974
Yang H F, Wang D, Guo R M, Xie M Y, Zang Y, Wang Y, Yao Q, Cheng C, An Y R, Zhang Y Y. 2022. Rapid report of the 8 January 2022 MS6.9 Menyuan earthquake, Qinghai, China[J]. Earthquake Research Advances, 2(1), doi: 10.1016/j.eqrea.2022.100113.
Zhang Y,Wang R J,Zschau J,Chen Y T,Parolai S,Dahm T. 2014. Automatic imaging of earthquake rupture processes by iterative deconvolution and stacking of high rate GPS and strong motion seismograms[J]. J Geophys Res:Solid Earth,119(7):5633–5650. doi: 10.1002/2013JB010469
Zhang Y,Wang R J,Chen Y T. 2015. Stability of rapid finite-fault inversion for the 2014 MW6.1 South Napa earthquake[J]. Geophys Res Lett,42(23):10263–10272. doi: 10.1002/2015gl066244
Zheng G,Wang H,Wright T J,Lou Y D,Zhang R,Zhang W X,Shi C,Huang J F,Wei N. 2017. Crustal deformation in the India-Eurasia collision zone from 25 years of GPS measurements[J]. J Geophys Res:Solid Earth,122(11):9290–9312. doi: 10.1002/2017jb014465
Zheng X J,Zhang Y,Wang R J,Zhao L,Li W Y,Huang Q H. 2020. Automatic inversions of strong-motion records for finite-fault models of significant earthquakes in and around Japan[J]. J Geophys Res:Solid Earth,125(9):e2020JB019992. doi: 10.1029/2020jb019992
-
期刊类型引用(4)
1. Zhigao Yang,Huifang Chen. The rupture process of the Hualien M 7.3 sequence on April 3, 2024. Earthquake Research Advances. 2025(01): 30-37 .  必应学术
必应学术
2. 戴丹青,席楠. 2023年2月23日塔吉克斯坦M_W 6.8地震强震数据破裂过程快速反演. 地震地磁观测与研究. 2024(03): 1-8 . 百度学术
3. 戴丹青,席楠. 2023年8月6日山东平原M5.5地震破裂过程快速反演. 中国地震. 2023(03): 689-694 . 百度学术
4. 苏淑娟,杨彦明,邹春红,孙豪,张耀文,张振晗,贾震,武扬. 基于赫斯特指数的青藏高原东北缘地震磁效应特征分析. 地震. 2023(04): 119-134 . 百度学术
其他类型引用(0)
 下载:
下载:

计量
- 文章访问数: 606
- HTML全文浏览量: 224
- PDF下载量: 189
- 被引次数: 4
