

Postseismic poroelastic rebound based on groundwater level observations:Taking the 2000 Iceland earthquakes as an example
-
摘要:
以2000年两次MW 6.5冰岛地震为例,利用近场地下水位的同震响应和震后响应约束孔隙模型参数,分析了孔隙回弹效应造成的地表变形大小和时间演化过程。首先利用数值模拟方法获得地震造成的孔隙压力变化和测井水位响应的时间序列,并以测井水位的同震阶跃幅值和震后水位恢复速率分别约束孔隙模型中的Skempton系数和扩散系数;然后基于孔隙弹性模型使用最优孔隙参数模拟震后孔隙回弹效应引起的地壳变形。结果显示:孔隙压力的同震响应控制着孔隙回弹引起的地壳变形,其变形速率与流体扩散系数呈正相关关系;孔隙回弹造成的变形以垂直向为主,且随时间快速衰减。因此,利用近场地下水位的同震响应和震后响应可以约束孔隙模型参数,为获取震后孔隙回弹机制所致的地壳变形提供依据。
-
关键词:
- 震后孔隙回弹 /
- 孔隙压力 /
- 地下水位观测 /
- 孔隙参数 /
- 2000年冰岛南部地震
Abstract:Postseismic poroelastic rebound is a phenomenon that the crustal deformation continues after an earthquake due to the diffusion of pore pressure changes caused by the earthquake. Previous studies indicate that the long-term (up to 200 days following the main shock) surface deformation is well described by afterslip and viscoelastic relaxation. However, for the short-term deformation, afterslip tends to be biased by neglecting the poroelastic rebound in the upper crust. In this study, we investigate the deformation characteristics of postseismic poroelastic rebound effects taking the two Iceland earthquakes in 2000 as an example. We use numerical simulation methods to calculate the pressure changes caused by the earthquakes and the time series of groundwater level responses, and then use the coseismic step-like amplitude of water level and postseismic water level recovery rate to constrain the Skempton ratio and hydraulic diffusivity. Finally, we simulate the crustal deformation caused by postseismic poroelastic rebound based on the optimal poroelastic parameters. Our results show that the poroelastic parameters of the shallow crustal layer have a significant impact on the deformation characteristics of postseismic poroelastic rebound. The optimal poroelastic parameters obtained in this study can be used to simulate the deformation caused by postseismic poroelastic rebound in other areas. We also find that the time evolution of postseismic poroelastic rebound is closely related to the hydraulic diffusivity and the Skempton ratio. The hydraulic diffusivity controls the rate of pressure diffusion in the crust, while the Skempton ratio reflects the degree of coupling between the solid and fluid phases in the crust. Our study has important implications for earthquake prediction and hazard assessment. By considering the effects of postseismic poroelastic rebound, we can improve our understanding of the deformation characteristics of the crust after an earthquake, and develop more accurate models for predicting postseismic deformation. This can help us to better assess the risk of earthquakes and to develop more effective strategies for earthquake mitigation and disaster response. Our study provides a valuable case study of postseismic poroelastic rebound using groundwater level observations. The findings of this study can be used to improve our understanding of the deformation characteristics of the crust after an earthquake, and to develop more accurate models for predicting postseismic deformation. However, there are still some limitations for our study. For example, we only consider the shallow crustal layer, and the effect of the deep crustal layer on postseismic poroelastic rebound is not considered. In addition, the relationship between the hydraulic diffusivity and the Skempton ratio needs to be explored in more detail in future studies.
-
引言
地震发生之后,震源周边介质会对同震应力变化呈现出不同时空尺度的变形响应。目前普遍认为造成震后变形的机制主要有三种,分别是断层的震后余滑(Freed,2007)、深部介质黏弹性松弛(Wang et al,2012)和浅部孔隙介质的孔隙回弹(Jónsson et al,2003)。震后余滑是指同震破裂所导致的断层面上和周边区域的应力增加在震后以无震滑移的方式释放。在震后几年到几十年,甚至更长的时间内,深部黏弹性介质在同震应力加载作用下发生松弛效应,并造成明显的地表变形,这是黏弹性松弛效应。此外,同震应力的加载造成了地壳浅层介质中的孔隙压力发生变化,在震后一段时间(几周到几个月)内孔隙压力逐渐恢复至震前水平并引起地表的变形,即震后孔隙回弹。断层震后余滑的持续时间为震后几个月到几年,而黏弹性松弛效应则会影响周边区域数十年甚至更长时间的地壳变形。相对而言,震后孔隙回弹的作用时间短,仅为几天到一两个月,变形影响的范围和量级也较小,一般难以通过空间大地测量观测资料加以约束 (Diao et al,2018)。
前人根据大地测量观测资料研究了强震的震后孔隙回弹效应。例如:Jónsson等(2003)使用合成孔径雷达干涉测量(interferometric synthetic aperture radar,缩写为InSAR)资料研究了2000年两次MW6.5 冰岛地震的震后变形,结果显示在地震发生后的1—2 个月内,孔隙回弹可以较好地解释断层附近的震后变形,且震后水位恢复与位移变化在时间上有良好的相关性;Hu等(2014)利用数值模拟方法研究了2011年日本东北大地震的震后孔隙回弹效应,其结果显示这一效应在海洋地壳和大陆地壳浅层造成的垂向地表变形可达20—30 cm。此外,余滑反演如果仅使用单一的余滑模型或余滑-黏弹性松弛模型会高估滑移量,考虑孔隙弹性效应则有助于提升观测数据的拟合精度(Panuntun et al,2018;McCormack et al,2020)。上述研究表明,孔隙回弹的影响在震后较短时间尺度的变形过程中不容忽视。然而,以上研究往往假定介质在未排水和排水状态下的泊松比发生变化,并分别计算两种状态下的同震变形,将二者之间的差异作为孔隙回弹效应造成的永久变形,这样所得为稳态解,无法约束相应的动态过程。因此,为了更客观地评估不同震后机制对变形的影响,有必要对震后孔隙回弹的时间过程进行深入研究。
然而,针对强震震后孔隙回弹的研究具有较大的挑战性。一方面是因为观测资料的限制和多种震后变形机制的共同作用,很难从地表变形中有效地分离孔隙回弹的贡献;另一方面是对震源区介质的孔隙参数也缺乏有效的约束。前人研究表明地震破裂造成震源区的孔隙压力发生变化,而孔隙压力变化会引起地下水位的变化,反过来利用地下水位变化也能约束孔隙流体的恢复过程。需要说明的是,大气压扰动、周期性降水和潮汐运动等也可能会对地下水位产生扰动(Manga,Wang,2007;Zhang et al,2017),但其影响相比于地震应力加载引起的水位变化较小。在三种震后变形机制中,孔隙压力变化主要受控于震后孔隙回弹机制,受震后余滑和黏弹性松弛效应的影响较小(Tung,Masterlark,2018)。
冰岛位于亚欧板块与北美板块的交界处(图1),区域构造活动强烈,火山和地震频繁发生。冰岛南部地层主要包括全新世沉积物、玄武岩和熔岩地层以及晚更新世枕状熔岩及相关沉积物(蒋喆等,2020),其中:上地壳主要由火山喷发物质构成,以玄武岩分布最广,还有安山岩和流纹岩等;中地壳由喷发物质和杂岩、岩浆房及堆积物组成(Pedersen et al,2003;Stefansson et al,2008)。孔隙回弹效应主要发生在地下浅部几千米的深度,该处地壳岩性可视为以玄武岩为主,孔隙度较高。
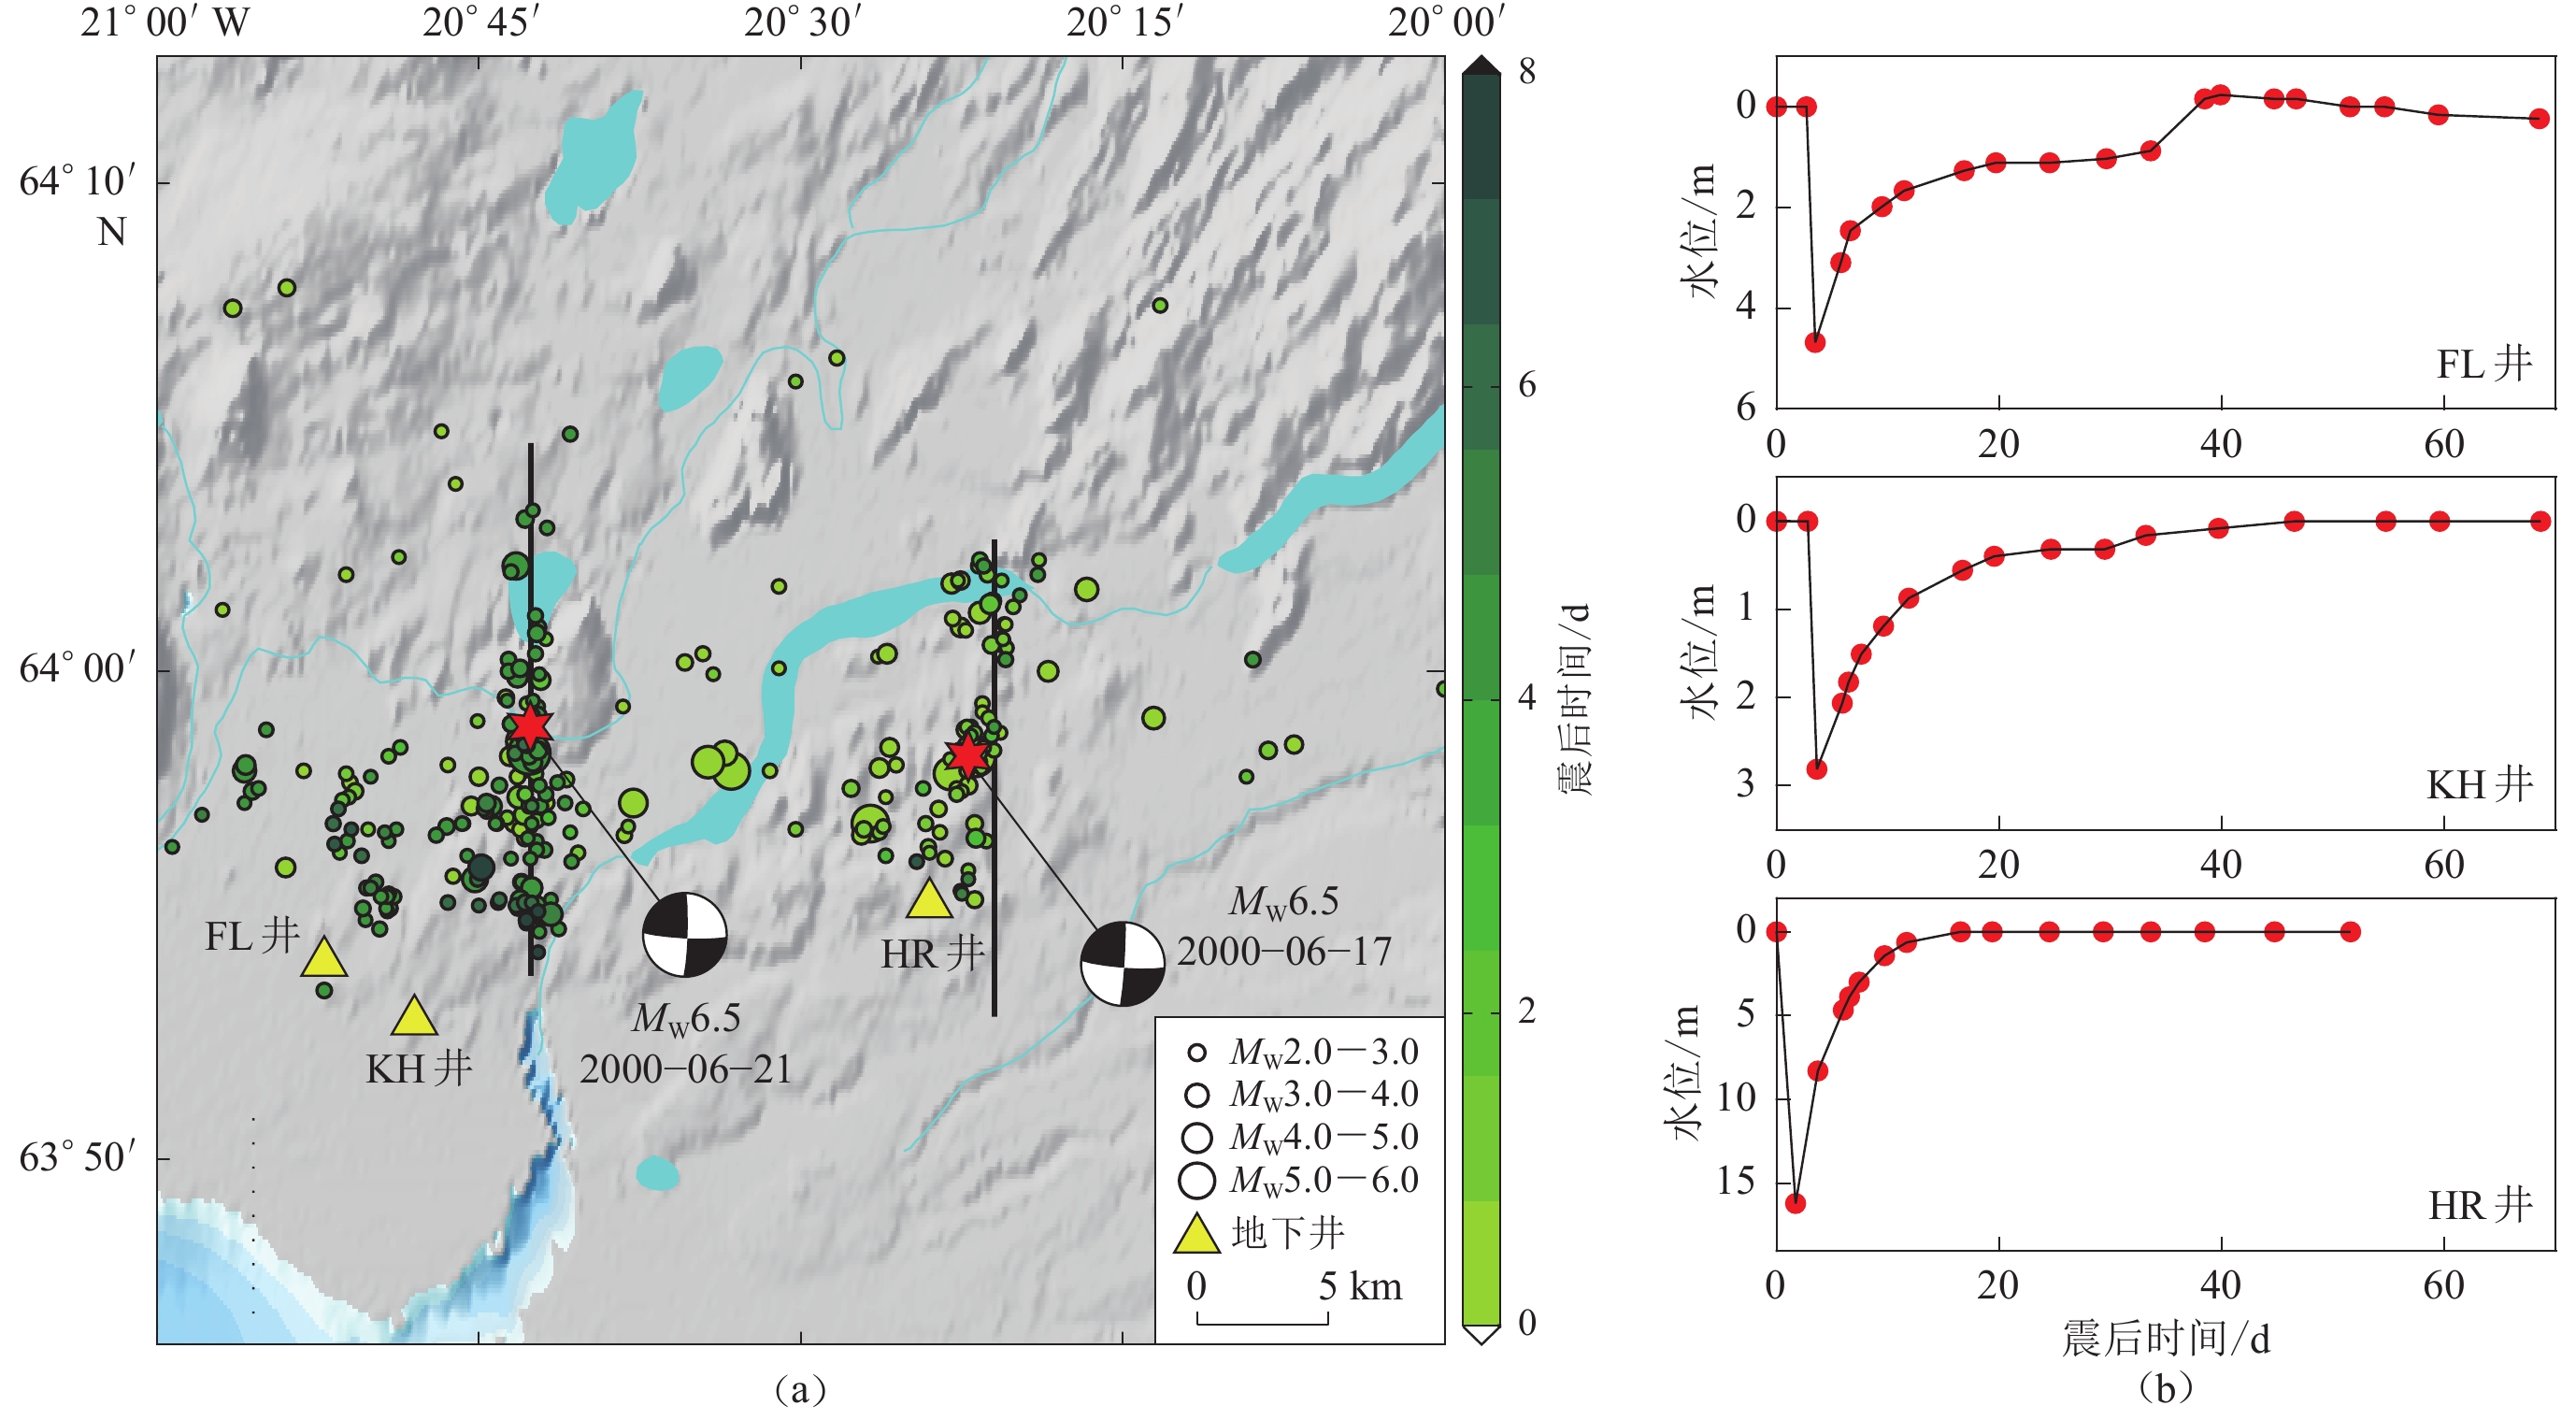
![]() 图 1 冰岛南部两次MW6.5地震震源区的地质构造和地下水位观测数据(a) 2000年6月冰岛南部两次MW6.5地震周边地质构造和地震分布图。黑色实线为发震断裂位置,黑色沙滩球表示两次地震的震源机制解(USGS,2000),绿色圆点表示两次冰岛地震的余震分布(Panzera et al,2016),黄色三角形表示本研究用到的断层近场三个地下水井位置;(b) 断层近场区域三个测井水位的变化(Jónsson et al,2003)Figure 1. Structural background of source region of two MW6.5 southern Iceland earthquakes and groundwater level observations(a) Geological setting surrounding the two 2000 MW6.5 earthquakes and distribution of earthquakes in southern Iceland. Solid black lines show the seismogenic faults,the black beach balls indicate the focal mechanism solutions of the earthquakes on June 17 and 21 (USGS,2000),the green dots show locations of aftershocks of the two Iceland earthquakes (Panzera et al,2016),and the yellow triangles show the locations of the three groundwater wells in the near-field of the fault used in this study;(b) The water level variation of the three near-field groundwater wells (Jónsson et al,2003)
图 1 冰岛南部两次MW6.5地震震源区的地质构造和地下水位观测数据(a) 2000年6月冰岛南部两次MW6.5地震周边地质构造和地震分布图。黑色实线为发震断裂位置,黑色沙滩球表示两次地震的震源机制解(USGS,2000),绿色圆点表示两次冰岛地震的余震分布(Panzera et al,2016),黄色三角形表示本研究用到的断层近场三个地下水井位置;(b) 断层近场区域三个测井水位的变化(Jónsson et al,2003)Figure 1. Structural background of source region of two MW6.5 southern Iceland earthquakes and groundwater level observations(a) Geological setting surrounding the two 2000 MW6.5 earthquakes and distribution of earthquakes in southern Iceland. Solid black lines show the seismogenic faults,the black beach balls indicate the focal mechanism solutions of the earthquakes on June 17 and 21 (USGS,2000),the green dots show locations of aftershocks of the two Iceland earthquakes (Panzera et al,2016),and the yellow triangles show the locations of the three groundwater wells in the near-field of the fault used in this study;(b) The water level variation of the three near-field groundwater wells (Jónsson et al,2003)冰岛南部地震带(Southern Iceland seismic zone,缩写为SISZ)位于冰岛西南部,宽达75—100 km,亚欧板块与北美板块相互分离造成该地震带上的次级断层以南北走向为主。基于地震和大地测量观测资料,Pedersen等(2003)反演了2000年6月该地震带上发生的两次MW6.5地震(图1)的震源参数,结果显示两次地震都是右旋走滑型地震,破裂尺度约为10 km,最大滑动量约为2.5 m。Jónsson等(2003)发现地震后几个月内的地表变形场主要由孔隙回弹效应所致,使用解析模型可以解释破裂面附近的测井水位变化,然而他们采用的是稳态模型解,也未对震源区的孔隙介质参数进行研究。Árnadóttir等(2003)分析了震后短期和长期的变形,认为它们分别由孔隙回弹和震后深部余滑或黏弹性松弛效应引起,但也未分析孔隙回弹随时间的演化,同时也忽略了对震源区介质孔隙参数的讨论。
鉴于此,本文拟以2000年6月冰岛两次MW6.5地震为例,通过震后地下水位观测数据约束震源区孔隙介质参数来研究孔隙回弹效应随时间的演化过程,在此基础上模拟这一效应造成的地表变形,并利用已有观测结果验证模型的可靠性,以探讨孔隙回弹效应对震后形变场的影响。
1. 介质孔隙参数和测井水位观测
1.1 介质孔隙参数
前人研究已表明,同震和震后的水位响应反映了孔隙弹性介质的体应变(Wakita,1975;Roeloffs,1996;Lee et al,2002),近场地下水位的震后变化受流体压力的控制,是地壳应力松弛的结果(Björnsson et al,2001),并且孔压变化对地表位移尤其是垂直向地表位移的影响较大(李伟华,赵成刚,2015)。因此,震后水位变化可以为模拟孔隙压力恢复提供依据,从而约束介质的孔隙参数(司学芸等,2012;Nespoli et al,2018;Panuntun et al,2018;He,Singh,2020)。
影响震后孔隙回弹效应的孔隙参数主要包括Skempton系数、有效应力系数和扩散系数,其中:Skempton系数B表示不排水状态下单位围压变化引起的孔隙压力变化;有效应力系数α,也称Biot系数,表示孔隙介质的压缩能力,为排水状态下介质流体含量增量与体膨胀量的比值;扩散系数D则反映流体在孔隙介质中的流动能力,控制扩散过程的时间尺度(Wang,Kümpel,2003)。本文根据震源区近场的地下水位变化来约束与孔隙压力相关的介质孔隙参数即Skempton系数B和扩散系数D。
Skempton系数B是同震孔隙压变化与同震平均体应力变化的比值,可以根据同震水位阶跃大小约束其取值。震后的水位变化与孔隙流体压力的恢复过程密切相关,因此可以根据震后水位变化的时间特征来约束扩散系数D的范围。
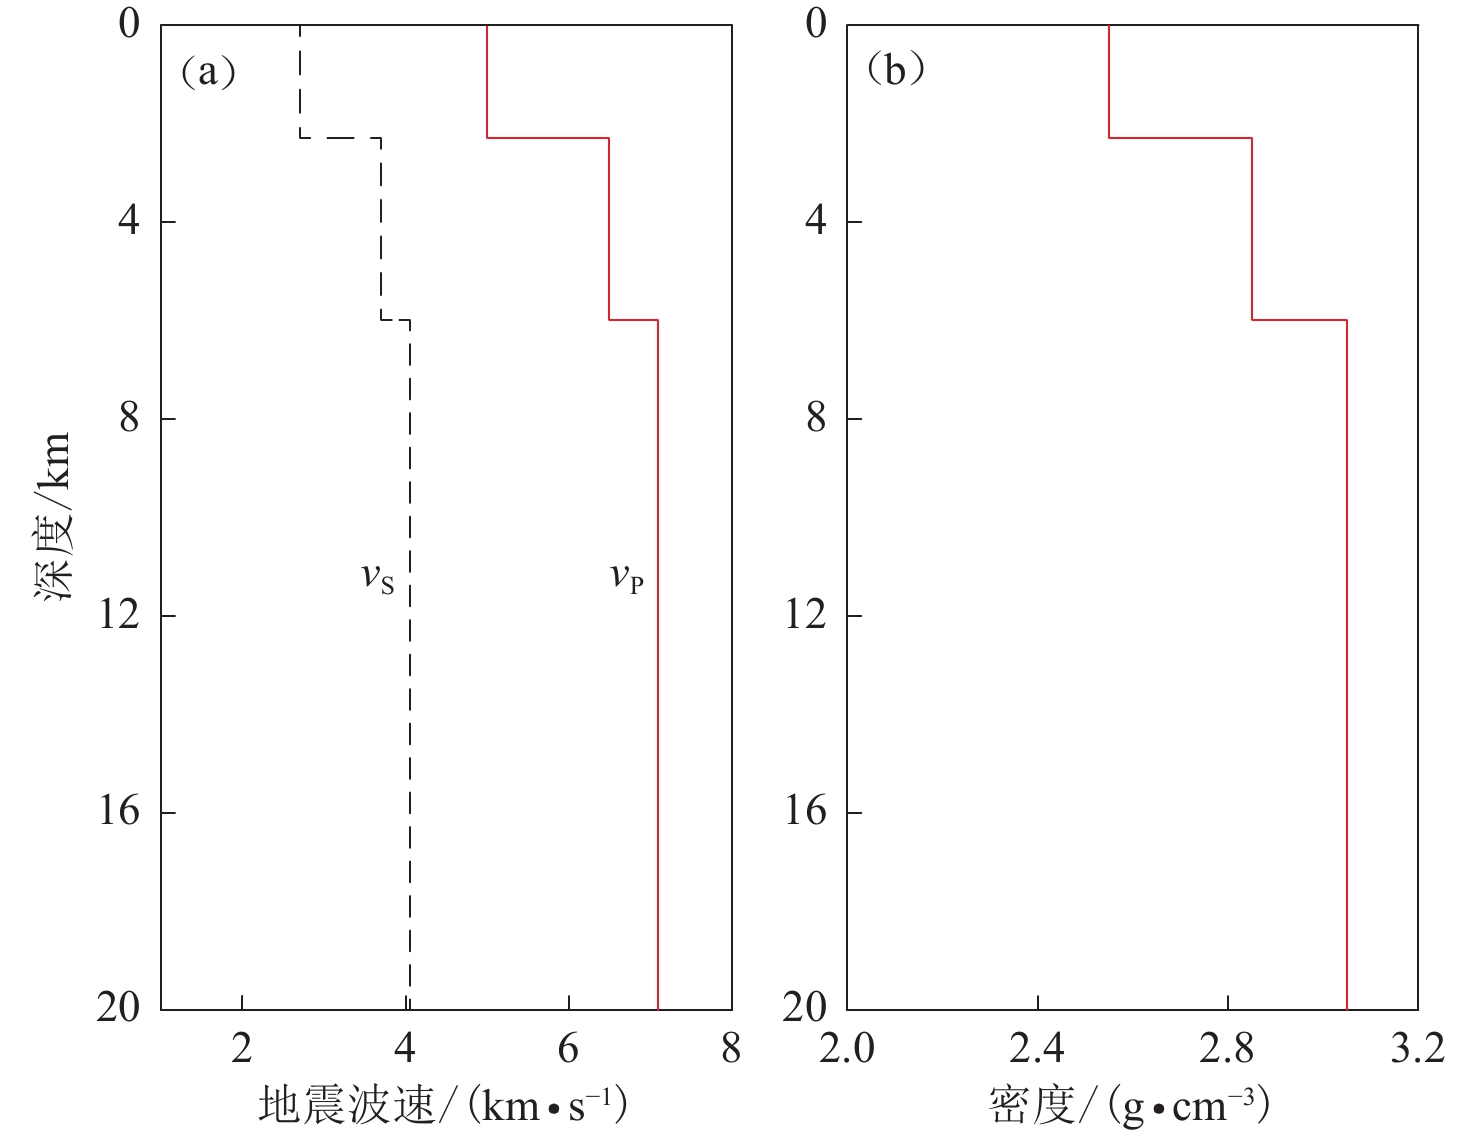
本研究中介质孔隙参数的取值范围主要参照前人研究的成果。Skempton系数B在浅层孔隙介质中不随深度变化,在0.4—0.8之间取值(McCormack et al,2020)。有效应力系数$ \alpha $的取值范围为0.5—0.8 (Geertsma,1957;Walsh,1981)。考虑到在理论范围内有效应力系数$ \alpha $的变化对震后孔隙压力的影响较小,因此本文将其设为0.6 (Gurevich,2004)。流体的扩散系数D在地表以下几千米迅速减小,并随位置和岩性的不同而显著变化,取值范围为10−11—104 m2/s (表1),但在绝大多数断层附近,D的取值范围为0.1—1.0 m2/s (Anderson,Whitcomb,1975;Roeloffs,1996)。孔隙弹性介质模型中,扩散系数D随深度的变化决定了孔隙回弹效应作用的深度和时间尺度。考虑到研究区域地壳介质的密度变化情况(图2b),本研究将地下6 km以上介质作为孔隙回弹发生的主要区域,讨论在该深度范围内Skempton系数和扩散系数对同震和震后水位的控制作用。
表 1 根据现场观测和实验室试验确定的流体扩散系数D (Roeloffs,1996)Table 1. Hydraulic diffusivity D determined from field and laboratory studies (Roeloffs,1996)岩性 扩散系数D/(m2·s−1) 岩性 扩散系数D/(m2·s−1) 最小值 最大值 最小值 最大值 碳酸盐 0.08 1.50×10⁴ 页岩 7.0×10⁻¹¹ 3.0×10⁻⁷ 渗透性玄武岩 0.7 6 泥质岩 6.0×10⁻¹² 4.0×10⁻⁸ 破裂火成岩 0.26 231 黏土 1.0×10⁻⁸ 5.0×10⁻⁵ 砂岩、粉砂岩 0.003 2.31 沙砾 0.7 835 未破裂火成岩 6.0×10⁻⁸ 7.0×10⁻⁶ ![]() 图 2 研究区域的分层半空间孔隙弹性介质模型Crust 2.0(a) 地震波速度;(b) 密度Figure 2. Layered half-space poroelastic medium model Crust 2.0(a) Seismic velocities;(b) Density
图 2 研究区域的分层半空间孔隙弹性介质模型Crust 2.0(a) 地震波速度;(b) 密度Figure 2. Layered half-space poroelastic medium model Crust 2.0(a) Seismic velocities;(b) Density1.2 测井资料
冰岛地区存在丰富的地下含水层,广泛分布的测井为水位观测提供了有利的条件(Flóvenz,Saemundsson,1993)。2000年6月17日冰岛地震发生前,地下水位高度基本保持稳定,或受潮汐作用产生小幅度波动(<2 cm),同震时的应力加载使得水位产生明显的阶跃变化,且上升和下降的测井水位分布与震源机制解密切相关(Jónsson et al,2003)。距离震中较远(30—70 km)的测井,水位变化相对较小(<1 m),震后几天到几个月内水位逐渐恢复(Árnadóttir et al,2005)。长期的水位观测显示,较浅的测井主要反映地表降水和潮汐等因素的影响,可能不太适用于孔隙压力监测,而较深的测井则可反映孔隙压力与地壳应力之间的相关性(Björnsson et al,2001)。本文使用的三个测井(FL,KH和HR,位置见图1)数据源于Jónsson等(2003),测井深度约为1.5 km,测井距发震断层的水平距离约为10—15 km,从三个测井的水位变化可观察到显著的同震水位阶跃和震后水位恢复过程,这些测井水位数据信噪比较高,能够满足本文研究的需求。
2. 震后孔隙回弹模型与参数约束方法
2.1 震后孔隙回弹效应模拟计算
Rice和Cleary (1976)较早地研究了孔隙介质的两种极限状态:排水状态和未排水状态。孔隙流体与孔隙介质之间存在两种相互作用:① 从流体到固体的耦合。当孔隙压力改变时,孔隙介质发生形变;② 从固体到流体的耦合。当孔隙介质发生形变时,孔隙压力发生改变(Detournay,Cheng,1993)。同震应力加载改变了周围介质孔隙压力的分布,在震后的排水过程中,孔隙压力梯度驱动流体从高压区流向低压区,在此期间孔隙压力的变化引起地壳介质发生变形。
计算震后孔隙回弹引起的地壳变形的传统方法是,基于地震位错模型分别计算未排水和排水状态下的同震位移场,再根据二者的差异估计孔隙回弹造成的地表变形。采用这种方法得到的是同震时未排水状态到震后孔隙压力重新平衡后这两种状态之间的总形变量,不能描述孔隙回弹效应随时间变化的特征。另外,这两种状态下介质的泊松比也难以确定,一般是根据经验选取。
本研究采用PEGRN/PECMP软件包(Wang,Kümpel,2003)计算地震造成的孔隙压力变化和地表变形,其中:第一个子程序PEGRN基于孔隙介质模型计算与地表位移和浅层孔隙压力相关的格林函数;第二个子程序PECMP通过对第一步计算获得的格林函数进行线性叠加,计算多个子断层引起的观测点上位移、孔隙压力和应力张量等参数的变化。该程序的求解依赖于与空间位置x和时间t相关的孔隙弹性方程。
$$ ( \lambda {{ + }}2\mu ) \nabla ( \nabla \cdot {\boldsymbol{u}}{{ ) - }}\mu \nabla {\text{×}} ( \nabla {\text{×}} {\boldsymbol{u}} ) - \alpha \nabla p = {\boldsymbol{f}} ( x, t ) \text{,} $$ (1) $$ \frac{1}{Q}\frac{{\partial p}}{{\partial t}} + \alpha \frac{\partial }{{\partial t}}\nabla \cdot {\boldsymbol{u}} - K{\nabla ^2}p = q ( x, t ) \text{,} $$ (2) 式(1)和(2)为孔隙弹性控制方程和质量守恒方程,式中:λ和μ为拉梅常数;${\boldsymbol{u}} $为位移向量;${\boldsymbol{f}} $为单位体应力,q为流体流动速度,二者都是空间位置$ {\boldsymbol{x}} $和时间t的函数;1/Q表示孔隙介质体积的可压缩程度;K为达西传导率,可以用扩散系数D和比存储率SS来表示,K=DSS;α为有效应力系数,
$$ \alpha = \frac{{3 ( {\nu _{\rm{u}}} - \nu ) }}{{ ( 1 - 2\nu ) ( 1 + {\nu _{\rm{u}}} ) B}} \text{,} $$ (3) 式中v为排水泊松比,νu为不排水泊松比,B为Skempton系数。
2.2 冰岛地震的同震破裂模型
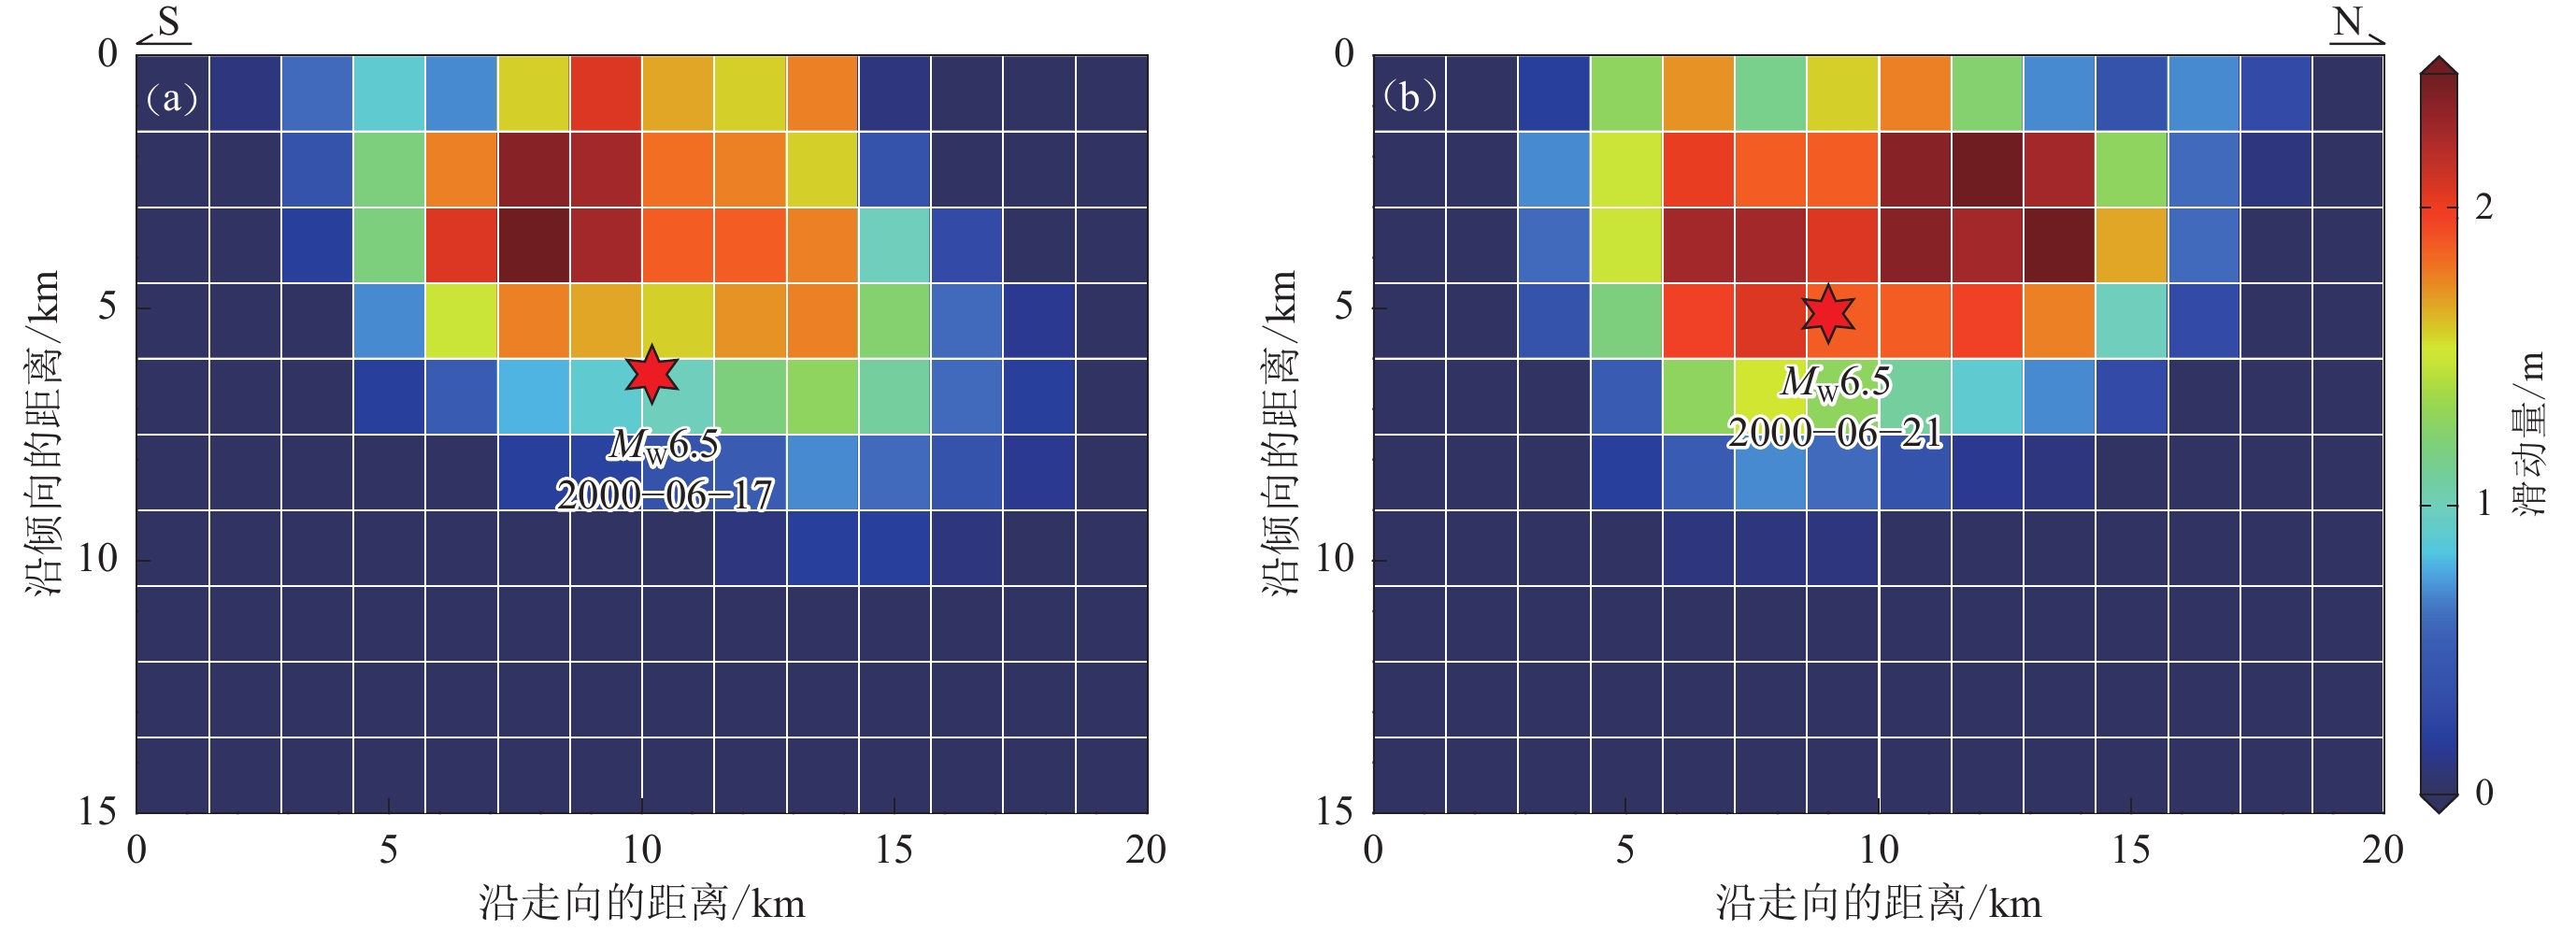
断层同震破裂是驱动孔隙回弹效应的力源,对模拟结果有较大影响。对于2000年冰岛两次MW6.5地震,本文采用Pedersen等(2003)基于InSAR资料反演的精细位错模型(图3)。两次地震发生在两个近南北走向的相邻断层上,呈现出明显的右旋走滑特征。地震造成的地表破裂尺度在沿断层走向上约为10 km,沿倾向方向约6—8 km,大部分破裂发生在地壳浅层5 km以内。东部的6月17日地震的震源深度为6.3 km,西部的6月21日地震为5.1 km,最大滑动量均约为2.5 m (图3)。
![]() 图 3 基于InSAR反演的2000年6月17日(a)和21日(b)冰岛两次MW6.5地震的同震滑动模型(Pedersen et al,2003)Figure 3. Coseismic slip models of the two Iceland earthquakes on 17 (a) and 21 (b) June of 2000 inferred from InSAR data (Pedersen et al,2003)
图 3 基于InSAR反演的2000年6月17日(a)和21日(b)冰岛两次MW6.5地震的同震滑动模型(Pedersen et al,2003)Figure 3. Coseismic slip models of the two Iceland earthquakes on 17 (a) and 21 (b) June of 2000 inferred from InSAR data (Pedersen et al,2003)3. 利用震后地下水位观测约束介质孔隙参数
本文的研究方法是基于地震破裂模型和孔隙介质模型获取孔隙压力的同震变化和震后时间序列,并根据∆hpre=−∆p/ρg模拟地下水位变化,同震孔隙压力变化由∆p=−B∆σkk /3给出(Jónsson et al,2003;McCormack et al,2020)。其中,∆σkk /3为平均应力变化,∆p和∆hpre表示同震孔隙压力和模拟水位的变化。由于同震水位变化与B值成正比,因此可以根据同震观测水位与平均应力变化的比值确定B;震后水位恢复速率与扩散系数D的取值呈正相关关系,考虑到两者之间的非线性关系,我们使用一维搜索方法约束D的范围,使得模拟水位与观测水位的拟合残差最小。考虑到三个测井水位的同震变化相差较大,我们将拟合残差进行归一化处理。一个测井的拟合残差可以表示为:
$$ {\rm{Misfit}}=\sqrt{{\sum _{i=1}^{n}}\frac{1}{n}\left(\frac{\Delta {h}_{{\rm{obs}}}-\Delta {h}_{{\rm{pre}}}}{\Delta {h}_{{\rm{obs}}}}\right)^{2}} \,\,\,\,\,\, \text{,} $$ (4) 式中n表示每个测井水位观测采样数,hobs为观测水位,hpre为模拟水位。通过拟合残差大小判断模型结果对观测值的拟合程度,从而搜索最优参数。
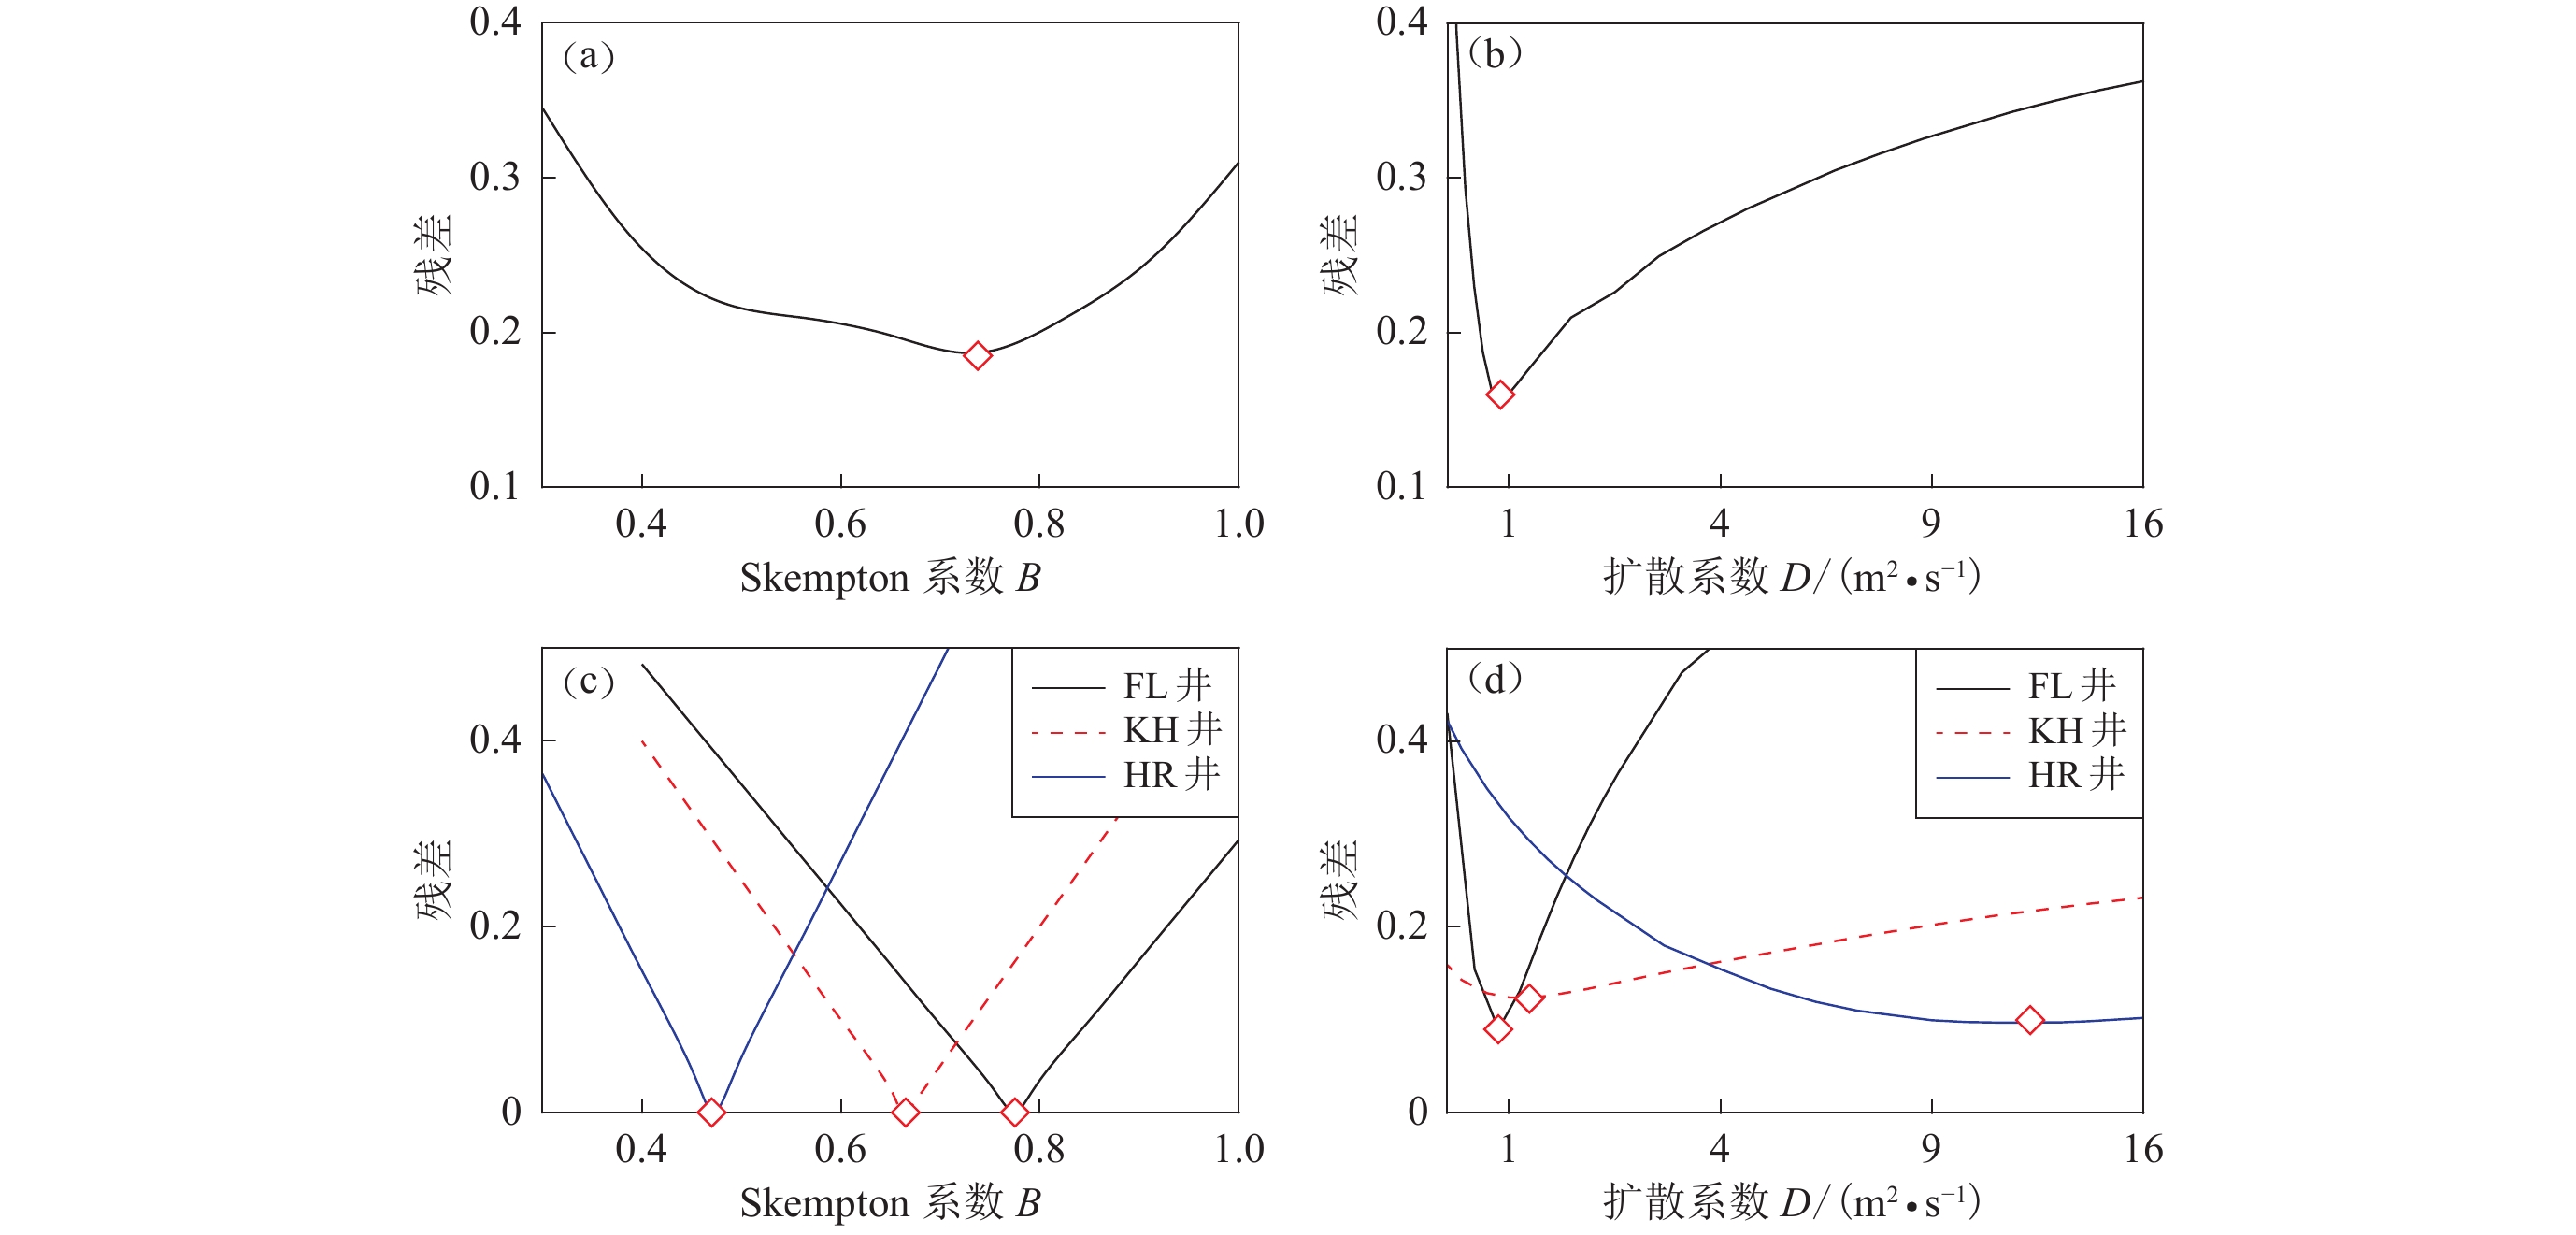
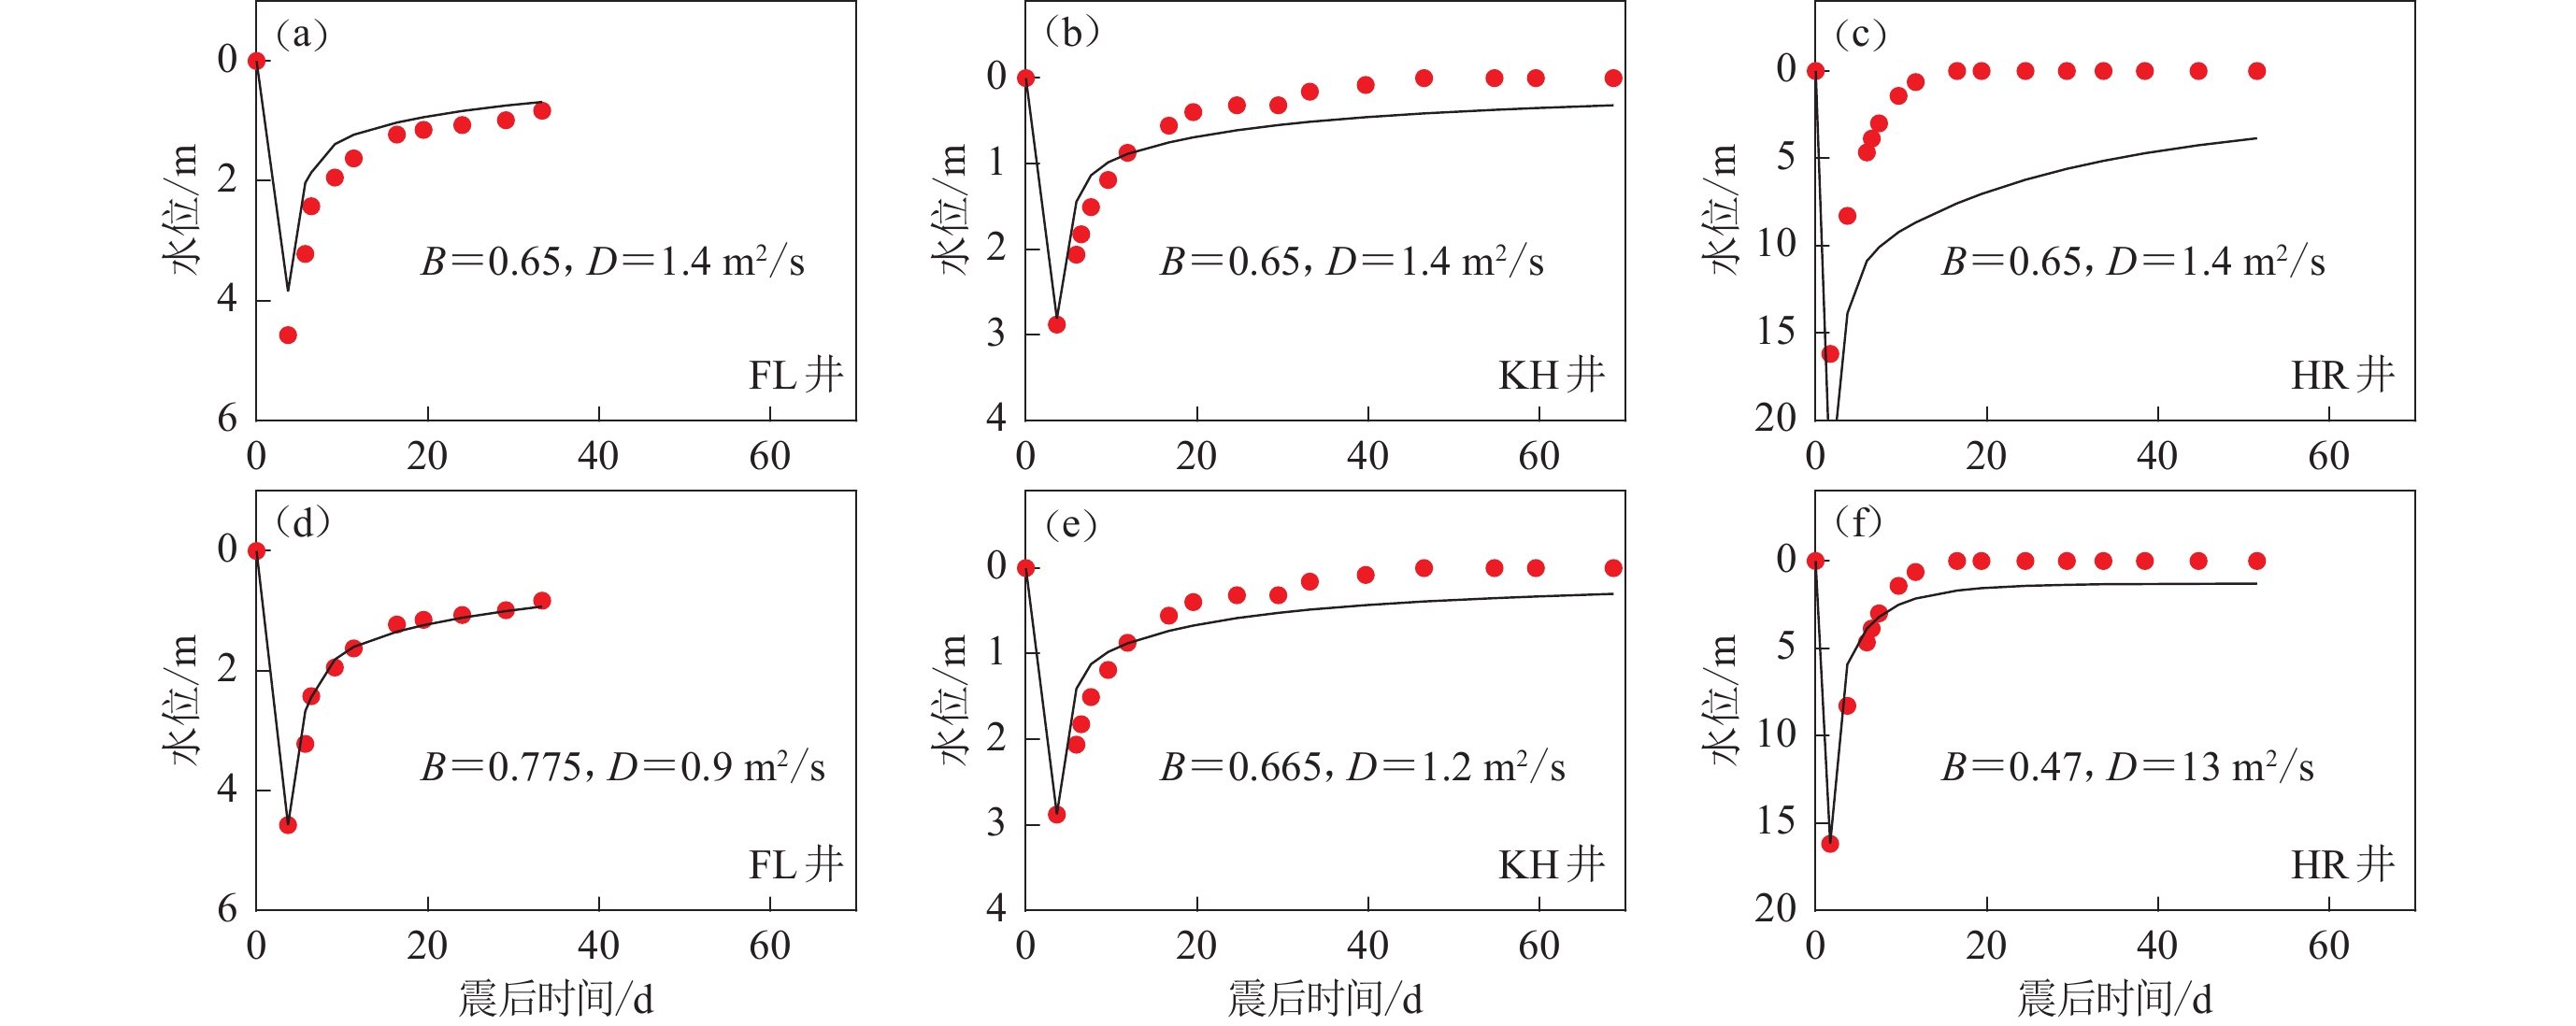
针对本研究收集的FL,KH和HR三个测井的水位数据(Jónsson et al,2003),我们首先利用同震水位变化约束Skempton系数B,然后在此基础上通过震后水位恢复过程约束扩散系数D。由于FL测井水位曲线在震后40天左右出现明显扰动,可能反映了强余震或者其它局部因素的影响,因此我们仅使用该测井震后一个月内的数据参与数据拟合。结果显示,参数B和D的最优取值分别为0.65和1.4 m2/s (图4a,b)。以这组参数模拟的震后水位变化与观测值的拟合情况如图5a-c所示,其中KH测井模拟水位曲线与观测数据拟合较好(图5b),而FL测井水位的同震阶跃响应和HR测井水位的震后恢复与观测数据的拟合程度较差(图5a,c),这表明仅使用一组孔隙参数难以同时拟合研究区域内的三个测井水位变化,这也可能反映了孔隙介质的横向差异。
![]() 图 4 基于测井水位变化约束得到的Skempton 系数B和扩散系数D的搜索结果菱形表示最佳的参数取值。图(a)和(b)分别表示同时对三个测井水位数据进行拟合的残差分布情况;图(c)和(d)表示分别拟合FL,KH和HR测井水位数据的残差分布情况Figure 4. Optimal values of Skempton ratio B and hydraulic diffusivity D constrained by groundwater level changesThe lozenges indicate the optimal values of the poroelastic parameters. Figs. (a) and (b) show the misfit varies with B and D for three water level data;Figs. (c) and (d) shows the misfit variations by fitting the water level change of site FL,KH and HR,respectively
图 4 基于测井水位变化约束得到的Skempton 系数B和扩散系数D的搜索结果菱形表示最佳的参数取值。图(a)和(b)分别表示同时对三个测井水位数据进行拟合的残差分布情况;图(c)和(d)表示分别拟合FL,KH和HR测井水位数据的残差分布情况Figure 4. Optimal values of Skempton ratio B and hydraulic diffusivity D constrained by groundwater level changesThe lozenges indicate the optimal values of the poroelastic parameters. Figs. (a) and (b) show the misfit varies with B and D for three water level data;Figs. (c) and (d) shows the misfit variations by fitting the water level change of site FL,KH and HR,respectively![]() 图 5 测井FL,KH和HR的模型预测水位(黑色实线)与观测水位(红色圆点)的比较图(a)−(c)表示使用相同孔隙参数的拟合情况,图(d)−(f)表示分别使用不同孔隙参数的拟合情况Figure 5. Comparison of predicted (black lines) and observed (red dots) water levels for the measuring wells FL,KH和HRFigs. (a)−(c) represent data-fitting with the same set of poroelastic parameters,and Figs. (d)−(f) represent data-fitting with three sets of poroelastic parameters,respectively
图 5 测井FL,KH和HR的模型预测水位(黑色实线)与观测水位(红色圆点)的比较图(a)−(c)表示使用相同孔隙参数的拟合情况,图(d)−(f)表示分别使用不同孔隙参数的拟合情况Figure 5. Comparison of predicted (black lines) and observed (red dots) water levels for the measuring wells FL,KH和HRFigs. (a)−(c) represent data-fitting with the same set of poroelastic parameters,and Figs. (d)−(f) represent data-fitting with three sets of poroelastic parameters,respectively为了更好地拟合观测资料,我们分别使用三个测井水位数据搜索B和D的取值,结果如图4c和4d所示。可以看出:分别使用测井数据搜索得到的模型参数相比于三个测井资料联合拟合得到的参数存在一定的差异,模拟结果对观测数据的拟合误差有一定的改善(图5d-f)。对FL和KH测井来说,孔隙参数变化较小,B值从0.65升至0.775和0.665,D的最佳取值为0.9 m2/s和1.2 m2/s。对HR测井而言,水位曲线拟合误差得到明显改善,B值降至0.47, D值从1.4 m2/s 增至13 m2/s,反映了其震后水位恢复速率远高于FL和KH测井。
4. 结果
2000年6月21日冰岛地震西南部的FL和KH测井水位的松弛时间约为20—30 d,之后基本恢复至震前水位(图5d,e),表明模型预测值与观测水位的变化趋势较为一致。同时,震后水位恢复与同震水位阶跃幅值基本相同,预测结果和观测数据都显示FL和KH测井的同震和震后水位变化分别约为4 m和3 m,HR测井的同震水位变化可达15 m (图5f)。位于6月17日地震震中附近的HR测井的同震水位振幅明显高于其余两个测井,同时水位的恢复速率也明显较大,表明该地区流体的扩散速度远大于周边地区。研究区域内上地壳主要为玄武岩(Stefansson et al,2008),其对应的扩散系数取值范围为0.7—6 m2/s,水位约束结果显示FL和KH测井的扩散系数取值处于0.9—1.2 m2/s范围内,HR测井约束结果为13 m2/s,该数值超过了理论的扩散系数范围,可能是其它因素导致了其水位的快速恢复,如同震破裂造成含水层联通效应等(Björnsson et al,2001)。
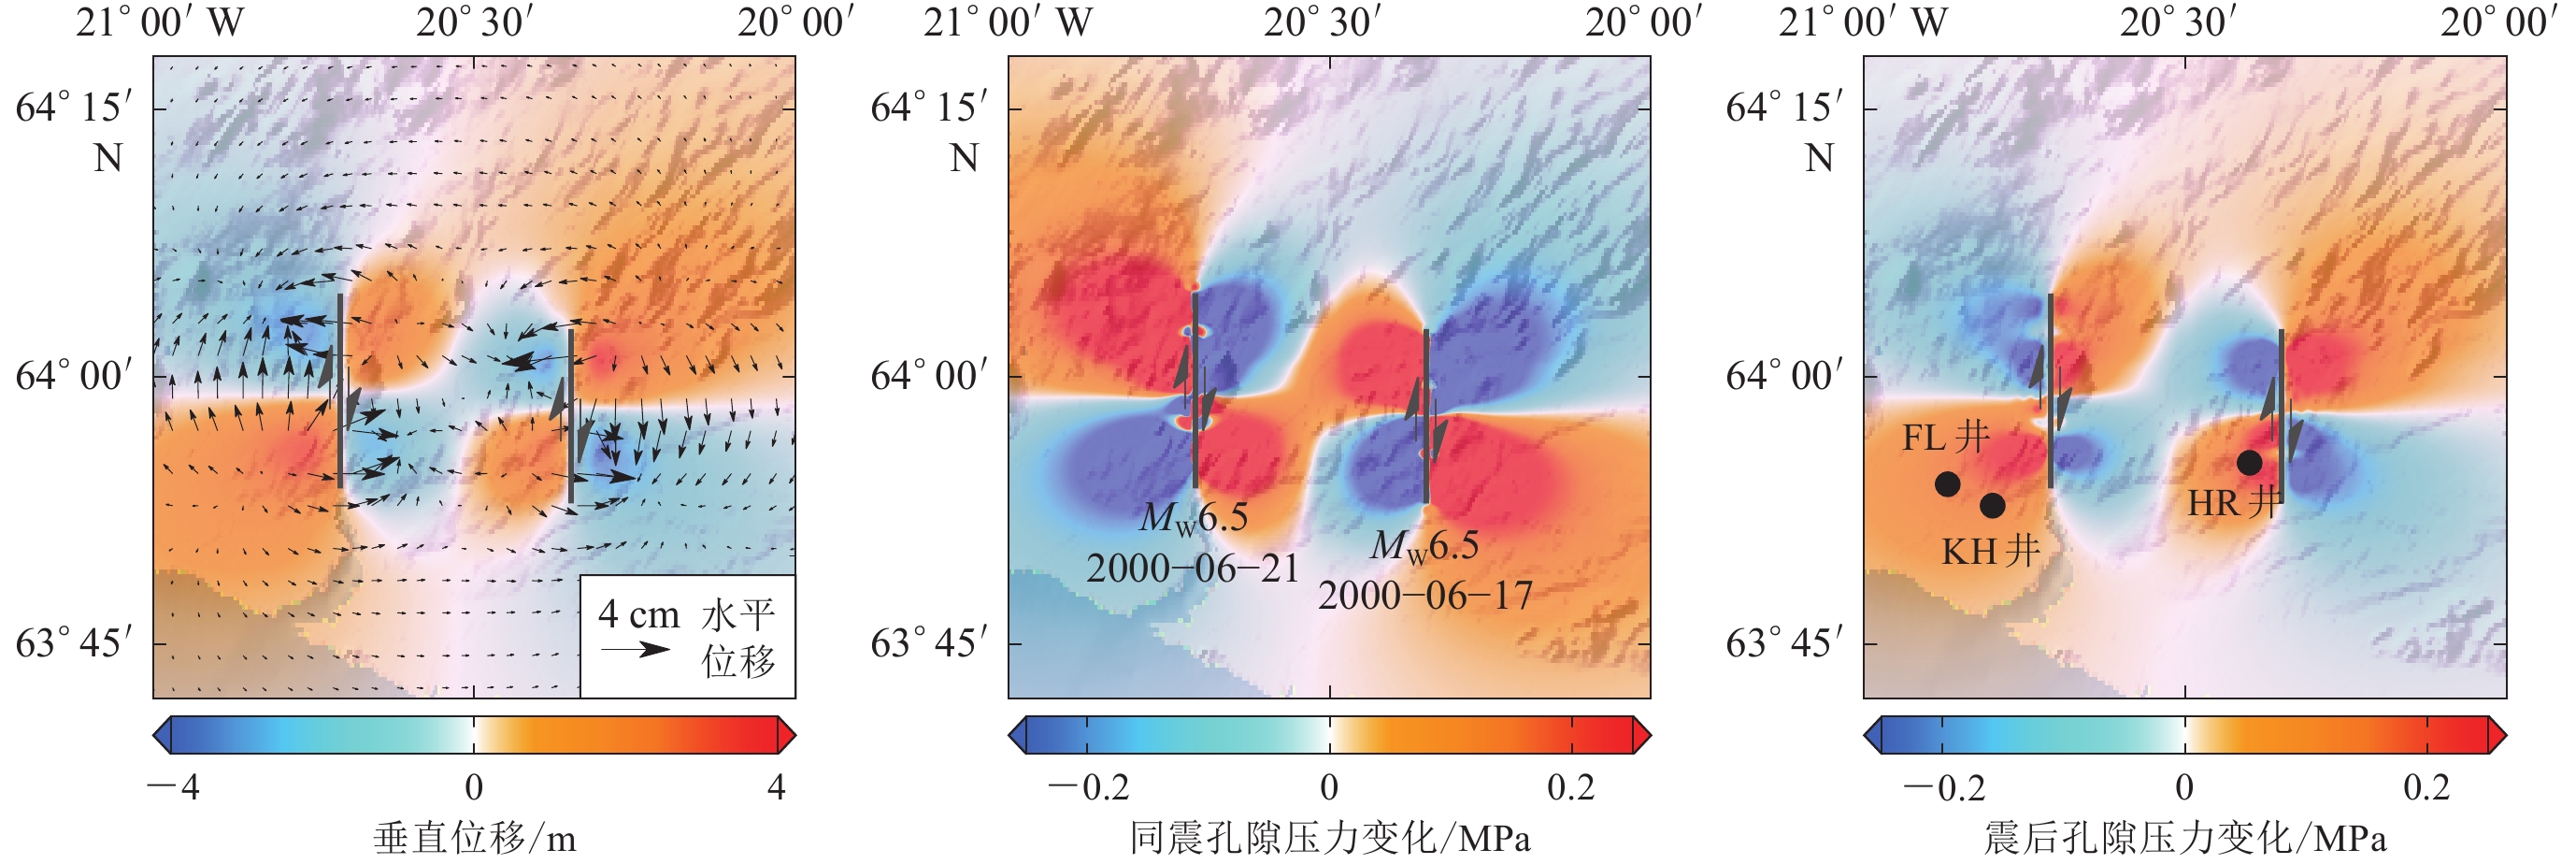
为了更好地认识震后孔隙回弹效应造成的变形,我们基于冰岛地震的同震滑动分布(图3)和所获最优孔隙参数(B=0.65,D=1.4 m2/s)计算了这两次地震造成的孔隙压力变化及引起的地表变形,结果如图6所示。模拟结果显示,震后孔隙回弹造成的地表变形主要有以下特征:
![]() 图 6 冰岛地震震后孔隙回弹造成的地表变形以及同震、震后的孔隙压力变化(a) 冰岛地震震后孔隙回弹引起的地表位移场;(b) 6月17日和21日两次地震造成的同震孔隙压力变化;(c) 6月21日地震后预测的震后孔隙压力变化,黑色点位为震后水位上升井Figure 6. The surface deformation due to poroelastic rebound and coseismic and postseismic pore pressure changes of Iceland earthquakes(a) The surface displacement field caused by postseismic poroelastic rebound of the Iceland earthquakes;(b) The coseismic pore-pressure change caused by the earthquakes on June 17 and 21,2000;(c) The predicted postseismic pore pressure changes after June 21 earthquake,where black dots show the wells with water level increasing after the earthquakes
图 6 冰岛地震震后孔隙回弹造成的地表变形以及同震、震后的孔隙压力变化(a) 冰岛地震震后孔隙回弹引起的地表位移场;(b) 6月17日和21日两次地震造成的同震孔隙压力变化;(c) 6月21日地震后预测的震后孔隙压力变化,黑色点位为震后水位上升井Figure 6. The surface deformation due to poroelastic rebound and coseismic and postseismic pore pressure changes of Iceland earthquakes(a) The surface displacement field caused by postseismic poroelastic rebound of the Iceland earthquakes;(b) The coseismic pore-pressure change caused by the earthquakes on June 17 and 21,2000;(c) The predicted postseismic pore pressure changes after June 21 earthquake,where black dots show the wells with water level increasing after the earthquakes1) 震后孔隙回弹引起的近场地表变形处于cm量级。在断层周围变形量最大,最大垂直位移约为4 cm,水平位移约为2—3 cm (图6a)。由于介质中流体扩散系数D沿深度迅速减小(Kuang,Jiao,2014),并且膨胀应变随着距发震断层的距离快速衰减(Koerner et al,2004),孔隙回弹效应造成的变形主要集中在破裂带两侧和破裂末端,影响范围较小。
2) 由于地震的纯走滑运动特征,断层两侧的地表垂向变形近似呈中心对称分布。同震受挤压作用区域的孔隙压力升高并在震后降低,从而引起地表下沉,导致其周围地表水平变形场呈会聚态势。而在同震破裂时拉张区域的孔隙压力在震后上升,引起周围地表抬升,导致区域地表水平变形场呈发散态势(图6a)。
3) 地震改变了地壳浅层的孔隙压力,在孔隙压力的震后平衡过程中,流体从孔压升高的区域向孔压下降的区域运动(Tung,Masterlark,2018)。因此地壳浅层的同震孔隙压力分布(图6b)与震后孔隙压力的变化(图6c)呈负相关关系。由于震后孔隙回弹造成的地壳变形是由孔隙压力变化引起的,因此地表垂直位移场与震后孔隙压力分布呈正相关关系(图6a)。
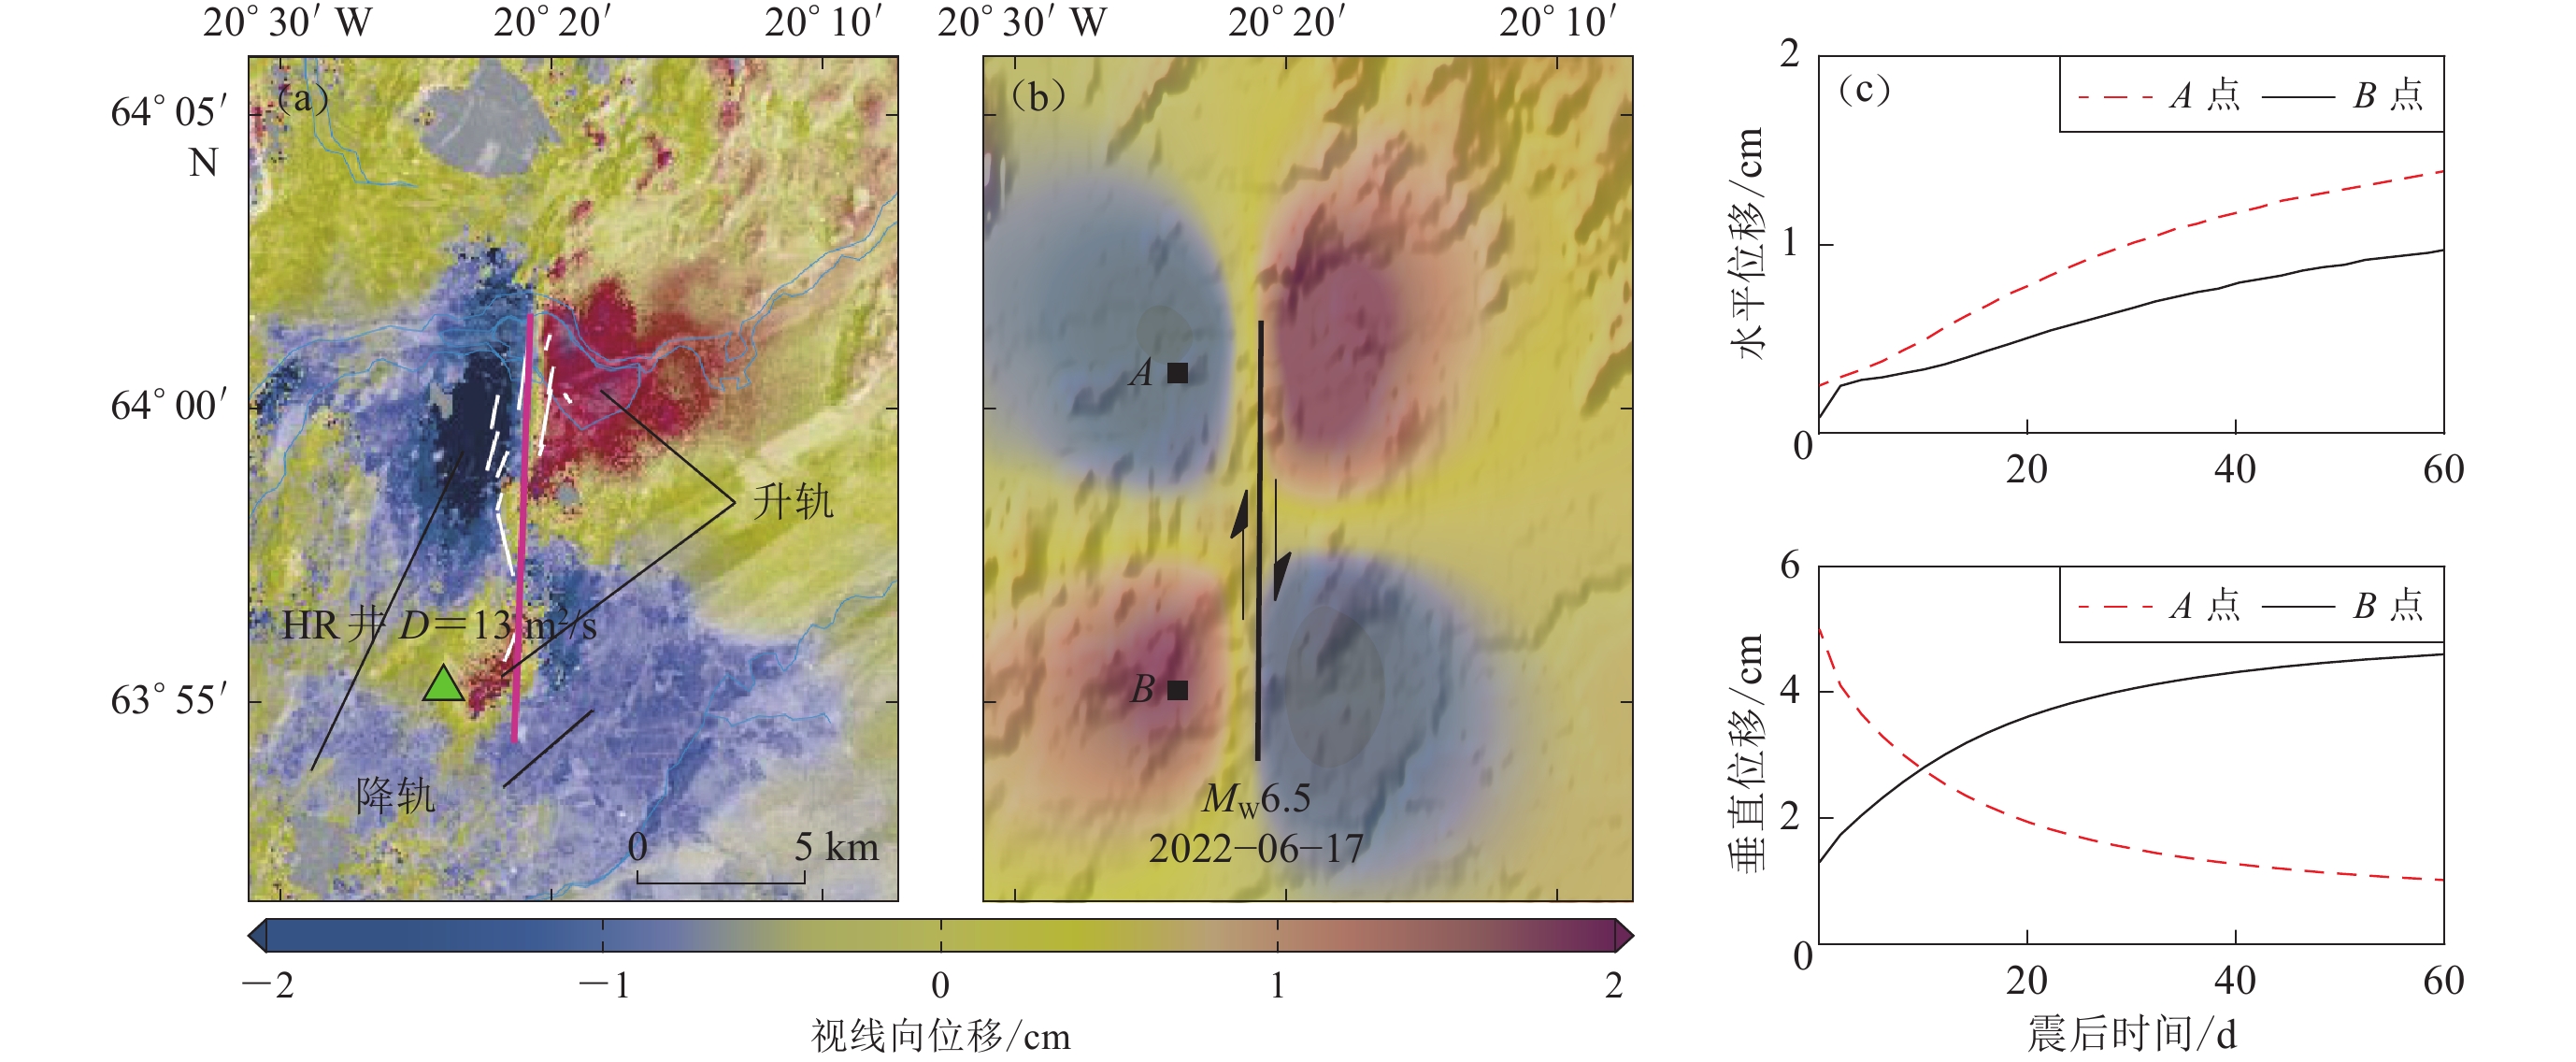
为了检验所获孔隙介质参数的可靠性,我们根据这些最优参数模拟计算了震后地表变形,并与InSAR干涉影像进行比较。首先使用6月21日地震西南部FL和KH测井的水位约束得到的最优孔隙参数(B=0.65,D=1.4 ${\mathrm{m}}^{2}/\mathrm{s}$)进行模拟。结果显示:断层北部地表位移的大小和分布与观测值比较一致,最大视线向位移位于断层西侧,约2—3 cm,且东侧变形场的影响范围略小于西侧(图7b);而在断层南部区域,模拟变形和观测变形存在差异。结合HR测井水位的震后恢复情况来看,同震水位响应振幅约为15 m,3天内水位恢复至8 m (图5f),这可能暗示着断层南部区域的孔隙回弹效应持续时间较短,超过50%的地表变形在震后3天内发生,而InSAR观测的变形时段是从震后3天到37天,未覆盖到震后孔隙回弹造成的快速变形。另一种可能是发生了含水层联通,HR测井附近孔隙回弹造成的变形本身就较小。
![]() 图 7 观测变形与模拟孔隙回弹造成地表变形的比较(a) 6月17日地震近场震后InSAR变形 (Jónsson et al,2003);(b) 扩散系数D=1.4 m2/s时预测的视线向变形;(c) 图(b)中点A和B的水平位移和垂直位移变化Figure 7. Comparison of observed deformation with simulated surface deformation caused by poroelastic rebound(a) Near-field postseismic InSAR deformation after the June 17 earthquake (Jónsson et al,2003);(b) The predicted LOS deformation with hydraulic diffusivity D=1.4 m2/s;(c) Horizontal and vertical displacement changes on the sites A and B shown in Fig. 7b,respectively
图 7 观测变形与模拟孔隙回弹造成地表变形的比较(a) 6月17日地震近场震后InSAR变形 (Jónsson et al,2003);(b) 扩散系数D=1.4 m2/s时预测的视线向变形;(c) 图(b)中点A和B的水平位移和垂直位移变化Figure 7. Comparison of observed deformation with simulated surface deformation caused by poroelastic rebound(a) Near-field postseismic InSAR deformation after the June 17 earthquake (Jónsson et al,2003);(b) The predicted LOS deformation with hydraulic diffusivity D=1.4 m2/s;(c) Horizontal and vertical displacement changes on the sites A and B shown in Fig. 7b,respectively为展示震后孔隙回弹造成的地表变形过程,我们根据水位数据搜索出来的最优孔隙参数给出了近场点A和B的位移随时间的变化,如图7c所示。可见:两点的垂直位移变化较为相似,持续时间约1—2个月,位移约为4 cm,变形速率随时间下降;两点的水平位移变化相对垂直位移较小,这与膨胀应变引起的地表位移特征相符。需要注意的是,孔隙回弹引起的垂直位移随时间增大,而B点的水平位移变形速率在震后两天内较大,10天后明显下降,这是由于该点处的南北向位移分量在此时段内呈下降趋势,表明评估孔隙回弹效应的整体贡献时应当考虑其时间变化特征。
5. 讨论与结论
本文利用震后流体观测资料约束了地壳浅层介质孔隙参数,并基于孔隙弹性模型采用数值模拟方法计算了震后孔隙回弹效应随时间的演化过程,解释了2000年冰岛地震近场水位变化以及震后地表位移场。结果显示,孔隙回弹效应的持续时间主要受流体扩散系数控制,为0—60天,时间尺度远小于震后余滑和黏弹性松弛效应,其造成的地表位移范围较小,集中在破裂带周围,并随距离迅速衰减。在流体扩散系数较大的区域,孔隙压力恢复主要发生在震后数天内,因此较难通过变形观测资料对孔隙回弹的贡献进行有效约束。
本研究模拟的2000年冰岛地震的震后孔隙回弹效应造成的地表变形最大位移约为4—5 cm,整体分布与前人结果较为一致。相比于前人研究,本研究考虑了孔隙回弹效应的时间演化过程,为深入分析震后变形的时变过程提供了定量依据。
本文以近场有限的测井水位资料作为观测数据开展研究。反演结果显示,不同区域的扩散系数有较大差异,这可能与孔隙介质的局部地质条件有关,暗示地壳浅层的孔隙参数有较强的横向非均匀性,后续研究中应予以考虑。
感谢两位评审专家提供的建设性意见。文中图件由GMT软件(Wessel et al,2019)绘制。
-
![]()
图 1 冰岛南部两次MW6.5地震震源区的地质构造和地下水位观测数据
(a) 2000年6月冰岛南部两次MW6.5地震周边地质构造和地震分布图。黑色实线为发震断裂位置,黑色沙滩球表示两次地震的震源机制解(USGS,2000),绿色圆点表示两次冰岛地震的余震分布(Panzera et al,2016),黄色三角形表示本研究用到的断层近场三个地下水井位置;(b) 断层近场区域三个测井水位的变化(Jónsson et al,2003)
Figure 1. Structural background of source region of two MW6.5 southern Iceland earthquakes and groundwater level observations
(a) Geological setting surrounding the two 2000 MW6.5 earthquakes and distribution of earthquakes in southern Iceland. Solid black lines show the seismogenic faults,the black beach balls indicate the focal mechanism solutions of the earthquakes on June 17 and 21 (USGS,2000),the green dots show locations of aftershocks of the two Iceland earthquakes (Panzera et al,2016),and the yellow triangles show the locations of the three groundwater wells in the near-field of the fault used in this study;(b) The water level variation of the three near-field groundwater wells (Jónsson et al,2003)
![]()
图 2 研究区域的分层半空间孔隙弹性介质模型Crust 2.0
(a) 地震波速度;(b) 密度
Figure 2. Layered half-space poroelastic medium model Crust 2.0
(a) Seismic velocities;(b) Density
![]()
图 3 基于InSAR反演的2000年6月17日(a)和21日(b)冰岛两次MW6.5地震的同震滑动模型(Pedersen et al,2003)
Figure 3. Coseismic slip models of the two Iceland earthquakes on 17 (a) and 21 (b) June of 2000 inferred from InSAR data (Pedersen et al,2003)
![]()
图 4 基于测井水位变化约束得到的Skempton 系数B和扩散系数D的搜索结果
菱形表示最佳的参数取值。图(a)和(b)分别表示同时对三个测井水位数据进行拟合的残差分布情况;图(c)和(d)表示分别拟合FL,KH和HR测井水位数据的残差分布情况
Figure 4. Optimal values of Skempton ratio B and hydraulic diffusivity D constrained by groundwater level changes
The lozenges indicate the optimal values of the poroelastic parameters. Figs. (a) and (b) show the misfit varies with B and D for three water level data;Figs. (c) and (d) shows the misfit variations by fitting the water level change of site FL,KH and HR,respectively
![]()
图 5 测井FL,KH和HR的模型预测水位(黑色实线)与观测水位(红色圆点)的比较
图(a)−(c)表示使用相同孔隙参数的拟合情况,图(d)−(f)表示分别使用不同孔隙参数的拟合情况
Figure 5. Comparison of predicted (black lines) and observed (red dots) water levels for the measuring wells FL,KH和HR
Figs. (a)−(c) represent data-fitting with the same set of poroelastic parameters,and Figs. (d)−(f) represent data-fitting with three sets of poroelastic parameters,respectively
![]()
图 6 冰岛地震震后孔隙回弹造成的地表变形以及同震、震后的孔隙压力变化
(a) 冰岛地震震后孔隙回弹引起的地表位移场;(b) 6月17日和21日两次地震造成的同震孔隙压力变化;(c) 6月21日地震后预测的震后孔隙压力变化,黑色点位为震后水位上升井
Figure 6. The surface deformation due to poroelastic rebound and coseismic and postseismic pore pressure changes of Iceland earthquakes
(a) The surface displacement field caused by postseismic poroelastic rebound of the Iceland earthquakes;(b) The coseismic pore-pressure change caused by the earthquakes on June 17 and 21,2000;(c) The predicted postseismic pore pressure changes after June 21 earthquake,where black dots show the wells with water level increasing after the earthquakes
![]()
图 7 观测变形与模拟孔隙回弹造成地表变形的比较
(a) 6月17日地震近场震后InSAR变形 (Jónsson et al,2003);(b) 扩散系数D=1.4 m2/s时预测的视线向变形;(c) 图(b)中点A和B的水平位移和垂直位移变化
Figure 7. Comparison of observed deformation with simulated surface deformation caused by poroelastic rebound
(a) Near-field postseismic InSAR deformation after the June 17 earthquake (Jónsson et al,2003);(b) The predicted LOS deformation with hydraulic diffusivity D=1.4 m2/s;(c) Horizontal and vertical displacement changes on the sites A and B shown in Fig. 7b,respectively
表 1 根据现场观测和实验室试验确定的流体扩散系数D (Roeloffs,1996)
Table 1 Hydraulic diffusivity D determined from field and laboratory studies (Roeloffs,1996)
岩性 扩散系数D/(m2·s−1) 岩性 扩散系数D/(m2·s−1) 最小值 最大值 最小值 最大值 碳酸盐 0.08 1.50×10⁴ 页岩 7.0×10⁻¹¹ 3.0×10⁻⁷ 渗透性玄武岩 0.7 6 泥质岩 6.0×10⁻¹² 4.0×10⁻⁸ 破裂火成岩 0.26 231 黏土 1.0×10⁻⁸ 5.0×10⁻⁵ 砂岩、粉砂岩 0.003 2.31 沙砾 0.7 835 未破裂火成岩 6.0×10⁻⁸ 7.0×10⁻⁶  下载: 导出CSV
-
蒋喆,聂凤军,赵元艺,Franzson H,刘春花,王丰翔,张伟波. 2020. 冰岛区域地质及矿产资源特征[J]. 地质通报,39(5):755–764. doi: 10.12097/j.issn.1671-2552.2020.05.016 Jiang Z,Nie F J,Zhao Y Y,Franzson H,Liu C H,Wang F X,Zhang W B. 2020. Regional geological and mineral resources characteristics of Iceland[J]. Geological Bulletin of China,39(5):755–764 (in Chinese).
李伟华,赵成刚. 2015. 地下水位变化对地震地面运动的影响[J]. 地震学报,37(3):482–492. doi: 10.11939/jass.2015.03.011 Li W H,Zhao C G. 2015. Effects of the groundwater level variation on earthquake ground motions[J]. Acta Seismologica Sinica,37(3):482–492 (in Chinese).
司学芸,邵志刚,周龙泉,张浪平,晏锐. 2012. 汶川8.0级地震近场流体的同震响应与震后效应机理的数值模拟研究[J]. 地震,32(1):49–58. doi: 10.3969/j.issn.1000-3274.2012.01.005 Si X Y,Shao Z G,Zhou L Q,Zhang L P,Yan R. 2012. Numerical simulation of near-field fluid coseismic response and post-seismic effects of the Wenchuan 8.0 earthquake[J]. Earthquake,32(1):49–58 (in Chinese).
Anderson D L,Whitcomb J H. 1975. Time-dependent seismology[J]. J Geophys Res,80(11):1497–1503. doi: 10.1029/JB080i011p01497
Árnadóttir T,Jónsson S,Pedersen R,Gudmundsson G B. 2003. Coulomb stress changes in the South Iceland Seismic Zone due to two large earthquakes in June 2000[J]. Geophys Res Lett,30(5):1205.
Árnadóttir T,Jónsson S,Pollitz F F,Jiang W P,Feigl K L. 2005. Postseismic deformation following the June 2000 earthquake sequence in the south Iceland seismic zone[J]. J Geophys Res:Solid Earth,110(B12):B12308. doi: 10.1029/2005JB003701
Björnsson G, Flovenz Ó G, Saemundsson K, Einarsson E H. 2001. Pressure changes in Icelandic geothermal reservoirs associated with two large earthquakes in June 2000[C]//Proceedings of the 26th Workshop on Geothermal Reservoir Engineering. Stanford: Stanford University: 29–31.
Detournay E, Cheng A H D. 1993. Fundamentals of poroelasticity[G]//Analysis and Design Methods. Amsterdam: Elsevier: 113–171.
Diao F Q,Wang R J,Wang Y B,Xiong X,Walter T R. 2018. Fault behavior and lower crustal rheology inferred from the first seven years of postseismic GPS data after the 2008 Wenchuan earthquake[J]. Earth Planet Sci Lett,495:202–212. doi: 10.1016/j.jpgl.2018.05.020
Flóvenz Ó G,Saemundsson K. 1993. Heat flow and geothermal processes in Iceland[J]. Tectonophysics,225(1/2):123–138.
Freed A M. 2007. Afterslip (and only afterslip) following the 2004 Parkfield,California,earthquake[J]. Geophys Res Lett,34(6):L06312.
Geertsma J. 1957. The effect of fluid pressure decline on volumetric changes of porous rocks[J]. Trans AIME,210(1):331–340. doi: 10.2118/728-G
Gurevich B. 2004. A simple derivation of the effective stress coefficient for seismic velocities in porous rocks[J]. Geophysics,69(2):393–397. doi: 10.1190/1.1707058
He A H,Singh R P. 2020. Coseismic groundwater temperature response associated with the Wenchuan earthquake[J]. Pure Appl Geophys,177(1):109–120. doi: 10.1007/s00024-019-02097-4
Hu Y, Bürgmann R, Freymueller J T, Banerjee P, Wang K L. 2014. Contributions of poroelastic rebound and a weak volcanic arc to the postseismic deformation of the 2011 Tohoku earthquake[J]. Earth Planets Space, 66(1): 106.
Jónsson S,Segall P,Pedersen R,Björnsson G. 2003. Post-earthquake ground movements correlated to pore-pressure transients[J]. Nature,424(6945):179–183. doi: 10.1038/nature01776
Koerner A,Kissling E,Miller S A. 2004. A model of deep crustal fluid flow following the MW=8.0 Antofagasta,Chile,earthquake[J]. J Geophys Res:Solid Earth,109(B6):B06307.
Kuang X X,Jiao J J. 2014. An integrated permeability-depth model for Earth’s crust[J]. Geophys Res Lett,41(21):7539–7545. doi: 10.1002/2014GL061999
Lee M,Liu T K,Ma K F,Chang Y M. 2002. Coseismic hydrological changes associated with dislocation of the September 21,1999 Chichi earthquake,Taiwan[J]. Geophys Res Lett,29(17):1824.
Manga M,Wang C Y. 2007. Pressurized oceans and the eruption of liquid water on Europa and Enceladus[J]. Geophys Res Lett,34(7):L07202.
McCormack K,Hesse M A,Dixon T,Malservisi R. 2020. Modeling the contribution of poroelastic deformation to postseismic geodetic signals[J]. Geophys Res Lett,47(8):e2020GL086945. doi: 10.1029/2020GL086945
Nespoli M, Belardinelli M E, Gualandi A, Serpelloni E, Bonafede M. 2018. Poroelasticity and fluid flow modeling for the 2012 Emilia-Romagna earthquakes: Hints from GPS and InSAR data[J/OL]. Geofluids, https://www.hindawi.com/journals/geofluids/aip/4160570/, doi: 10.1155/2018/4160570.
Panuntun H,Miyazaki S,Fukuda Y,Orihara Y. 2018. Probing the Poisson’s ratio of poroelastic rebound following the 2011 MW9.0 Tohoku earthquake[J]. Geophys J Int,215(3):2206–2221. doi: 10.1093/gji/ggy403
Panzera F,Zechar J D,Vogfjörd K S,Eberhard D A J. 2016. A revised earthquake catalogue for South Iceland[J]. Pure Appl Geophy,173(1):97–116. doi: 10.1007/s00024-015-1115-9
Pedersen R,Jónsson S,Árnadóttir T,Sigmundsson F,Feigl K L. 2003. Fault slip distribution of two June 2000 MW6.5 earthquakes in South Iceland estimated from joint inversion of InSAR and GPS measurements[J]. Earth Planet Sci Lett,213(3/4):487–502.
Rice J R,Cleary M P. 1976. Some basic stress diffusion solutions for fluid-saturated elastic porous media with compressible constituents[J]. Rev Geophys,14(2):227–241. doi: 10.1029/RG014i002p00227
Roeloffs E. 1996. Poroelastic techniques in the study of earthquake-related hydrologic phenomena[J]. Adv Geophys,37:135–195.
Stefansson R,Gudmundsson G B,Halldorsson P. 2008. Tjörnes fracture zone. New and old seismic evidences for the link between the North Iceland rift zone and the Mid-Atlantic ridge[J]. Tectonophysics,447(1/2/3/4):117–126.
Tung S,Masterlark T. 2018. Delayed poroelastic triggering of the 2016 October Visso earthquake by the AUGUST amatrice earthquake,Italy[J]. Geophys Res Lett,45(5):2221–2229. doi: 10.1002/2017GL076453
USGS. 2000. M6.5: 12 km ENE of Selfoss, Iceland[EB/OL]. [2022-04-08]. https://earthquake.usgs.gov/earthquakes/eventpage/usp0009ux8/moment-tensor.
Wakita H. 1975. Water wells as possible indicators of tectonic strain[J]. Science,189(4202):553–555. doi: 10.1126/science.189.4202.553
Walsh J B. 1981. Effect of pore pressure and confining pressure on fracture permeability[J]. Int J Rock Mech Min Sci Geomech Abstr,18(5):429–435. doi: 10.1016/0148-9062(81)90006-1
Wang K L,Hu Y,He J H. 2012. Deformation cycles of subduction earthquakes in a viscoelastic Earth[J]. Nature,484(7394):327–332. doi: 10.1038/nature11032
Wang R J,Kümpel H J. 2003. Poroelasticity:Efficient modeling of strongly coupled,slow deformation processes in a multilayered half-space[J]. Geophysics,68(2):705–717. doi: 10.1190/1.1567241
Wessel P,Luis J F,Uieda L,Scharroo R,Wobbe F,Smith W H F,Tian D. 2019. The generic mapping tools version 6[J]. Geochem Geophys Geosyst,20(11):5556–5564. doi: 10.1029/2019GC008515
Zhang Y,Wang C Y,Fu L Y,Yan R,Chen X Z. 2017. Mechanism of the coseismic change of volumetric strain in the far field of earthquakes[J]. Bull Seismol Soc Am,107(1):475–481. doi: 10.1785/0120160253
计量
- 文章访问数: 228
- HTML全文浏览量: 62
- PDF下载量: 71
