Curie depth in Greenland area
-
摘要: 基于全球磁异常数据,利用质心法计算格陵兰岛地区的居里面深度,并结合最新的热流资料、地壳结构和大洋年龄进行分析,加深了对研究区热结构的认识。首先,总结了磁性体满足不同分布时,居里面深度计算的理论公式和校正因子的选择。在格陵兰岛地区应用分形分布,结果表明,研究区居里面深度$ {h}_{{\rm{b}}} $在40 km以内,平均值约为20 km,估算误差约为2.7 km。校正$ {h}_{{\rm{b}}} $得到地形到居里面的距离$ {h}_{{\rm{m}}} $和沉积层底界面到居里面的距离$ {h}_{{\rm{c}}} $,并根据不同的地壳类型对地表实测热流数据校正得到$ {Q}_{{\rm{s}}} $。对比结果显示$ {h}_{{\rm{m}}} $与$ {Q}_{{\rm{s}}} $基本成负相关,计算结果合理。进一步分析表明,研究区居里面总体上浅于莫霍面,但在格陵兰岛北部部分区域居里面深于莫霍面,在大洋地区的$ {h}_{{\rm{c}}} $随洋壳年龄的增大而增大。Abstract: This paper estimates the Curie depth in Greenland area based on the global magnetic anomaly data by using the centroid method. For further analysis we introduce the latest heat flow data, crustal structure and ocean age, which helps to deepen the understanding of thermal structure in the studied area. When the magnetic body satisfies different distribution assumptions, the different theoretical formulas and correction factors for calculating the Curie depth are summarized. Among these distribution assumptions, we apply the fractal distribution assumption to the Greenland area. The result shows that the Curie depth ($ {h}_{{\rm{b}}} $) in the studied area is within 40 km, with an average depth of about 20 km and an estimation error of about 2.7 km. Based on $ {h}_{{\rm{b}}} $, we calculate the distance $ {h}_{{\rm{m}}} $ from topography to Curie depth and the distance $ {h}_{{\rm{c}}} $ from the top crystalline basement to Curie depth. Besides, we correct surface heat flow to obtain $ {Q}_{{\rm{s}}} $ according to different crustal types. We find that $ {Q}_{{\rm{s}}} $ is approximately inversely proportional to $ {h}_{{\rm{m}}} $, which proves that the result is reasonable. Further analysis shows that $ {h}_{{\rm{b}}} $ in the studied area is generally shallower than Moho depth, while in part of the northern Greenland, $ {h}_{{\rm{b}}} $ is deeper than Moho. In the ocean, $ {h}_{{\rm{c}}} $ increases with the age of the ocean crust.
-
Keywords:
- Greenland /
- Curie depth /
- the fractal distribution /
- geothermal heat flow
-
引言
格陵兰岛位于北美地区,北侧为北冰洋,西侧为巴芬湾、戴维斯海峡,西南方向与加拿大隔海相望,南侧为拉布拉多海,东侧为格陵兰海、丹麦海峡,东南方向与冰岛和欧洲大陆隔海相望。格陵兰岛80%的面积被冰雪覆盖,形成的格陵兰冰盖是地球上第二大淡水水库。格陵兰岛附近的海平面变化与沿海经济规划甚至人类生存息息相关,对于全球气候变化具有重要的指示意义(江伟伟等,2011)。由于岛上冰雪覆盖,冰盖之下的地形地貌和地质情况相对难以获得。前人对岛上地形地貌的研究表明,格陵兰岛冰盖之下存在一条从中部延伸至西北部的长750 km的大峡谷(Bamber et al,2013),岛西北部的冰层之下埋藏着一个直径约为31 km的撞击坑(MacGregor et al,2019)。冰雪覆盖进一步增加了地质研究的难度,该地区只有海岸线附近才能看到岩石露头,因此重、磁、热、地震等地球物理方法是揭示格陵兰岛地区地壳结构、岩石圈结构和热结构的有效手段。
前人对格陵兰岛地区的地壳和岩石圈结构作了大量研究。其中对莫霍面深度的研究表明:莫霍面在格陵兰岛内陆较深,约为35—50 km;在大陆边缘较浅,约为25—35 km;南部莫霍面较深,可达到55 km;北部莫霍面较浅,只有35 km;平均莫霍面深度约为40 km (Steffen et al,2017;Toyokuni et al,2020)。对于地壳结构,重力和地震给出的平均地壳厚度分别约为40 km和36 km,其中格陵兰岛东部的地壳最厚,中部的NW-SE一线上也存在厚地壳(Martos et al,2018)。对于岩石圈结构,格陵兰岛西南部岩石圈厚约200—270 km,向中部方向薄至180—190 km,NW-SE一带岩石圈异常薄,约100—120 km,可能标志着冰岛热点轨迹(Artemieva,2019)。
研究区的热结构,特别是格陵兰岛的热点迁移问题引起了众多学者的广泛讨论。有学者认为冰岛地幔柱在约80—20 Ma经过格陵兰板块,导致了该地区地热通量的变化(Rogozhina et al,2016),许多研究结果都验证了这一假设。例如,研究区存在岩石圈变薄和高密度镁铁物质的显著底侵,地震层析成像研究显示岛中部莫霍面上方存在一个细长的剪切波高速区,可能对应高密度区,地震波低速带则反映了冰岛地幔柱的余热(Martos et al,2018;Toyokuni et al,2020a,b)。居里面深度表示磁性层底部的深度,大致相当于580 ℃的等温线所在深度(Ross et al,2006),因此对于揭示区域地热构造具有重要意义。Martos等(2018)估计格陵兰岛居里面深度介于23—48 km之间,平均值为37 km;格陵兰岛西部、北部以及埃尔斯米尔岛的内部居里面最深,格陵兰岛东部向冰岛热点的方向居里面深度较浅。Lu等(2022)认为格陵兰岛北部的居里面深度大于30 km,南部约为20—30 km,巴芬湾约为18—37 km,扬马延岛微大陆的居里面比其周围洋盆更深。
因此,对格陵兰岛地区的居里面结构及其热状态的认识有待进一步深化。本文从全球磁异常数据出发,拟利用质心法计算格陵兰岛地区的居里面深度,并与最新的热流数据结合,以期给出整个格陵兰岛地区的热结构。
1. 地质和地球物理背景
格陵兰岛是一块存在了约40亿年的稳定陆地,主要由前寒武纪省组成,在早元古代发生碰撞,之后大陆几乎再未发生构造改造。格陵兰岛东侧为大西洋中脊(图1),自南向北分布着冰岛热点、扬马延岛热点和斯瓦尔巴群岛高地热地区,因此格陵兰岛地区的热结构引发了国内外学者的广泛讨论。
居里面深度表示磁性层底部的深度,这一深度大致相当于580 ℃的等温线,该温度也称为居里面温度,高于该温度,磁性材料将失去铁磁性,因此利用磁异常估算居里面深度能够独立揭示区域地热构造。本研究使用的磁异常数据来源于EMAG2 (Earth Magnetic Anomaly Grid 2-arc-minute resolution)(Maus et al,2009),磁异常分布如图2所示,数据分辨率为2弧分,观测面位于大地水准面之上4 km。
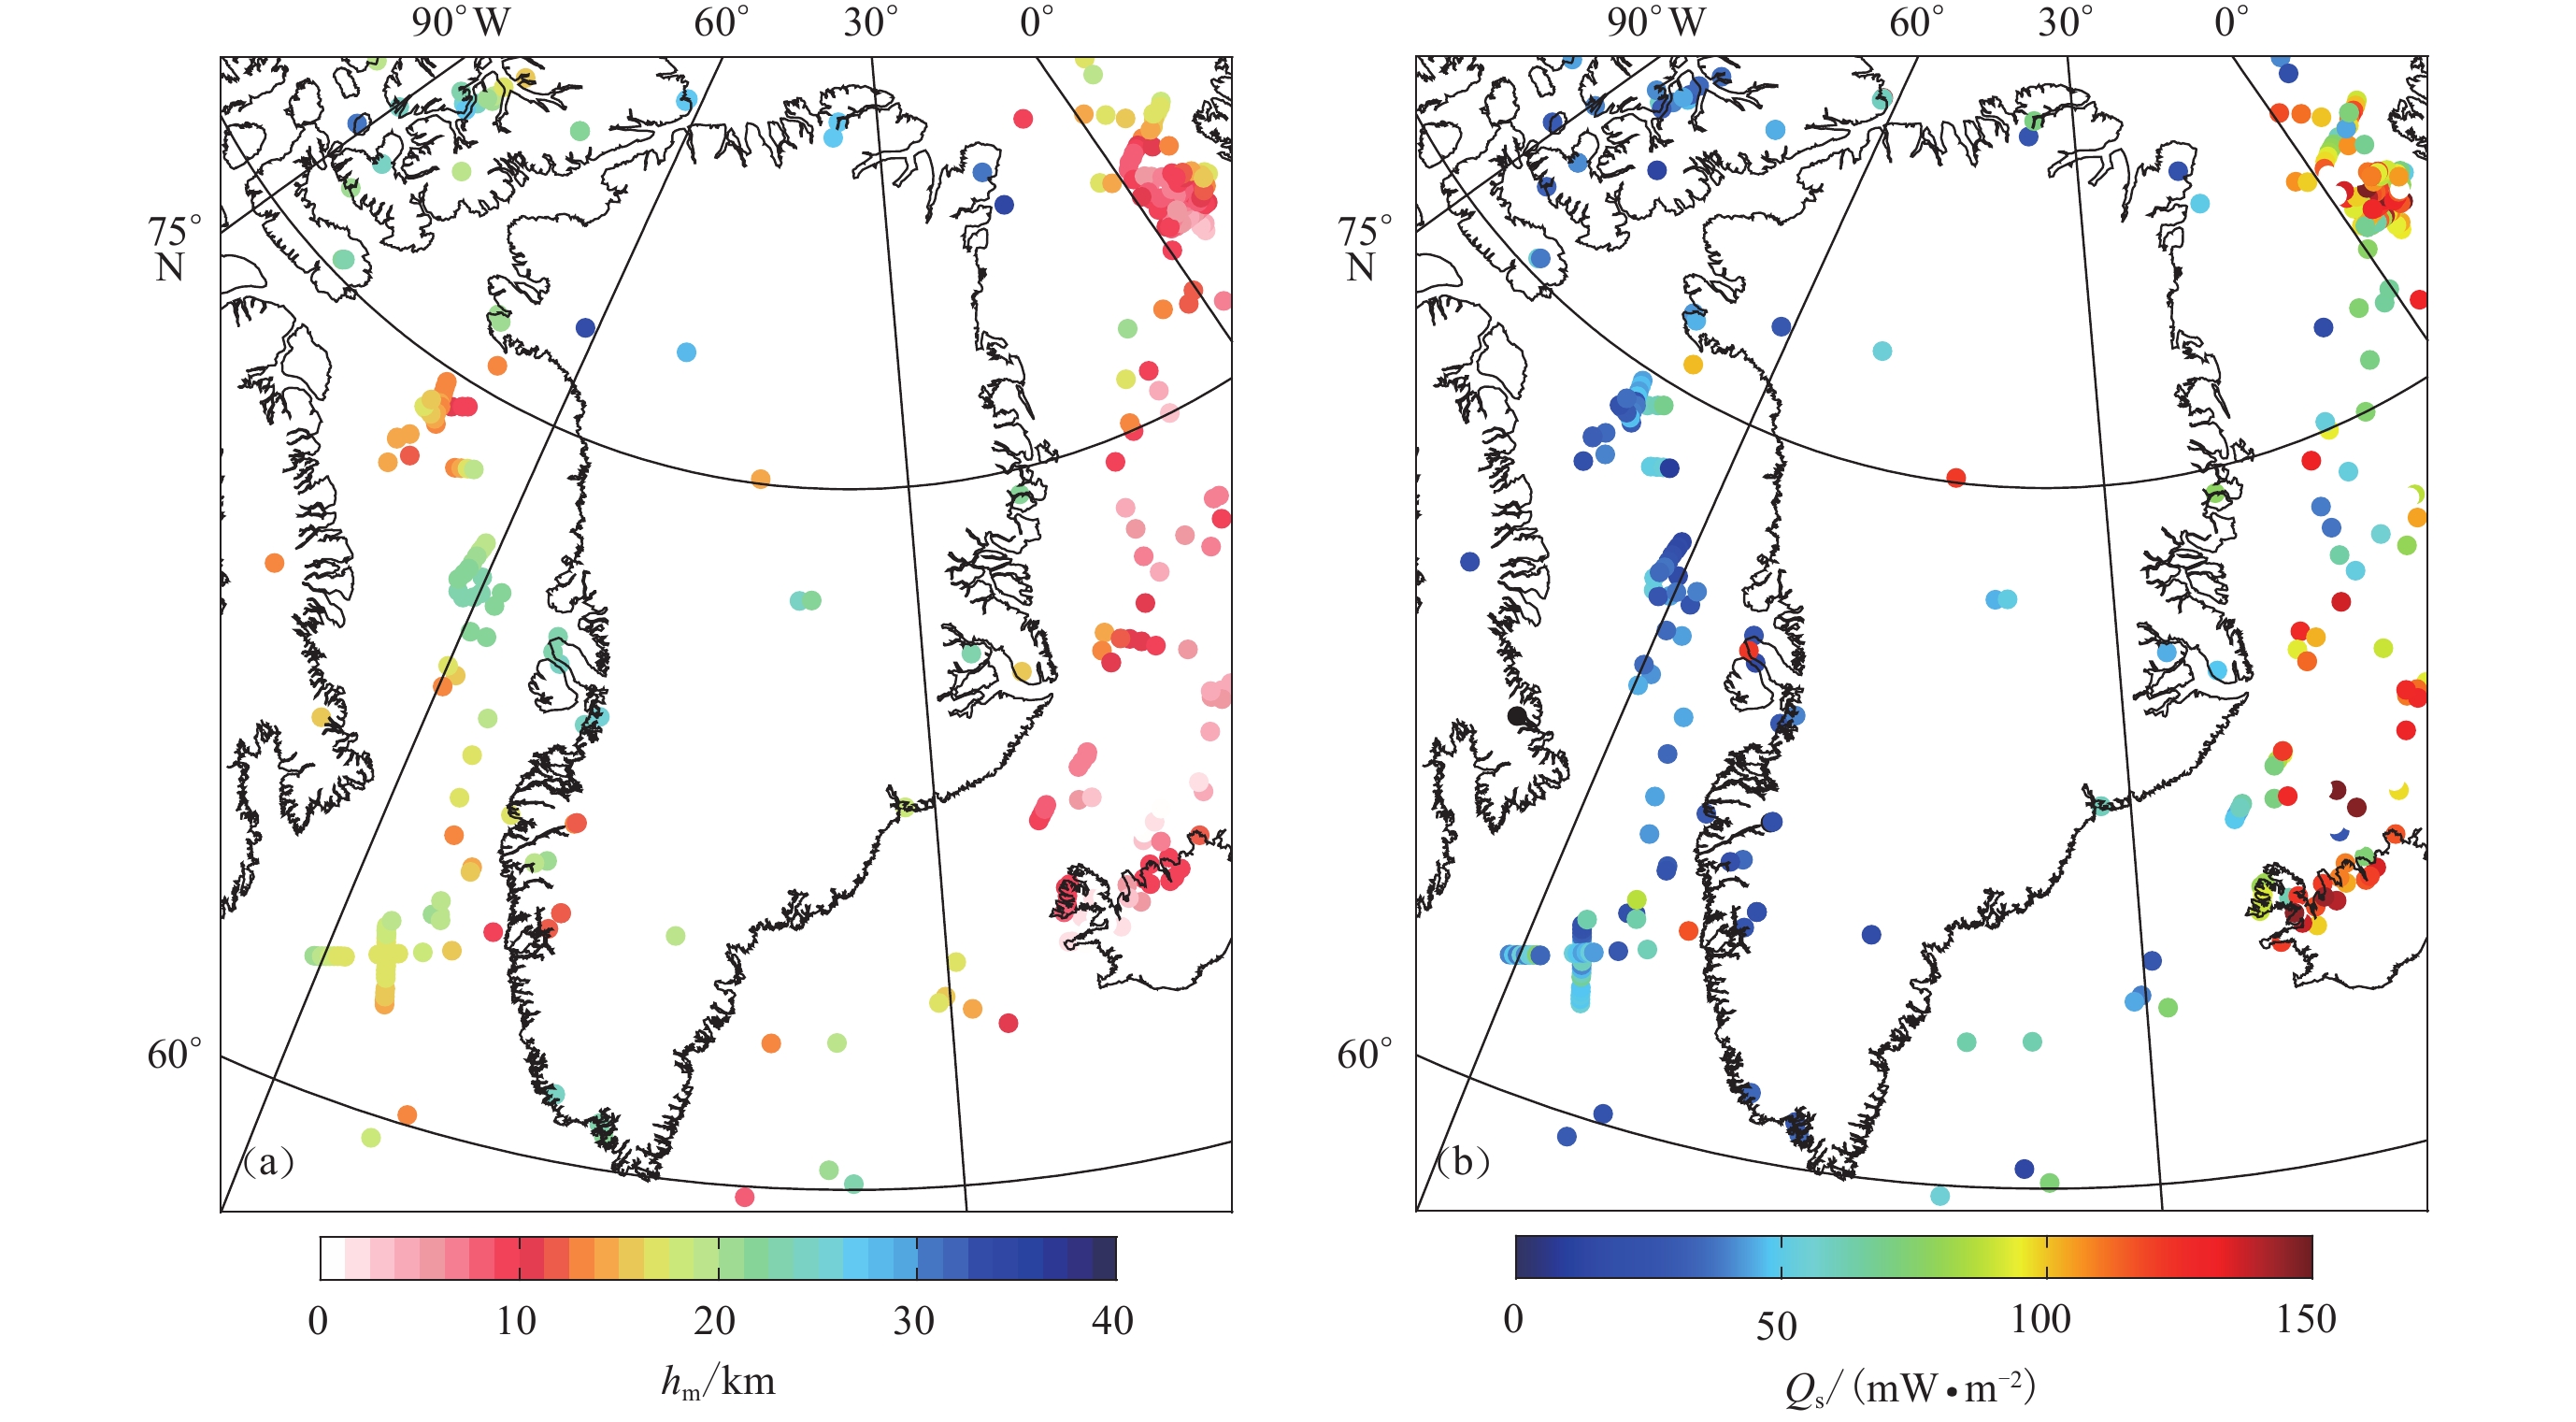
此外,可靠的热流测量数据是约束岩石圈热结构的重要依据,而格陵兰岛大陆被冰层覆盖,因此几乎没有热流观测数据,现有的测量数据主要集中在活动的海洋盆地。面对这一问题,不同学者给出了利用已有数据求解热流值的方法。Martos等(2018)基于全球磁异常数据,利用谱分析和求解热传导方程的方法计算格陵兰岛热流值及其不确定性,给出的热流值变化范围为50—75 mW/m2,平均值为60 mW/m2,东格陵兰岛显示高热流值,西格陵兰岛显示低热流值。Artemieva (2019)结合地震、地形和冰厚数据计算得到的格陵兰岛西南部热流值约为40 mW/m2,NW-SE带的热流值约为60—70 mW/m2,东格陵兰岛热流值大于100 mW/m2。Colgan等(2022)整理了格陵兰岛所有可获得的热流测量数据共419个(图3a),其中海上热流数据317个,陆上热流数据102个,按照数据来源,其中290个为2018年国际热流协会已发表的数据,129个为新整理的数据。基于上述热流测量数据,并结合其它地球物理数据集,Colgan等(2022)使用机器学习方法得到了格陵兰岛及其周围区域的热流图(图3b)。本文使用这一最新热流数据集结合居里面深度计算结果分析格陵兰岛地区的热结构。
![]() 图 3 研究区热流实测数据(a)和机器学习预测数据(b)(数据来源于Colgan et al,2022)Figure 3. Geothermal heat flux in the studied area by measuring (a) and predicting using machine learning method (b)(data from Colgan et al,2022)
图 3 研究区热流实测数据(a)和机器学习预测数据(b)(数据来源于Colgan et al,2022)Figure 3. Geothermal heat flux in the studied area by measuring (a) and predicting using machine learning method (b)(data from Colgan et al,2022)2. 研究方法
计算居里面深度时,通常需要假设磁性体场源满足特定的磁化分布,从而使用相应的理论计算公式,计算方法包括质心法、谱峰法、非线性参数估计法等(Kelemework et al,2021)。本文使用最常用的质心法,假设磁性体场源满足分形分布,则磁异常总场$ \Delta T $的径向平均功率谱$ {A}_{\Delta T} $的对数可以写为
$$ \ln {A_{\Delta T}} = {C_1} - \left| {2\pi k} \right|{h_{\rm{t}}} + \ln {\left| {2\pi k} \right|^{ - \frac{{\beta - 1}}{2}}} + \ln \{ {1 - {{{{\rm{exp}}}} [ { - \left| {2\pi k} \right| ( {{h_{\rm{b}}} - {h_{\rm{t}}}} ) }}} ] \} \text{,} $$ (1) 式中,$ {C}_{1} $为常数,$ k $为波数,$ {h}_{\mathrm{t}}\mathrm{和}{h}_{\mathrm{b}} $分别为磁性体的顶、底界面深度,$ \;\beta $为分形校正因子。对于各向同性的3-D分形磁化强度分布,在波长小于大约两倍的磁性层厚度(中到高波数)时,式(1)简化为
$$ \ln ( {{{\left| {2\pi k} \right|}^{\frac{{\beta - 1}}{2}}}{A_{\Delta T}}} ) {\text{≈}} {C_2} - \left| {2\pi k} \right|{h_{\rm{t}}} \text{,} $$ (2) 在低波数时,式(1)则简化为
$$ \ln ( {{{\left| {2\pi k} \right|}^{\frac{{\beta - 3}}{2}}}{A_{\Delta T}}} ) {\text{≈}} {C_3} - \left| {2\pi k} \right|{h_0}, $$ (3) 式中,$ {C}_{2}和{C}_{3} $为常数,$ {h}_{0} $为磁性层的质心深度。
根据上述径向平均功率谱的对数表达式可以看出,磁性体的顶界面深度和质心深度均可以表示为磁异常总场$\Delta T$的径向平均功率谱对数与波数的线性回归,因此由磁异常功率谱斜率可分别求出场源的顶界面深度$ {h}_{\mathrm{t}} $和质心深度$ {h}_{0} $,再利用$ {h}_{\mathrm{b}}=2{h}_{0}-{h}_{\mathrm{t}} $求出场源的底界面深度。同样地,$ {h}_{\mathrm{b}} $的误差使用$ \delta =2{\delta }_{{h}_{0}}-{\delta }_{{h}_{\mathrm{t}}} $计算得到,其中$ {\delta }_{{h}_{0}} $和$ {\delta }_{{h}_{\mathrm{t}}} $分别为$ {h}_{0}\mathrm{和}{h}_{\mathrm{t}} $的数据拟合误差。
除了假设磁性体场源满足分形分布之外,还可以假设场源满足随机不相关分布或者统计分布(Kelemework et al,2021)。经过整理发现,不同的磁化分布假设实际上具有相同形式的理论计算公式,只是需要对$ {A}_{\Delta T} $作不同形式的校正,即选择不同的$ \;\beta $:随机不相关分布假设$ \;\beta =1 $,统计分布假设$ \;\beta =3.9 $,分形分布假设$\;\beta \in [ \mathrm{3,5} ] $。其中,在分形磁化强度分布假设下,$ \;\beta $可以选择常数,也可以基于数值迭代求解,但是变化的校正因子通常导致过校正(Li et al,2019),常数校正因子虽然会给居里面深度的估计带来额外的误差,但是在相似的地质单元中,一般不会有太大的变化,因此本文对$ \;\beta $取常数。
具体计算时,使用滑动窗口法,根据每一个窗口内的磁异常径向功率谱计算居里面深度。窗口大小的选择也很重要,由于理论模型在水平方向无限延伸,因此窗口过小会限制窗口内可以捕获的最大波长,窗口过大则会导致不同构造单元的效应混淆在一起,造成结果分辨率低。一般来说,窗口大小可以取50—200 km。此外,为了减小窗口尺寸大小的影响、压制随机噪声同时提高分辨率,可以选择对不同大小窗口的结果取平均(Li et al,2013)。
本文计算居里面深度的算法流程如下:① 输入磁异常数据$ \Delta T $,使用滑动窗口分割数据,每一个滑动窗口内的磁异常数据记为$ \Delta {T}_{\mathrm{w}\mathrm{i}\mathrm{n}} $;② 对$ \Delta {T}_{\mathrm{w}\mathrm{i}\mathrm{n}} $作傅里叶变换得到径向平均功率谱,结果记为$ {A}_{\Delta T} $;③ 对$ {A}_{\Delta T} $作分形校正并取对数,得到结果$ \mathrm{l}\mathrm{n} ( |2\mathrm{\pi }{k|}^{\frac{\beta -1}{2}}{A}_{\Delta T} ) $和$ \mathrm{l}\mathrm{n} ( |2\mathrm{\pi }{k|}^{\frac{\beta -3}{2}}{A}_{\Delta T} ) $,分别用于求取$ {h}_{\mathrm{t}} $和$ {h}_{0} $;④ 将位于同一波数段(波数段宽度取$ {k}_{\mathrm{b}\mathrm{i}\mathrm{n}} $)的数据归为一组,用这组数据的均值代表该波数段,即可绘制散点图;⑤ 对高波数段和低波数段的频谱数据作线性拟合,斜率分别为$ {h}_{\mathrm{t}} $和$ {h}_{0} $,数据拟合误差分别为$ {\delta }_{{h}_{\mathrm{t}}} $和$ {\delta }_{{h}_{0}} $,可相应计算得到$ {h}_{\mathrm{b}} $与误差$ \delta $,并将结果作为该窗口中心点的结果;⑥ 所有滑动窗口内的磁异常数据完成上述2—5步计算。
3. 计算结果及分析
3.1 计算结果
截取研究区磁异常数据并投影到笛卡尔坐标系,通过质心法计算每一个滑动窗口内的居里面深度,选择窗口大小200 km,步长100 km,分形校正因子$ \;\beta =3 $,波数段宽度${k}_{\mathrm{b}\mathrm{i}\mathrm{n}} 0.006\;\mathrm{k}{\mathrm{m}}^{-1}$,磁性体的顶界面和质心深度的拟合波数段分别为0.039—0.081 km−1和0.003—0.033 km−1。某一滑动窗口内磁异常径向平均功率谱对数与波数的线性拟合情况如图4所示,其中图4a和4b分别为高波数段和低波数段拟合所得顶界面深度和质心深度的示例。
最终计算得到格陵兰岛地区的居里面深度(图5a)和估算误差(图5b)。结果表明,研究区居里面深度在40 km以内,平均值约为20 km,估算误差平均值约为2.7 km。总体分布呈现出,大陆地区居里面深度大,大洋地区居里面深度浅,其中格陵兰岛北部的居里面最深,岛南部居里面较浅,在大洋盆地中,随着海洋岩石圈的冷却,居里面深度总体上在远离洋中脊的地方加深,洋中脊位置居里面深度最浅。
3.2 居里面深度校正
将$ {h}_{\mathrm{b}} $与实测的地表热流$ {q}_{\mathrm{s}} $结合可以约束磁性层的地温梯度和热导率,同时检验结果的合理性。但是使用频谱分析方法得到的居里面深度$ {h}_{\mathrm{b}} $是从大地水准面开始计算的,而地表热流值的观测面是地形,因此本文将地形与居里面之间的距离记为$ {h}_{\mathrm{m}} $,对比$ {h}_{\mathrm{m}} $与地表热流的关系。此外,在大洋地区,居里面深度$ {h}_{\mathrm{b}} $与沉积层厚度$ {T}_{\mathrm{s}\mathrm{e}\mathrm{d}} $有关,为了消除沉积层的影响,将从沉积层底界面到居里面的距离记为$ {h}_{\mathrm{c}} $,之后比较$ {h}_{\mathrm{c}} $与大洋年龄的关系。$ {h}_{\mathrm{b}},{h}_{\mathrm{m}},{h}_{\mathrm{c}} $之间的关系如下:
$$ {h_{\rm{m}}} = {h_{\rm{b}}} + {h_{{\rm{topo}}}} , {h_{\rm{c}}} = {h_{\rm{m}}} - {T_{{\rm{sed}}}} \text{,} $$ (4) 式中:${h}_{{\rm{b}}}$为频谱分析法计算得到的居里面深度,向下为正;$ {h}_{t\mathrm{o}\mathrm{p}\mathrm{o}} $为地形高度,在陆区为正,在海区为负,地形数据来源于ETOPO1 (Amante,Eakins,2009),如图1所示;$ {T}_{\mathrm{s}\mathrm{e}\mathrm{d}} $为海洋沉积层厚度。陆地与大洋地区的地层层位结构如图6所示。对居里面深度进行校正后,计算得到的$ {h}_{\mathrm{m}} $如图7a所示。
3.3 与热流数据相关性分析
在分析$ {h}_{\mathrm{m}} $与地表热流$ {q}_{\mathrm{s}} $相关性之前,本文根据海洋与陆地这两种不同的地壳类型对地表热流测量值进行了校正,最终分析$ {h}_{\mathrm{m}} $与校正后的热流数据$ {Q}_{\mathrm{s}} $的相关性。假设放射性产热随深度呈指数递减,稳态热传导方程为:
$$ K\frac{{{{\rm{d}}^2}T}}{{{\rm{d}}{h^2}}} = - {H_0}{{\rm{exp}}\left(-{\frac { h}{h_{\rm{r}}}}\right)} \text{,} $$ (5) 式中,K为磁性层的体积平均垂直热导率,T为温度,dT/dh为地温梯度,$ {H}_{0} $为地表体积放射性生热率,h为距离地表的深度,向下为正,$ {h}_{r} $为体积生热率减少的特征长度。
根据边界条件$T ( h=0 ) ={T}_{0}$和$T ( h={h}_{{\rm{m}}} ) ={T}_{{\rm{c}}}$求解式(5)可得:
$$ T ( h ) = {T_0} + \frac{{{T_{\rm{c}}} - {T_0}}}{{{h_{\rm{m}}}}}h + \frac{{h_{\rm{r}}^2{H_0}}}{k}\left( {\frac{{{{\rm{exp}}\left({ - \dfrac{{h_{\rm{m}}}}{h_{\rm{r}}}}\right)} - 1}}{{{h_{\rm{m}}}}}h - {{\rm{exp}}\left({ -\frac{ h}{h_{\rm{r}}}}\right)} + 1} \right) \text{,} $$ (6) 式中,$ {T}_{0} $和${T}_{{\rm{c}}}$分别为$ h=0 $和h=${h}_{\mathrm{m}} $处的温度,为了考虑地形起伏的影响,上式中使用从地形到居里面的深度$ {h}_{\mathrm{m}} $,因为相较$ {h}_{\mathrm{b}} $,$ {h}_{\mathrm{m}} $更适合描述磁层厚度(Lu et al,2022)。
由热传导的傅里叶定律,可以得到地表热流$ {q}_{{\rm{s}}} $:
$$ {q_{\rm{s}}} = K\frac{{{\rm{d}}T ( h ) }}{{{\rm{d}}h}}\left| \begin{gathered} \\ h = 0 \\ \end{gathered} \right. = K\frac{{{T_{\rm{c}}} - {T_0}}}{{{h_{\rm{m}}}}} + {h_{\rm{r}}}{H_0}\left( {\frac{{{h_{\rm{r}}}}}{{{h_{\rm{m}}}}}{{\rm{exp}}\left({ -\frac {h_{\rm{m}}}{h_{\rm{r}}}}\right)} - \frac{{{h_{\rm{r}}}}}{{{h_{\rm{m}}}}} + 1} \right) ,$$ (7) 式中右边第一项为背景热流,第二项为居里面以上磁性层内部的放射性产热。式中$ {h}_{\mathrm{r}} $,$ {H}_{0} $和$ {h}_{\mathrm{m}} $为变量,通常将$ {h}_{\mathrm{r}} $设置为10 km,$ {H}_{0} $在大陆取$2.6\;{\text{µ}}\mathrm{W}/{\mathrm{m}}^{3}$,在大洋取$1.6\;{\text{µ}}\mathrm{W}/{\mathrm{m}}^{3}$ (Lu et al,2022)。
校正之后的热流数据$ {Q}_{\mathrm{s}} $与$ {h}_{\mathrm{m}} $之间的相关性为
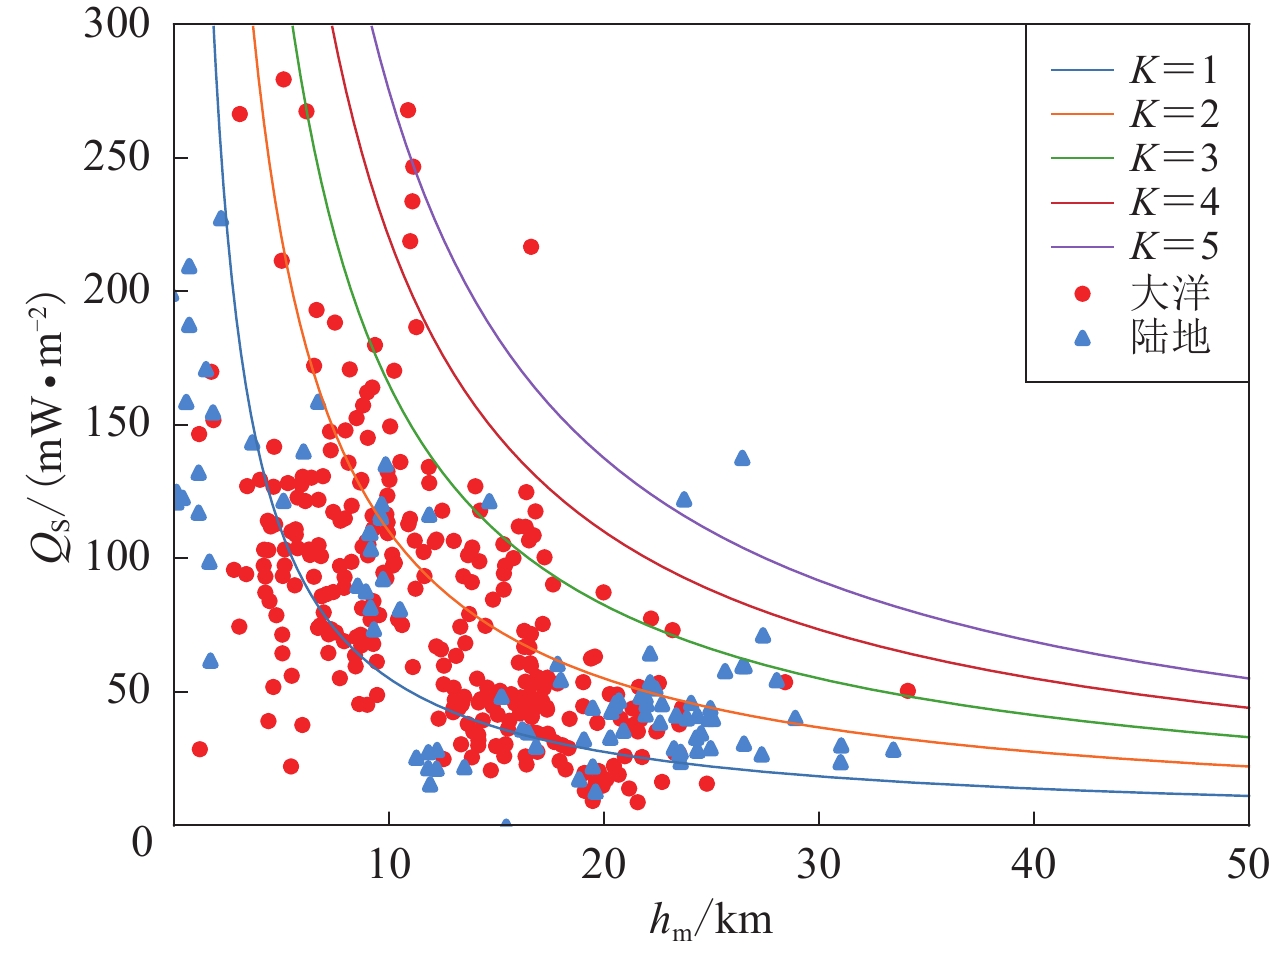
$$ {Q_{\rm{s}}} = {q_{\rm{s}}} - {h_{\rm{r}}}{H_0}\left( {\frac{{{h_{\rm{r}}}}}{{{h_{\rm{m}}}}}{{\rm{exp}}\left({ -\frac {h_{\rm{m}}}{h_{\rm{r}}}}\right)} - \frac{{{h_{\rm{r}}}}}{{{h_{\rm{m}}}}} + 1} \right) = k\frac{{{T_{\rm{c}}} - {T_0}}}{{{h_{\rm{m}}}}} {\text{.}} $$ (8) 热流数据$ {Q}_{\mathrm{s}} $的计算结果如图7b所示。取$ {T}_{{\rm{c}}}-{T}_{0}=550$ ℃,K=1—5 W/(m·℃)计算Qs-hm的理论曲线,如图8中曲线所示,Qs-hm的相关性如图8中散点所示。可以看到,居里面深度$ {h}_{\mathrm{m}} $与大地热流值$ {Q}_{\mathrm{s}} $具有反比关系,即居里面浅,热流值高,居里面深,热流值低,数据点主要集中在$ K=1 $和$ K=3 $之间,与该地区实测热导率数据范围基本一致。
3.4 与地壳结构和洋壳年龄的对比分析
除了与热流数据作相关性分析之外,本文进一步将计算得到的居里面深度与该区域的地壳结构和大洋地壳年龄作对比分析。
首先,研究区的莫霍面深度如图9a所示,可以看到:格陵兰岛南部莫霍面较深,可达50 km以上;岛北部莫霍面较浅,只有30 km左右;在海洋地区莫霍面深度浅于格陵兰岛。根据格陵兰岛地区的居里面深度$ {h}_{\mathrm{b}} $(图5a)可以看出:研究区南部居里面较浅,大约20 km;岛北部居里面较深,可达到40 km;海洋地区的居里面深度浅于格陵兰岛。总体来看,研究区的居里面浅于莫霍面,但在格陵兰岛北部小范围区域居里面深于莫霍面。
![]() 图 9 研究区居里面深度与地壳结构和洋壳年龄的对比分析(a) 莫霍面深度(数据来源于Steffen et al,2017);(b) 沉积层厚度(数据来源于Straume et al,2019);(c) 沉积层底界面到居里面的距离$ {h}_{\mathrm{c}} $;(d) 大洋地壳年龄(数据来源于Seton et al,2020)Figure 9. Analysis of Curie depth with crustal structure and ocean crustal age in the studied area(a) Moho depth (data from Steffen et al,2017);(b) Sediment thickness (data from Straume et al,2019);(c) The distance from the top crystalline basement to Curie depth $ {h}_{\mathrm{c}} $; (d) Ocean crustal age (data from Seton et al,2020)
图 9 研究区居里面深度与地壳结构和洋壳年龄的对比分析(a) 莫霍面深度(数据来源于Steffen et al,2017);(b) 沉积层厚度(数据来源于Straume et al,2019);(c) 沉积层底界面到居里面的距离$ {h}_{\mathrm{c}} $;(d) 大洋地壳年龄(数据来源于Seton et al,2020)Figure 9. Analysis of Curie depth with crustal structure and ocean crustal age in the studied area(a) Moho depth (data from Steffen et al,2017);(b) Sediment thickness (data from Straume et al,2019);(c) The distance from the top crystalline basement to Curie depth $ {h}_{\mathrm{c}} $; (d) Ocean crustal age (data from Seton et al,2020)本文还比较了从沉积层底界面到居里面的距离hc与大洋地壳年龄的关系。居里面深度校正使用的大洋沉积层数据来源于GlobSed (Straume et al,2019),如图9b所示,校正得到的从沉积层底界面到居里面的距离hc如图9c所示,大洋地壳年龄如图9d所示。可以看出,总体上$ {h}_{\mathrm{c}} $随洋壳年龄的增大而增大,且去除了沉积层的影响之后,$ {h}_{\mathrm{c}} $与洋壳年龄的相关性更好。具体来说,在洋中脊处,洋壳年龄最小,热流值最高(图3b),相应地$ {h}_{\mathrm{c}} $也最浅,随着距离洋中脊越远,洋壳年龄越大,热流值越小,$ {h}_{\mathrm{c}} $则越大,$ {h}_{\mathrm{c}} $与洋壳年龄的这一对应关系在格陵兰岛东西侧的大洋中均有较好的体现。
4. 结论
本文使用质心法计算格陵兰岛地区的居里面深度并与最新的热流数据、研究区的地壳结构、洋壳年龄结合分析,加深了对格陵兰岛地区热结构的认识。本文总结发现磁性体满足不同分布假设时具有相同形式的理论计算公式,但是需要选取不同的校正因子$ \;\beta $,磁性体满足随机不相关分布、统计分布、分形分布假设时对应的校正因子分别为1,3.9, [ 3,5 ] 。本文基于分形分布假设,使用全球磁异常数据计算格陵兰岛地区的居里面深度,结果表明,研究区居里面深度在40 km以内,平均值约为20 km,估算误差约为2.7 km。此外,地形到居里面的距离$ {h}_{\mathrm{m}} $与校正后的地表热流$ {Q}_{\mathrm{s}} $相关性较好,证明了本文计算结果的合理性。进一步将计算得到的居里面深度与该区域的地壳结构和洋壳年龄作对比分析,结果表明研究区的居里面总体上浅于莫霍面,但在格陵兰岛北部小范围区域存在居里面深于莫霍面。在大洋地区,沉积层底界面到居里面的距离$ {h}_{\mathrm{c}} $随洋壳年龄的增大而增大,与热流值也有很好的对应关系。
审稿专家在文章撰写过程中提出了宝贵意见,中国科学院地质与地球物理研究所董淼博士针对本文内容与作者进行了有益讨论,作者在此一并表示感谢。
-
图 3 研究区热流实测数据(a)和机器学习预测数据(b)(数据来源于Colgan et al,2022)
Figure 3. Geothermal heat flux in the studied area by measuring (a) and predicting using machine learning method (b)(data from Colgan et al,2022)
图 9 研究区居里面深度与地壳结构和洋壳年龄的对比分析
(a) 莫霍面深度(数据来源于Steffen et al,2017);(b) 沉积层厚度(数据来源于Straume et al,2019);(c) 沉积层底界面到居里面的距离$ {h}_{\mathrm{c}} $;(d) 大洋地壳年龄(数据来源于Seton et al,2020)
Figure 9. Analysis of Curie depth with crustal structure and ocean crustal age in the studied area
(a) Moho depth (data from Steffen et al,2017);(b) Sediment thickness (data from Straume et al,2019);(c) The distance from the top crystalline basement to Curie depth $ {h}_{\mathrm{c}} $; (d) Ocean crustal age (data from Seton et al,2020)
-
江伟伟,李磊,王春晖,杜凌. 2011. 格陵兰岛附近海域海平面变化的初步研究[J]. 中国海洋大学学报,41(10):10–16. Jiang W W,Li L,Wang C H,Du L. 2011. A preliminary analysis on sea level change in the seas near the Greenland[J]. Periodical of Ocean University of China,41(10):10–16 (in Chinese).
Amante C, Eakins B W. 2009. ETOPO1 1 Arc-Minute Global Relief Model: Procedures, Data Sources and Analysis[R]. NOAA Technical Memorandum Nesdis NDGC-24, Boulder: NOAA.
Artemieva I M. 2019. Lithosphere thermal thickness and geothermal heat flux in Greenland from a new thermal isostasy method[J]. Earth-Sci Rev,188:469–481. doi: 10.1016/j.earscirev.2018.10.015
Bamber J L,Siegert M J,Griggs J A,Marshall S J,Spada G. 2013. Paleofluvial mega-canyon beneath the central Greenland ice sheet[J]. Science,341(6149):997–999. doi: 10.1126/science.1239794
Colgan W,Wansing A,Mankoff K,Lösing M,Hopper J,Louden K,Ebbing J,Christiansen F G,Ingeman-Nielsen T,Liljedahl L C,MacGregor J A,Hjartarson Á,Bernstein S,Karlsson N B,Fuchs S,Hartikainen J,Liakka J,Fausto R,Dahl-Jensen D,Bjørk A,Naslund J O,Mørk F,Martos Y,Balling N,Funck T,Kjeldsen K K,Petersen D,Gregersen U,Dam G,Nielsen T,Khan A,Løkkegaard A. 2022. Greenland geothermal heat flow database and map (Version 1)[J]. Earth Syst Sci Data,14(5):2209–2238. doi: 10.5194/essd-14-2209-2022
Kelemework Y,Fedi M,Milano M. 2021. A review of spectral analysis of magnetic data for depth estimation[J]. Geophysics,86(6):J33–J58. doi: 10.1190/geo2020-0268.1
Li C F,Wang J,Lin J,Wang T T. 2013. Thermal evolution of the North Atlantic lithosphere:New constraints from magnetic anomaly inversion with a fractal magnetization model[J]. Geochem Geophys Geosyst,14(12):5078–5105. doi: 10.1002/2013GC004896
Li C F,Zhou D,Wang J. 2019. On application of fractal magnetization in Curie depth estimation from magnetic anomalies[J]. Acta Geophys,67(5):1319–1327. doi: 10.1007/s11600-019-00339-6
Lu Y,Li C F,Wang J,Wan X L. 2022. Arctic geothermal structures inferred from Curie-point depths and their geodynamic implications[J]. Tectonophysics,822:229158. doi: 10.1016/j.tecto.2021.229158
MacGregor J A,Bottke Jr W F,Fahnestock M A,Harbeck J P,Kjær K H,Paden J D,Stillman D E,Studinger M. 2019. A possible second large subglacial impact crater in northwest Greenland[J]. Geophys Res Lett,46(3):1496–1504. doi: 10.1029/2018GL078126
Martos Y M,Jordan T A,Catalán M,Jordan T M,Bamber J L,Vaughan D G. 2018. Geothermal heat flux reveals the iceland hotspot track underneath Greenland[J]. Geophys Res Lett,45(16):8214–8222. doi: 10.1029/2018GL078289
Maus S,Barckhausen U,Berkenbosch H,Bournas N,Brozena J,Childers V,Dostaler F,Fairhead J D,Finn C,von Frese R R B,Gaina C,Golynsky S,Kucks R,Lühr H,Milligan P,Mogren S,Müller R D,Olesen O,Pilkington M,Saltus R,Schreckenberger B,Thébault E,Caratori Tontini F. 2009. EMAG2:A 2–arc min resolution Earth Magnetic Anomaly Grid compiled from satellite,airborne,and marine magnetic measurements[J]. Geochem Geophys Geosyst,10(8):Q08005.
Rogozhina I,Petrunin A G,Vaughan A P M,Steinberger B,Johnson J V,Kaban M K,Calov R,Rickers F,Thomas M,Koulakov I. 2016. Melting at the base of the Greenland ice sheet explained by Iceland hotspot history[J]. Nat Geosci,9(5):366–369. doi: 10.1038/ngeo2689
Ross H E,Blakely R J,Zoback M D. 2006. Testing the use of aeromagnetic data for the determination of Curie depth in California[J]. Geophysics,71(5):L51–L59. doi: 10.1190/1.2335572
Seton M,Müller R D,Zahirovic S,Williams S,Wright N W,Cannon J,Whittaker J M,Matthews K J,McGirr R. 2020. A global data set of present-day oceanic crustal age and seafloor spreading parameters[J]. Geochem Geophys Geosyst,21(10):e2020GC009214.
Steffen R,Strykowski G,Lund B. 2017. High-resolution Moho model for Greenland from EIGEN-6C4 gravity data[J]. Tectonophysics,706/707:206–220. doi: 10.1016/j.tecto.2017.04.014
Straume E O,Gaina C,Medvedev S,Hochmuth K,Gohl K,Whittaker J M,Abdul Fattah R,Doornenbal J C,Hopper J R. 2019. GlobSed:Updated total sediment thickness in the world’s oceans[J]. Geochem Geophys Geosyst,20(4):1756–1772. doi: 10.1029/2018GC008115
Toyokuni G,Matsuno T,Zhao D P. 2020a. P wave tomography beneath Greenland and surrounding regions 1:Crust and upper mantle[J]. J Geophys Res:Solid Earth,125(12):e2020JB019837.
Toyokuni G,Matsuno T,Zhao D P. 2020b. P wave tomography beneath Greenland and surrounding regions 2:Lower mantle[J]. J Geophys Res:Solid Earth,125(12):e2020JB019839.


 下载:
下载:


