

Relative motions between cross-fault sites resultd from the 1999 MW7.6 Taiwan Chi-Chi earthquake
-
摘要:
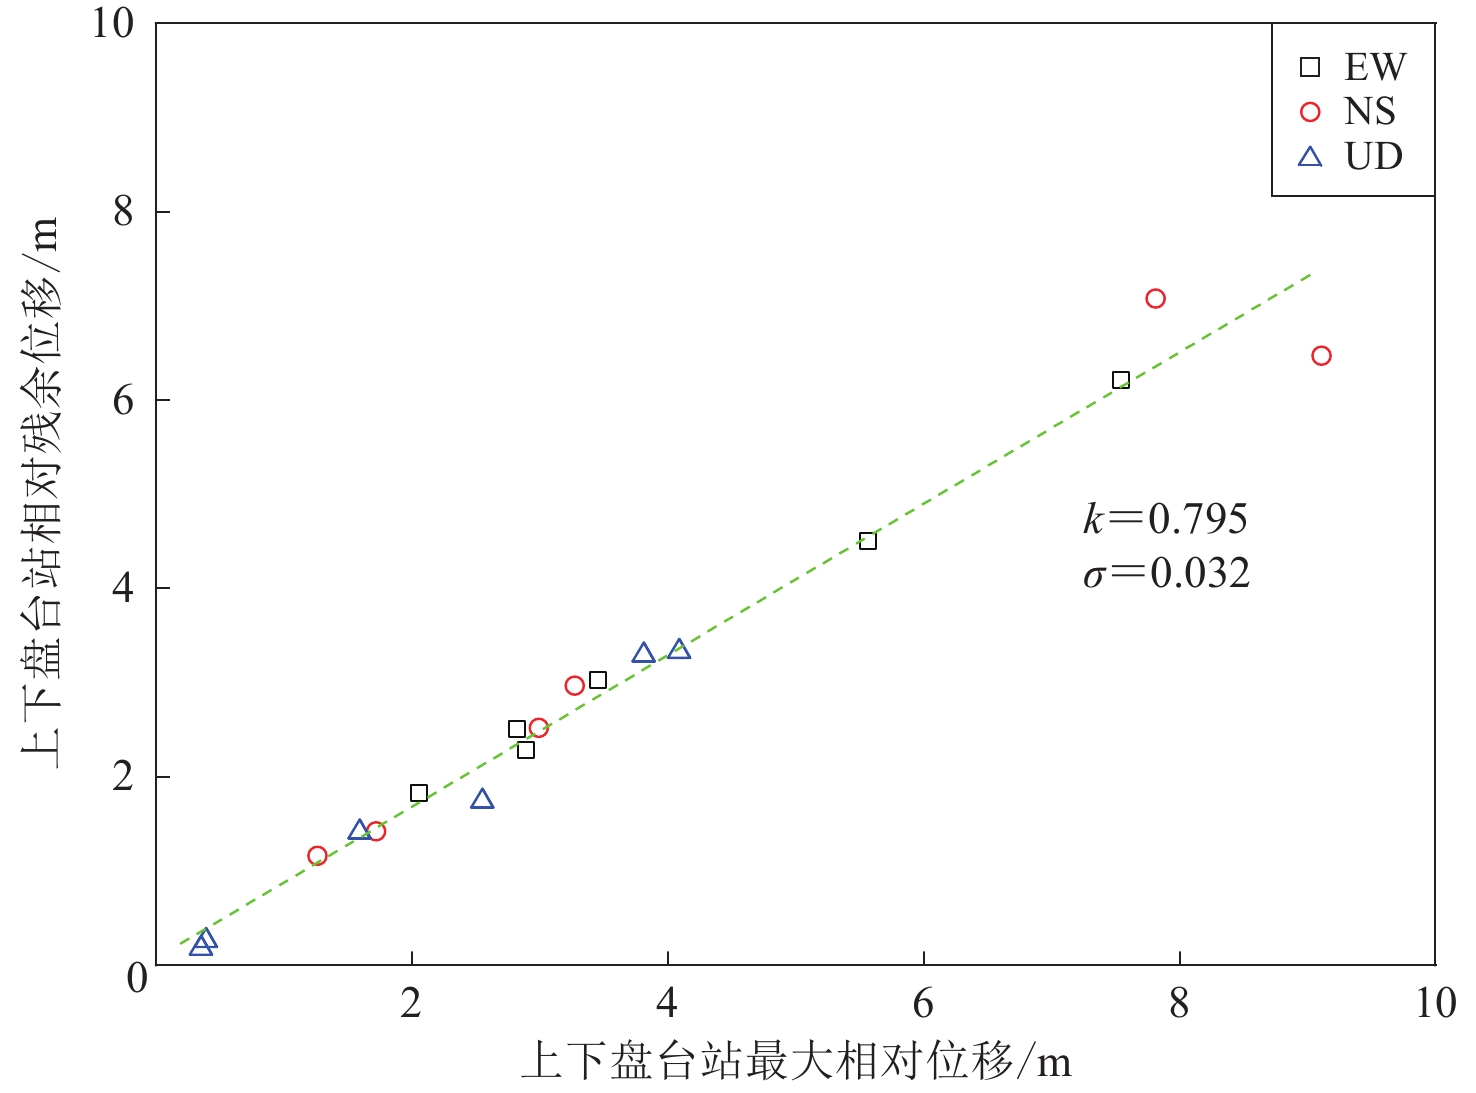
为了获得近断层地震动准确的残余位移信息,提出了一种变步长网格搜索地震动基线校正方法。首先基于1999年我国台湾MW7.6集集地震强震动数据,探讨了近断层地震动的位移特征,然后通过地震动时程初始时刻的校正获得了集集地震多组上、下盘台站之间的相对运动时程数据,分析了分别靠近断层上、下盘场地之间相对运动的位移时程特征。结果显示:近断层地震动的滑冲效应显著,断层的平均滑冲速度可高达1.4 m/s;断层两盘间的相对运动类似于近断层地震动的运动特征,且幅值更大;近断层的残余位移约是断层两盘间最大相对位移的80%.
-
关键词:
- 1999年集集MW7.6地震 /
- 近断层地震动 /
- 跨断层场地 /
- 相对运动 /
- 断层作用
Abstract:In order to obtain more accurate residual displacement information generated by near-fault ground motion, this paper proposed a variable step-grid search method for ground motion baseline correction. The core of this method lies in preserving and accurately reflecting the residual displacement information of faults, and solving the problem of extremely low computational efficiency in traditional grid search methods when there are many digital seismic sampling points. Based on the strong ground motion data of the 1999 MW7.6 Chi-Chi earthquake in Taiwan region, this paper uses the variable step-grid search method for ground motion baseline correction to conduct in-depth research on the ground motion displacement characteristics near faults. By accurately correcting the initial moment of ground motion time history, this study successfully obtained relative ground motion time history data between multiple sets of the hanging and foot wall stations in the Chi-Chi earthquake. And based on this data, the displacement time history characteristics of the relative motion between the hanging and foot wall sites near the fault were analyzed. The research results indicate that the fling-step effect of ground motion is particularly significant in the Chi-Chi earthquake. The maximum displacement and residual displacement of near fault ground motion exceed 8 m and 6 m, respectively, and the average sliding velocity of the fault is as high as 1.4 m/s, fully demonstrating the strong destructive force of the earthquake. This poses challenges to the numerical simulation of fault rupture and related experimental researches. In addition, the relative motion between fault walls also exhibits similar motion characteristics to near fault ground motion, and its amplitude is larger. Therefore, the relative motion data between earthquake fault walls can refer to the time history of near fault ground motion as the input basis for engineering design and analysis. In addition, the residual displacement of the fault is about 80% of the maximum relative displacement between the fault walls. This study provides important information on residual displacement of fault ground motion, which is of great significance to the researches on fields such as earthquake engineering, earthquake warning, and disaster assessment.
-
引言
地电场由大地电场和自然电场组成,其中:大地电场源于空间电流系及日、月潮汐作用(黄清华,刘涛,2006;谭大诚等,2010),通常其日变波形具有区域性特征和场地特征(谭大诚等,2011);自然电场产生于地下介质的物理、化学作用,自然电场值在构造活动平静地区相对稳定,部分场地也表现出季节性特征(Tan,Xin,2017)。
基于地电场变化特征和机理认识,开展相应的方法、数据处理、观测试验、地震预测等方面的研究是地震地电场学科的主要思路(赵国泽,陆建勋,2003;黄清华,刘涛,2006;陈小斌,赵国泽,2009;汤吉等,2010;Ren et al,2015,2018;王书明等,2018)。例如:根据自然电场局部场地的稳定性、均匀性,基于 “点源” 模型,Varotsos和Alexopoulous (1984a,b)提出了地电场预测地震的VAN法;钱复业和赵玉林(2005)由地电场变化形态的相对稳定性特征发展出了波形分析法,这是最早的分析方法之一;基于大地电场极化机理,毛桐恩等(1999)探索了极化方位计算法;出于对大地电场谐波的认识,频谱分析法得以开展(范莹莹等,2010;Ren et al,2018)。2006年之后,基于应用数学、信号处理以及地震地电场机理变化过程相结合而产生的物理分析方法(黄清华,刘涛,2006;Zhang et al,2018),谭大诚等(2014,2019)依据大地电场岩体裂隙水(电荷)渗流(移动)模型提出了大地电场优势方位角计算方法。然而,在应用上述方法开展地电场分析和地震预测研究的过程中,马钦忠等(2004)以及黄清华和林玉峰(2010)发现存在地震异常信息的场地选择性现象。对于VAN方法,马钦忠等(2004)认为地下介质存在所谓的 “导电通路” ,只有 “敏感点” 场地才会出现异常信息;在大地电场优势方位角计算方法中,谭大诚等(2019)认为只有岩体裂隙结构变异的场地才会出现方位角异常信息。可见,偏重分析不同的地电场变化特征及持有不同的机理认识,均会导致所关注的异常及采用的分析方法存在差异。目前,地电场观测理论基本认为局部场地的地电场具有均匀性,然而对于实际的局部场地地电场变化特征的研究尚不够充分。
为此,本文依据新疆、甘肃、青海、吉林、黑龙江等省份的50余个地电场台站数据,拟开展同场地的不同方位之间、同方位不同极距之间地电场的相关性分析,并结合这些区域的五个典型震例,试图揭示地震孕育发生过程中地电场局部场地相关性的变化特点,旨在进一步了解局部场地地电场变化的复杂性。
1. 同场地多方位多极距之间的地电场相关性
对两个以上具备相关性的变量元素进行相关性分析,可以衡量各变量间的相关程度,这种相关程度一般用相关系数来表述。本文按积差方法计算相关系数δ,即以两变量与各自平均值的离差为基础,通过两个离差相乘来反映两变量之间的相关程度。变量元素Xi与Yi之间相关系数δ的表达式如下:
$\delta {\text{=}} \frac{{\sum\limits_{i} {} {\!\!\!\!{\text{(}}\!{X_i} {\text{-}} \overline X\!{\text{)}}\!\!\!\! } \!\!\!\!{\text{(}}\!{Y_i} {\text{-}} \overline Y\!{\text{)}}\!\!\!\!}}{{\sqrt {\sum\limits_{i} {{{\!\!\!\!{\text{(}}\!{X_i} {\text{-}} \overline X\!{\text{)}}\!\!\!\!}^2} {{\!\!\!\!{\text{(}}\!{Y_i} {\text{-}} \overline Y\!{\text{)}}\!\!\!\!}^2}} } }}{\text{,}}$

(1) This page contains the following errors:
error on line 1 at column 1: Start tag expected, '<' not foundBelow is a rendering of the page up to the first error.
1.1 同场地不同方位之间地电场相关性特征
使用式(1)计算不同方位之间地电场相关系数δ。设分析时段为T,单位为d,第t天的相关系数为δt,其稳定性Δδt为
$ \Delta {\delta _t} {\text{=}} {\delta _t} {\text{-}} {{\overline{\delta} _T}}{\text{,}} $

(2) This page contains the following errors:
error on line 1 at column 1: Start tag expected, '<' not foundBelow is a rendering of the page up to the first error.
为表述方便,本文分别用1,2,3表示NS,EW,NW/NE测向,则δ12为NS测向与EW测向地电场之间的相关系数,δ13为NS测向与NW/NE测向地电场之间的相关系数,δ23为EW测向与NW/NE测向地电场之间的相关系数,而δxy泛指不同方位之间地电场的相关系数。
为分析不同区域的同一场地多方位之间地电场的相关性,选取近年地震活动差异较明显的华南安徽蒙城台、新疆温泉台、东北密山台所记录的地电场数据进行分析。图1给出了2019年1月至3月期间,蒙城、温泉、密山这三个台站多方位地电场之间的相关系数δxy、相关系数稳定性Δδxy、附近场地最大地磁日K指数变化曲线(其中K指数来自中国地震台网中心数据库,当K≥5时被视为有磁暴发生)以及三个台站的电极布设示意图。
![]() 图 1 2019年1—3月蒙城台(a)、温泉台(b)和密山台(c)同场地多方位之间地电场相关系数δxy及其稳定性Δδxy、最大地磁日K指数的变化以及地电场电极布设示意图Figure 1. Correlation coefficient δxy between multiple azimuths and their stabilities Δδxy,maximum daily K-index of geomagnetic field as well as elelctrodes layout for the sites Mengcheng (a),Wenquan (b) and Mishan (c) during the period from January to March,2019
图 1 2019年1—3月蒙城台(a)、温泉台(b)和密山台(c)同场地多方位之间地电场相关系数δxy及其稳定性Δδxy、最大地磁日K指数的变化以及地电场电极布设示意图Figure 1. Correlation coefficient δxy between multiple azimuths and their stabilities Δδxy,maximum daily K-index of geomagnetic field as well as elelctrodes layout for the sites Mengcheng (a),Wenquan (b) and Mishan (c) during the period from January to March,2019由图1a可见:蒙城场地NS,EW,NW三个测向之间地电场的相关系数δ12,δ13和δ23的数值大小有差异,相关系数的变化范围(稳定性)Δδ12,Δδ13和Δδ23也有差异,相关系数存在正、负之分;该场地δ12绝对值最小,即NS与EW这两个方向之间的地电场相关性弱。
按照大地电场岩体裂隙水(电荷)渗流(移动)模型(谭大诚等,2014,2019),蒙城场地的大地电场优势方位角α在北偏东100°左右,由此该台NS向与NW向的地电场潮汐波同相,NS、NW向与EW向的地电场潮汐波反相(辛建村,谭大诚,2017),因此δ13为正,δ12和δ23为负。
由图1b和图1c可以看到:新疆温泉站的场地相关系数δ13接近1,δ12和δ23接近−1,相关系数变化Δδ12,Δδ13和Δδ23几乎都接近零;密山站的场地相关系数δ13接近1,δ12和δ23稍低于1,相关系数变化Δδ12,Δδ13和Δδ23均很小。
图1中第三行给出了临近上述地电场台站的地磁K指数变化曲线,对比图1中前两行地电场相关系数及其稳定性的变化可知,K指数的波动对各场地不同测向间地电场的相关系数及稳定性基本无影响。三个台站所在区域其它场地(长极距)不同方向之间的相关系数δxy及稳定性Δδxy的统计情况列于表1。表中所涉及台站的δxy及Δδxy均未受到K指数的明显影响。
表 1 2019年1月1日至3月31日同场地多方位之间地电场相关系数δxy及其稳定性Δδxy统计Table 1. Multi-azimuth and multi-pole distance correlation coefficient δxy and their stabilities Δδxy from 1 January 2019 to 31 March 2019台站 δ12 δ13 δ23 Δδ12 Δδ13 Δδ23 台站 δ12 δ13 δ23 Δδ12 Δδ13 Δδ23 德都 0.95 0.95 0.95 0.05 0.05 0.05 绥化 0.10 0.90 0.60 0.50 0.10 0.40 密山 −0.90 0.95 −0.90 0.05 0.05 0.05 通河 −0.90 −0.85 0.95 0.10 0.15 0.05 望奎 0.45 0.35 −0.40 0.35 0.35 0.20 肇东 0.80 −0.20 −0.70 0.10 0.20 0.10 林甸 0.80 0.55 0.10 0.20 0.20 0.30 嘉山 −0.95 0.95 −0.95 0.05 0.05 0.05 蒙城 −0.20 0.65 −0.85 0.20 0.15 0.15 高邮 0.45 0.70 0.90 0.15 0.10 0.10 海安 −0.10 0.60 0.70 0.20 0.20 0.20 兰州 0.55 0.80 0.10 0.25 0.20 0.50 山丹 0.90 0.95 0.90 0.10 0.05 0.10 平凉 0.95 −0.80 −0.95 0.05 0.10 0.05 瓜州 0.80 0.95 0.95 0.10 0.05 0.05 寺滩 −0.40 0 0.85 0.30 0.60 0.15 乌什 −0.80 0.60 −0.05 0.20 0.20 0.15 和田 0 0.25 −0.25 0.60 0.15 0.15 温泉 0.90 0.95 0.90 0.10 0.02 0.10 红浅 0.30 0.80 0.80 0.30 0.10 0.10 注:δ变动范围取Δδxy正常变化的最大绝对值。 由表1可以看出:85%场地的三个相关系数 δxy 中至少有一个达到0.8或以上,40%场地的三个δxy全部达到0.8或以上,这表明大多数场地仅在部分方向之间具有强相关性;15%场地的三个相关系数δxy均低,如和田台、望奎台,究其原因为台站观测环境、装置存在明显干扰或维护不足;90%场地的三个δxy之间存在差异,80%场地的三个稳定性Δδxy存在差异,且这两种差异性具有持续性。同时,地磁场K指数变化对相关系数δxy和稳定性Δδxy基本不产生影响。
1.2 同测向长、短极距之间地电场相关性特征
依然分别用1,2,3表示NS,EW,NW/NE测向,δ11为NS方位长、短极距之间的相关系数,δ22为EW方位长、短极距之间的相关系数,δ33为NW/NE方位长、短极距之间的相关系数,δxx指同方位不同极距之间的相关系数。
同样选取蒙城、温泉、密山这三个台站,对其同测向长、短极距之间地电场的相关性展开分析。图2给出了这三个台站在2019年1月至3月长、短极距之间的相关系数δ11,δ22和δ33,稳定性Δδ11,Δδ22,Δδ33和附近场地最大地磁日K指数(引自中国地震台网中心数据库,当K≥5时视为有磁暴发生)的变化曲线。
![]() 图 2 2019年1—3月蒙城台(a)、温泉台(b)和密山台(c)同场地长、短极距之间的相关系数δxx及其稳定性Δδxx和最大地磁日K指数的变化Figure 2. Correlation coefficient δxx between the long and short pole distances of the same site and their stabilities Δδxx as well as maximum daily K-index of geomagnetic field for the sites Mengcheng (a),Wenquan (b) and Mishan (c) in the period from January to March,2019
图 2 2019年1—3月蒙城台(a)、温泉台(b)和密山台(c)同场地长、短极距之间的相关系数δxx及其稳定性Δδxx和最大地磁日K指数的变化Figure 2. Correlation coefficient δxx between the long and short pole distances of the same site and their stabilities Δδxx as well as maximum daily K-index of geomagnetic field for the sites Mengcheng (a),Wenquan (b) and Mishan (c) in the period from January to March,2019由图2可以看出:蒙城、温泉、密山三个台站同测向长、短极距地电场之间的相关系数 δ11,δ22和δ33均接近1,其相应稳定性Δδxx均接近零,与图1相对比可知Δδxx相对Δδxy总体上更稳定,K指数变化对长、短极距间的相关系数δxx无影响。表1中台站长、短极距地电场之间相关系数及稳定性统计情况列于表2。表中所涉及台站的δxx和Δδxx均未受到K指数的明显影响。
表 2 2019年1月1日至3月31日同场地长、短极距之间的相关系数δxx及其稳定性Δδxx统计Table 2. Correlation coefficients δxx between the long and short pole distances and their stabilities Δδxx for the same sites from 1 January 2019 to 31 March 2019台站 δ11 δ22 δ33 Δδ11 Δδ22 Δδ33 台站 δ11 δ22 δ33 Δδ11 Δδ22 Δδ33 德都 0.90 0.90 0.95 0.10 0.10 0.05 绥化 0.30 0.70 0.50 0.70 0.30 0.50 密山 0.95 0.95 0.95 0.05 0.05 0.05 通河 0.95 0.95 0.95 0.05 0.05 0.05 望奎 0.50 0.95 0.80 0.50 0.05 0.20 肇东 0.90 0.90 0.90 0.10 0.10 0.10 林甸 0.95 0.95 0.95 0.05 0.05 0.05 嘉山 0.90 0.95 0.95 0.10 0.05 0.05 蒙城 0.90 0.90 0.95 0.10 0.10 0.05 高邮 0.90 0.95 0.90 0.10 0.05 0.10 海安 0.90 0.90 0.95 0.10 0.10 0.05 兰州 0.90 0.40 0.60 0.10 0.40 0.40 山丹 0.95 0.90 0.95 0.05 0.10 0.05 平凉 0.90 0.95 0.90 0.10 0.05 0.10 瓜州 0.95 0.95 0.95 0.05 0.05 0.05 寺滩 −0.20 0.90 0.70 0.20 0.10 0.30 乌什 0.95 0.80 0.80 0.05 0.10 0.20 和田 0.80 0.40 0.60 0.20 0.40 0.40 温泉 0.95 0.95 0.95 0.05 0.05 0.05 红浅 0.70 0.55 0.80 0.20 0.35 0.20 注:δ变动范围取Δδxx正常变化的最大绝对值。 由表2看出:95%场地的三个相关系数δxx中至少有一个达到0.8或以上,70%场地的三个相关系数δxx全部达到0.8或以上,这表明大多数场地同方向长、短极距间地电场存在强相关性;70%场地的长、短极距之间δxx和Δδxx存在差异,且该现象具有持续性;相比较不同方向之间的δxy和δxy,同测向长、短极距之间的相关系数δxx更高、更稳定。同样,地磁场K指数变化对同场地长、短极距间地电场相关系数δxx及其稳定性Δδxx基本不产生影响。
1.3 地电场两种相关性变化的物理意义
地电场观测数据由自然电场ESP、大地电场ET及干扰成分Er组成。如果场地构造活动较平稳,利用式(1)计算相关系数时,若采用分钟值数据进行计算,得到的结果是关于大地电场与干扰成分之间的相关性;若应用日均值计算,得到的则是自然电场成分之间的相关性。本文中除特殊说明外均采用分钟值进行计算。
地电场是矢量场,理论上不同方向的地电场为总地电场在各方向上的分量,因此各分量间应存在密切的相关性。上述统计结果也表明多数实际地电场观测场地不同方向之间、同方向长短极距之间确实存在一定程度的强相关性。
1.3.1 地电场“非均匀变化”现象及其对相关性的影响
图3a是相关系数 δ 达到0.996 7的两组序列y1x和y2x,其中x=1,2,3,···,60。设序列y1x前十分之一数据(x=1,2,···,6)变为1.1y1x,形成新的序列y1x′,序列y2x不变,由式(1)可得到新序列y1x′与y2x的相关系数δ′降至0.588 8;固定y1x的变化个数(x=n,n+1,···,n+5)和1.1y1x变化比例,x逐一向坐标轴增大方向滑动,相关系数变化情况如图3c所示;如果增大变化比例,其相关系数降低幅度也随之变化。然而,序列y1x和y2x整体(x=1,2,3,···,60)按任意比例变化,两序列间的相关系数不会改变,如图3b所示,这种变化也可以从式(1)获知,证明如下:
![]() 图 3 地电场非均匀变化对相关系数的影响(a) 原始序列y1x、y2x和序列y1x’、y2x及其相关系数;(b) 序列y1x和y2x以任意比例整体变化;(c) 原始波形数据、双向地铁干扰数据及原始相关系数;(d) 双向、NS向、EW向叠加地铁干扰后的相关系数Figure 3. Effect of correlation coefficient non-uniform variation of geoelectric field(a) Original series y1x,y2x and series y1x’,y2x and their correlation coefficient;(b) Series y1x and y2x overall change at any ratio;(c) Raw and two-direction subway interference waveform data as well as the original correlation coefficient; (d) Correlation coefficient after stacking subway interference in two-direction,NS and EW
图 3 地电场非均匀变化对相关系数的影响(a) 原始序列y1x、y2x和序列y1x’、y2x及其相关系数;(b) 序列y1x和y2x以任意比例整体变化;(c) 原始波形数据、双向地铁干扰数据及原始相关系数;(d) 双向、NS向、EW向叠加地铁干扰后的相关系数Figure 3. Effect of correlation coefficient non-uniform variation of geoelectric field(a) Original series y1x,y2x and series y1x’,y2x and their correlation coefficient;(b) Series y1x and y2x overall change at any ratio;(c) Raw and two-direction subway interference waveform data as well as the original correlation coefficient; (d) Correlation coefficient after stacking subway interference in two-direction,NS and EW1) 设x按比例变化为ax,则
$ {\delta _1} {\text{=}} \frac{{\mathop \sum\limits_{i} \!\!\!\!{\text{(}}\!{a{X_i}{\text{-}}a\overline X} \!{\text{)}}\!\!\!\! \!\!\!\!{\text{(}}\!{{Y_i}{\text{-}}\overline Y} \!{\text{)}}\!\!\!\!}}{{\sqrt {\mathop \sum\limits_{i} {{\!\!\!\!{\text{(}}\!a{X_i}{\text{-}}a\overline X\!{\text{)}}\!\!\!\!}^2} {{\!\!\!\!{\text{(}}\!{Y_i}{\text{-}}\overline Y\!{\text{)}}\!\!\!\!}^2}} }} {\text{=}} \frac{{\mathop \sum\limits_{i} a\!\!\!\!{\text{(}}\!{{X_i}{\text{-}}\overline X} \!{\text{)}}\!\!\!\! \!\!\!\!{\text{(}}\!{{Y_i}{\text{-}}\overline Y} \!{\text{)}}\!\!\!\!}}{{\sqrt {\mathop \sum\limits_{i} {a^2}{{\!\!\!\!{\text{(}}\!{X_i}{\text{-}}\overline X\!{\text{)}}\!\!\!\!}^2} {{\!\!\!\!{\text{(}}\!{Y_i}{\text{-}}\overline Y\!{\text{)}}\!\!\!\!}^2}} }} {\text{=}} {\rm{\delta }} {\text{,}} $

(3) 2) 设y按比例变化为by,则
$ {\delta _2} {\text{=}} \frac{{\mathop \sum\limits_{i} \!\!\!\!{\text{(}}\!{{X_i} {\text{-}} \overline X} {\text{)}}\!\!\!\! \!\!\!\!{\text{(}}\!{b{Y_i} {\text{-}} b\overline Y} {\text{)}}\!\!\!\!}}{{\sqrt {\mathop \sum\limits_{i} {{\!\!\!\!{\text{(}}\!{X_i} {\text{-}} \overline X{\text{)}}\!\!\!\!}^2} {{\!\!\!\!{\text{(}}\!b{Y_i} {\text{-}} b\overline Y{\text{)}}\!\!\!\!}^2}} }} {\text{=}} \frac{{\mathop \sum\limits_{i} b\!\!\!\!{\text{(}}\!{{X_i} {\text{-}} \overline X} {\text{)}}\!\!\!\! \!\!\!\!{\text{(}}\!{{Y_i} {\text{-}} \overline Y} {\text{)}}\!\!\!\!}}{{\sqrt {\mathop \sum\limits_{i} {b^2}{{\!\!\!\!{\text{(}}\!{X_i} {\text{-}} \overline X{\text{)}}\!\!\!\!}^2} {{\!\!\!\!{\text{(}}\!{Y_i} {\text{-}} \overline Y{\text{)}}\!\!\!\!}^2}} }} {\text{=}} {\rm{\delta }} {\text{,}} $

(4) 3) 设x按比例变化为ax,y按比例变化为by,则
$ {\delta _3} {\text{=}} \frac{{\mathop \sum\limits_{i} \!\!\!\!{\text{(}}\!{a{X_i} {\text{-}} a\overline X} {\text{)}}\!\!\!\! \!\!\!\!{\text{(}}\!{b{Y_i} {\text{-}} b\overline Y} {\text{)}}\!\!\!\!}}{{\sqrt {\mathop \sum\limits_{i} {{\!\!\!\!{\text{(}}\!a{X_i} {\text{-}} a\overline X{\text{)}}\!\!\!\!}^2} {{\!\!\!\!{\text{(}}\!b{Y_i} {\text{-}} b\overline Y{\text{)}}\!\!\!\!}^2}} }} {\text{=}} \frac{{\mathop \sum\limits_{i} ab\!\!\!\!{\text{(}}\!{{X_i} {\text{-}} \overline X} {\text{)}}\!\!\!\! \!\!\!\!{\text{(}}\!{{Y_i} {\text{-}} \overline Y} {\text{)}}\!\!\!\!}}{{\sqrt {\mathop \sum\limits_{i} {a^2}{b^2}{{\!\!\!\!{\text{(}}\!{X_i} {\text{-}} \overline X{\text{)}}\!\!\!\!}^2} {{\!\!\!\!{\text{(}}\!{Y_i} {\text{-}} \overline Y{\text{)}}\!\!\!\!}^2}} }} {\text{=}} {\rm{\delta }}{\text{.}} $

(5) 因此,序列y1x和y2x整体按比例改变不会导致其相关系数变化。本文中,序列y1x和y2x的这种变化称其为 “均匀变化” ;序列y1x和y2x部分改变而导致其相关系数变化的现象称其为 “非均匀变化” 。图3a显示,在y1x和y2x发生非均匀变化时,其相关系数的降低与其变化幅度以及变量x,y1x或y2x数据相关。
在不同地电场观测数据的相关性分析中,上述序列y1x和y2x可以分别代表两个方向的电场值,也可以是同测向的长、短极距电场值。同理,任意两个电场值E1(t)或E2(t)改变导致其相关系数变化的现象,本文也称其为 “非均匀变化” ,而不会改变其相关系数的变化称其为 “均匀变化” 。显然,如果E1(t)或E2(t)之间发生 “非均匀变化” ,则一定出现了类似图3a所示的复杂变化现象。在同一场地,对地电场E1(t)或E2(t)而言,这种复杂变化反映了不同方向之间或同方向长短极距之间的地电场实际发生了非均匀变化;当然,如果E1(t)或E2(t)发生图3b所示变化,应用相关性分析不会得到变化的认知。
1.3.2 观测环境恶化对地电场相关性的影响
在实际地电场观测中,局部场地的地电场非均匀变化的原因比较复杂,既有地电场自身发生非均匀变化的可能,也存在干扰导致地电场出现非均匀变化的可能。
青海都兰台的地电场观测场地环境、装置良好,其原始数据日变波清晰。以该台站2019年3月7日至13日的数据为例,图3c第一行为该台NS、EW测向地电场原始曲线,这两个测向间相关系数δ12见图3c第三行所示。
This page contains the following errors:
error on line 1 at column 1: Start tag expected, '<' not foundBelow is a rendering of the page up to the first error.
2. 地电场相关系数δxy和δxx变化与地震的关联现象
在第一节中,已经获知在区域构造活动相对平静期间,同一场地多方向之间、长短极距之间的相关性具有相对稳定性。地震是构造活动的重要表现形式,地电场异常信息不仅存在不同场地的选择性现象(马钦忠等,2004),还存在局部场地效应现象(Gershenzont et al,1993)。因此,在地震孕育发生期间,局部场地的地电场变化可能具有复杂的非均匀性,这种现象能够以地电场相关系数δxy和δxx的变化表现出来。
本文选取2016年1月21日青海门源MS6.4,12月8日新疆呼图壁MS6.2,2017年8月8日四川九寨沟MS7.0,8月9日新疆精河MS6.6和2018年5月28日松原MS5.7等五次地震发生时所记录到的地电场数据进行分析。
2.1 2016年青海门源MS6.4地震
2016年1月21日青海门源(37.68°N,101.62°E)发生MS6.4地震,距震中600 km范围内的松山台、黄羊川台不同方向地电场之间的相关系数δxy和同方向不同极距地电场之间的相关系数δxx的变化如图4所示。
![]() 图 4 青海门源MS6.4地震周边台站分布 (a)及松山台和黄羊川台附近场地不同方向间地电场相关系数δxy (b)和长短极距间相关系数δxx (c)的变化Figure 4. Distribution of stations around the Menyuan MS6.4 earthquake in Qinghai Province and the correlation coefficient δxy between different azimuths (b) and δxx between long and short pole distance (c) for the sites Songshan and Huangyangchuan
图 4 青海门源MS6.4地震周边台站分布 (a)及松山台和黄羊川台附近场地不同方向间地电场相关系数δxy (b)和长短极距间相关系数δxx (c)的变化Figure 4. Distribution of stations around the Menyuan MS6.4 earthquake in Qinghai Province and the correlation coefficient δxy between different azimuths (b) and δxx between long and short pole distance (c) for the sites Songshan and Huangyangchuan由图4可见:松山台和黄羊川台在震前三个方向的δxy和δxx均发生了显著变化,两个场地相关性降低的幅度有所差异,即至2015年底,两台站相关性显著下降基本上具有准同步性,但黄羊川台的δxy和δxx下降得更明显,持续时间更长;两个台站有关NW向的相关系数震前下降的幅度更大,同测向长、短极距间相关系数变化更清晰,可见其相关性异常下降具有一定的方向性。
门源地震震中900 km范围内有32个台站(图4a),其震前δxy和δxx的变化统计列于表3。由表3所示的统计结果可得:
表 3 距门源MS6.4地震震中900 km范围内台站的地电场相关系数统计Table 3. Statistics on correlation coefficient of geoelectrical field for the stations 900 km away from the epicenter of the Menyuan MS6.4 earthquake台站 震中距
/km场地异常变化
距发震时间/d台站 震中距
/km场地异常变化
距发震时间/d台站 震中距
/km场地异常变化
距发震时间/dδxy δxx δxy δxx δxy δxx 武威 78 − − 中卫 319 16 20 汉王 568 25 − 金银滩 98 − − 白水河 374 23 21 凤翔 585 − − 拦隆口 103 25 − 都兰 348 25 − 瓜州 592 25 30 古丰 110 35 − 大武 377 23 23 宝鸡 642 − − 黄羊 132 40 40 嘉峪关 378 − − 乌加河 675 − − 山丹 132 40 32 银川地电 405 25 − 乾陵 687 − − 红沙 147 35 − 银川 417 30 − 周至 705 − − 松山 177 15 15 固原彭 433 − − 成都 778 − − 寺滩 206 − − 天水 455 − − 合阳 814 − − 高台 246 51 51 石嘴山 473 35 − 临汾 885 − − 兰州 266 − − 平凉 501 25 34 注:“−”表示震前未显示出异常变化;黄羊川台2015年6月中旬δxy和δxx的显著下降对应于11月23日青海祁连MS5.2地震(震中距为241 km)。 1) 震前15个场地的相关性δxy和δxx呈明显下降,相对下降幅度m为
$ m {\text{=}} \frac{{\Delta {\delta _{{\rm{an}}}}}}{{\Delta {\delta _{\rm{n}}}}} {\text{×}} 100\%{\text{,}} $

(6) 式中,Δδn为相关系数稳定、正常的变化范围,Δδan为异常变化范围。门源MS6.4地震前各场地δxy和δxx的相对下降幅度m均为200%—1000%。
2) 各场地δxy和δxx的变化基本上发生在震前25天前后,总体上δxy和δxx的下降具有时间上的准同步性,但震前异常出现时间与震中距并无明显关系。
3) 距门源地震震中200 km范围内有8个台站,其中震前δxy和δxx下降的台站有6个,占75%;200—600 km内有17个台站,震前δxy和δxx下降的共11个,占64.7%;600—900 km内有7个台站,震前无台站相关系数下降,所占比例为零。可见,震前这种场地地电场相关系数δxy和δxx下降的比例随震中距的增大而降低,距震中600 km内这种相关系数下降的台站所占比例超过50%。
此外,需要说明的是:① 在统计分析中,14个场地的相关性下降,这一现象基本都具有一定的方向性,类似图4所示;② 鉴于图4中三个方向的场地相关性δxy和δxx的降幅有差异,下面各图中仅绘制变化显著的δxy和δxx曲线。
2.2 2016年新疆呼图壁MS6.2和2017年精河MS6.6地震
This page contains the following errors:
error on line 1 at column 1: Start tag expected, '<' not foundBelow is a rendering of the page up to the first error.
![]() 图 5 呼图壁MS6.2和精河MS6.6地震周围台站分布(a)及红浅台和温泉台附近场地不同方向间地电场相关系数(b)和长短极距间相关系数(c)Figure 5. Distribution of stations around the Hutubi MS6.2 and Jinghe MS6.6 earthquakes (a) and the correlation coefficient between different azimuths (b) and those between long and short pole distance (c) for the sites Hongqian and Wenquan
图 5 呼图壁MS6.2和精河MS6.6地震周围台站分布(a)及红浅台和温泉台附近场地不同方向间地电场相关系数(b)和长短极距间相关系数(c)Figure 5. Distribution of stations around the Hutubi MS6.2 and Jinghe MS6.6 earthquakes (a) and the correlation coefficient between different azimuths (b) and those between long and short pole distance (c) for the sites Hongqian and Wenquan由图5b和5c可见:在两次地震前,红浅台和温泉台的δxy和δxx均呈下降趋势,但下降程度有差异;对于呼图壁和精河地震,各场地δxy和δxx的相对下降幅度m分别为300%—400%和200%—800%,且这种变化在时间上也具有准同步性。
两次地震震中600 km范围内的温泉、红浅、乌鲁木齐这三个台站的δxy和δxx在震前均下降,占总台站数的100%。
2.3 2018年吉林松原MS5.7地震
2018年5月28日吉林松原(45.27°N,124.71°E)发生MS5.7地震,距此次地震震中600 km内有12个台站,如图6a所示,黑龙江肇东台和德都台的δxy和δxx变化如图6b和6c所示。
![]() 图 6 松原MS5.7地震周围台站分布(a)以及德都台和肇东台附近场地不同方向间地电场相关系数(b)和长短极距间相关系数(c)Figure 6. Distribution of stations around the Songyuan MS5.7 earthquake (a) and the correlation coefficient between different azimuths (b) and those between long and short pole distance (c) for the sites Dedu and Zhaodong
图 6 松原MS5.7地震周围台站分布(a)以及德都台和肇东台附近场地不同方向间地电场相关系数(b)和长短极距间相关系数(c)Figure 6. Distribution of stations around the Songyuan MS5.7 earthquake (a) and the correlation coefficient between different azimuths (b) and those between long and short pole distance (c) for the sites Dedu and Zhaodong从图6b和6c可见,松原MS5.7地震前,肇东台和德都台的δxy和δxx均呈明显下降变化,其变化程度有差异,时间上具有一定程度准同步性。各场地的δxy和δxx相对下降幅度m为200%—800%。
此外,统计图6a所示12个台站,距震中200 km内的4个台站和200—600 km内的8个台站,均在震前发生异常变化,占总台站数比例为100%。
2.4 2017年四川九寨沟MS7.0地震
2017年8月8日四川九寨沟(33.20°N,103.82°E)发生MS7.0地震,距震中600 km 范围内有20个台站,如图7a所示,其中平凉台和江油台的δxy和δxx变化如图7c所示。
![]() 图 7 九寨沟MS7.0地震周边台站分布与相关系数及方位角变化(a) 震中及台站分布;(b) 方位角α变化;(c) δxy和δxx变化;(d) ΔESP变化Figure 7. Distribution of stations around the Jiuzhaigou MS7.0 earthquake and variation of correlation coefficient and azimuth(a) Epicenter and station distribution;(b) Variation of azimuth α;(c) Variation of δxy and δxx;(d) Variation of ΔESP
图 7 九寨沟MS7.0地震周边台站分布与相关系数及方位角变化(a) 震中及台站分布;(b) 方位角α变化;(c) δxy和δxx变化;(d) ΔESP变化Figure 7. Distribution of stations around the Jiuzhaigou MS7.0 earthquake and variation of correlation coefficient and azimuth(a) Epicenter and station distribution;(b) Variation of azimuth α;(c) Variation of δxy and δxx;(d) Variation of ΔESP图7c表明九寨沟MS7.0地震前,平凉、江油场地的δxy和δxx存在下降或下降突跳现象,这些现象具有时间准同步性,计算得到其δxy和δxx相对下降幅度m为 200%—2500%。
此外,统计图7a中的20个台站,距九寨沟地震震中200 km内有3个台站,200—600 km内有17个台站,这些台站均在震前发生异常变化,占总台站数比例为100%。
3. 地电场相关系数 δxy及 δxx变化的机理探讨
在区域构造活动较平静期间,场地多方位之间、长短极距之间地电场的相关系数δxy和δxx具有相对稳定性,但是当场地地电场发生非均匀变化或受到强干扰时,其相关系数会降低。门源MS6.4地震前,14个场地的δxy和δxx的下降具有时间准同步性(图4),这基本排除了由于环境干扰、装置故障等带来影响的可能。同样,呼图壁、精河、松原、九寨沟地震前多台站δxy和δxx的下降也具有时间准同步性(图5—7),图8为这5个震例δxy和δxx发生显著下降距发震当日的时长统计图。图4—7中δxy和δxx的下降应该是局部场地地电场非均匀变化导致。这种大范围、时间准同步的地电场非均匀变化现象,用地电场局部场地效应(Gershenzon et al,1993)更易解释。
![]() 图 8 各震例相关系数显著下降现象距发震时刻的时长统计图Figure 8. Statistical chart of the duration of the five earthquakes with δxy and δxx significantly decreasing from the day when the earthquakes occurred
图 8 各震例相关系数显著下降现象距发震时刻的时长统计图Figure 8. Statistical chart of the duration of the five earthquakes with δxy and δxx significantly decreasing from the day when the earthquakes occurred在图8所示的5次震例中,δxy和δxx显著下降的持续时间处于10天至3个月的范围内,这个时段长度与震级大小并无明显的联系。
表3中,震前地电场相关系数δxy和δxx下降的台站基本都在距震中600 km内,其中距震中200 km内的台站占75%,200—600 km内的台站占64.7%。九寨沟MS7.0地震前,附近平凉、江油台的大地电场优势方位角α未呈明显异常(图7b);图4—7所示震例的统计结果(表4)显示,震前δxy和δxx下降的台站数明显多于大地电场优势方位角α异常的台站数,这表明地震孕育发生期间,震中附近场地的地电场相关系数δxy和δxx出现异常的现象更具普遍性。
表 4 距典型震例震中600 km以内台站的相关系数及大地电场优势方位角α异常台站占总台站比例统计Table 4. Statistics on correlation coefficient and the azimuth α variation of telluric field for the stations within 600 km from typical earthquake epicenters地震 时段/mo 异常台站所占比例 地震 时段/mo 异常台站所占比例 δxy δxx α δxy δxx α 门源MS6.4 24 68% 36% 40% 松原MS5.7 20 100% 50% 41.7% 呼图壁MS6.2 24 100% 100% 66.7% 九寨沟MS7.0 12 100% 60% 25% 精河MS6.6 24 100% 100% 100% 实际上,谭大诚等(2019)的研究也表明大地电场优势方位角a异常的场地多集中在距震中约300 km的范围内,且多对应MS4.0以上的地震,这表明孕震过程靠近震中的场地岩体应该受到了更强的应力挤压作用,其裂隙结构才可能发生变化;在更大范围发生的地电场相关系数δxy和δxx的下降现象,表明随着震中距的增大,应力挤压作用在减弱,但地电场仍能发生非均匀变化,图4—7所示的相关系数δxy和δxx震后逐渐恢复,可能印证了这一物理过程。
本文计算的两个电场值之间相关系数δxy和δxx采用分钟数据值,这包含了自然电场ESP和大地电场ET。通常,场地ESP具有相对稳定性(Tan,Xin,2017),当场地δxy和δxx相对稳定时,表明场地ET变化具有相对均匀性;文中指出地震孕育发生期间δxy和δxx多会变差,其原因是局部场地地电场发生了非均匀变化,而此变化为场地ESP和ET的总体反映。例如:九寨沟MS7.0地震前,平凉台自然电场稳定性ΔESP (谭大诚等,2014)未呈明显异常(图7d),但江油台ΔESP震前3个月左右出现明显异常突跳(图7d),这个时间与该台相关系数δxy和δxx的下降基本准同步,而震中附近ΔESP异常并非孤立现象(图7d)。因此,地震孕育发生期间,各场地地电场非均匀变化是一种复杂的变化过程,通过δxy和δxx显著下降的现象可以观察这个过程的发生,但不能明确究竟是ESP亦或是ET发生了变化。
VAN法(Varotsos,Alexopoulous,1984a,b)认为只有 “远源” 信号才可能是地震电信号(seismic electric signals,缩写为SES),该方法适用于利用源于孕震源的自然电场ESP变化信息进行的地震预测探索。由此可见,开展地震预测分析时,基于 “远源” 自然电场ESP信息可尝试VAN法;基于 “近源” 地电场信息,开展地电场相关系数δxy和δxx分析或试用大地电场优势方位角α法(谭大诚等,2014,2019)也有其物理基础。
4. 讨论与结论
自二十世纪后期,法国、希腊、日本等多个国家相继开展了地震地电场观测实践。对同一场地的地电场变化特点,中外学者的传统观点都认为其具有“均匀性”特征,Varotsos和Alexopoulos (1984a,b)基于地电场预测地震的VAN法原理最能体现这一观点。
本文基于中国大陆不同区域近年的五个典型震例、周边50余个地电场台站、长时间的地电场分钟值数据,对这些场地的地电场相关性进行了系统研究,主要结论如下:
1) 在地震活动平静期,同一场地不同方位之间地电场相关系数 δxy 或同方位不同极距之间地电场相关系数 δxx 具有相对稳定性;
2) 在中强地震孕育发生期间,震中附近多数场地的 δxy和δxx 会出现明显下降,其下降的相对幅度m不低于200%;同时,多场地 δxy和δxx 的下降现象具有时间准同步性,且随着震中距的增加,这种相关性下降现象逐步消失。
由此可见,结果1)与传统认识保持了一致性,结果2)则认识到在地震孕育发生期间,场地的地电场具有非均匀变化特点。在地电场基础理论研究中,本文首次明确提出的这一认识具有理论意义:一方面补充了对地电场复杂变化特征的认识,另一方面可能为地震前兆信息的识别提供了一种新的物理分析参数。
需要指出的是,观测场地的环境条件恶化、装置稳定性变差等因素也能降低地电场的相关系数δxy和δxx,本文研究过程中注重同区域多场地的对比分析,力图将这一影响降至最低,多个震例的分析结果显示这一方法具有效果。同时,作者发现少数场地在地震孕育发生期间,某一 δxy或 δxx数据呈现增大现象,这个现象实质上也反映了这一期间地电场变化具有复杂性,但其机理认识则需要后期深入研究。
-
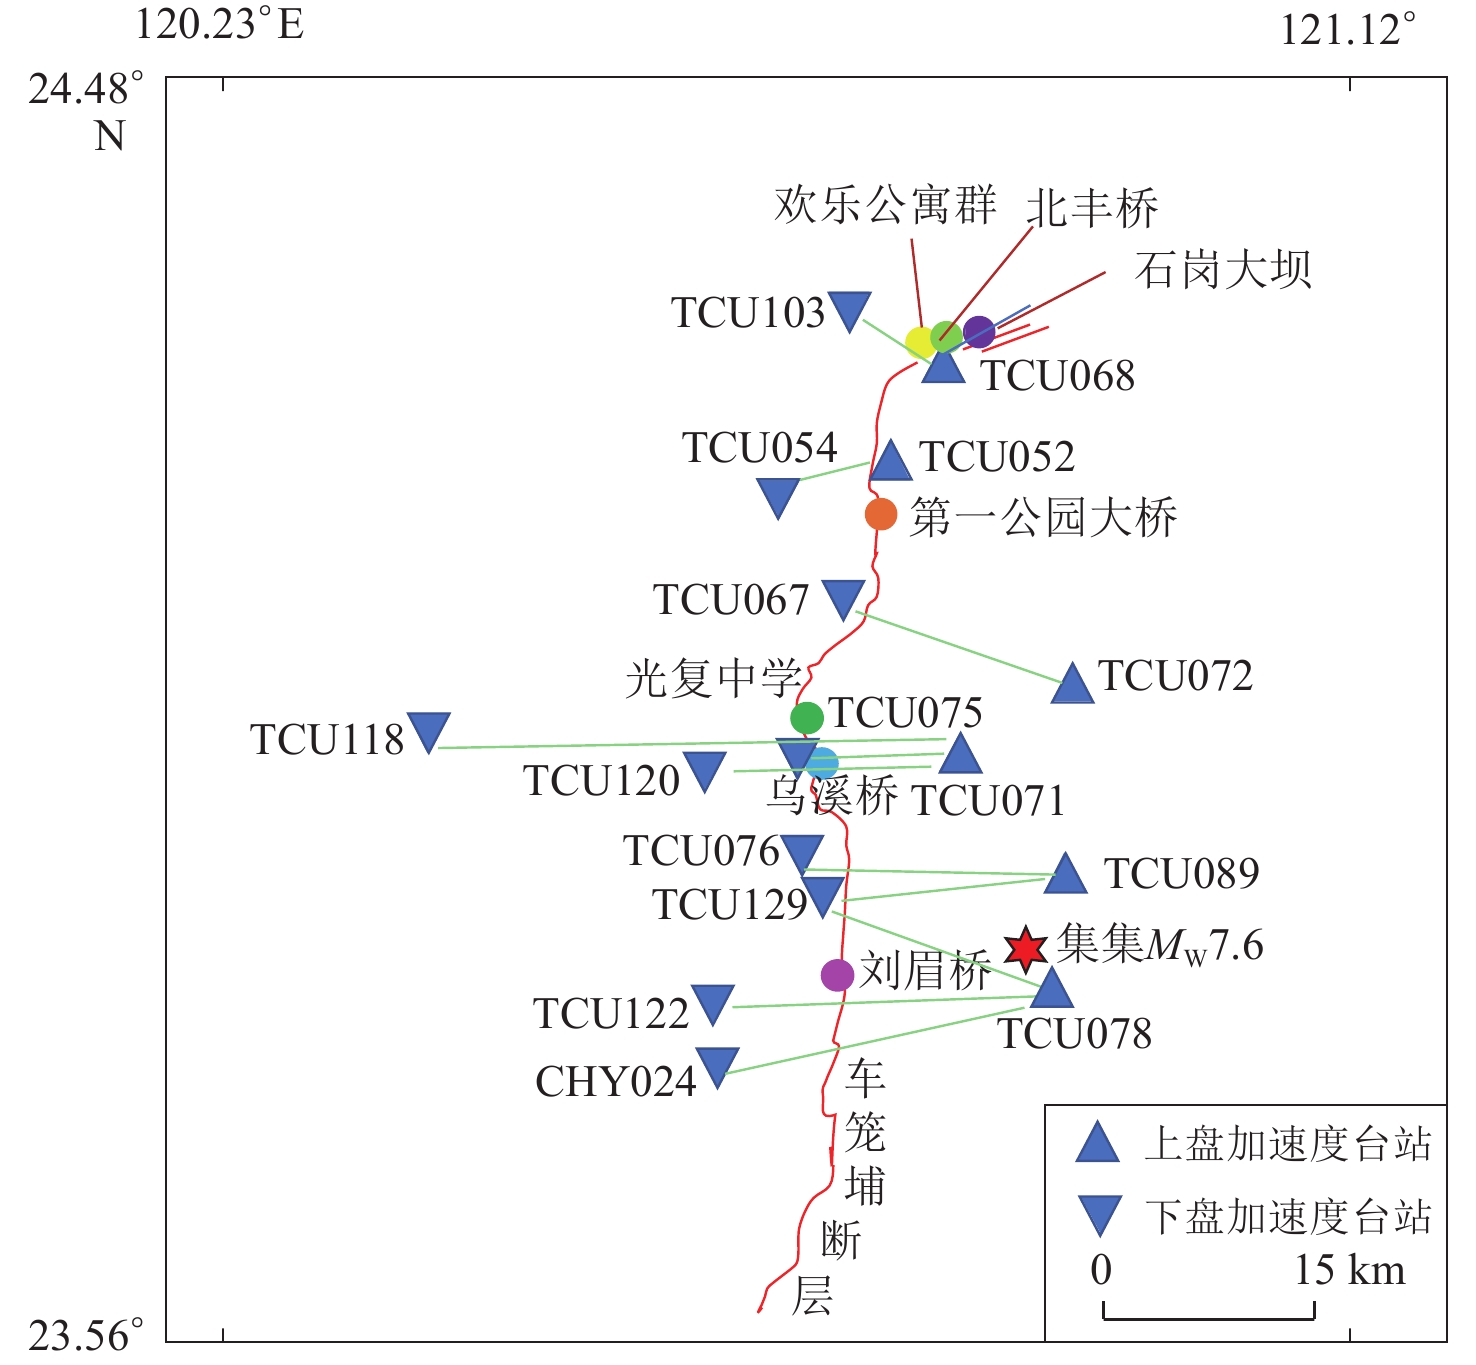
![]()
图 1 1999年9月21日台湾集集MW7.6地震断层和台站分布示意图
Figure 1. Schematic diagram of the fault and stations distribution of the MW7.6 Chi-Chi earthquake in Taiwan on 21 September 1999
![]()
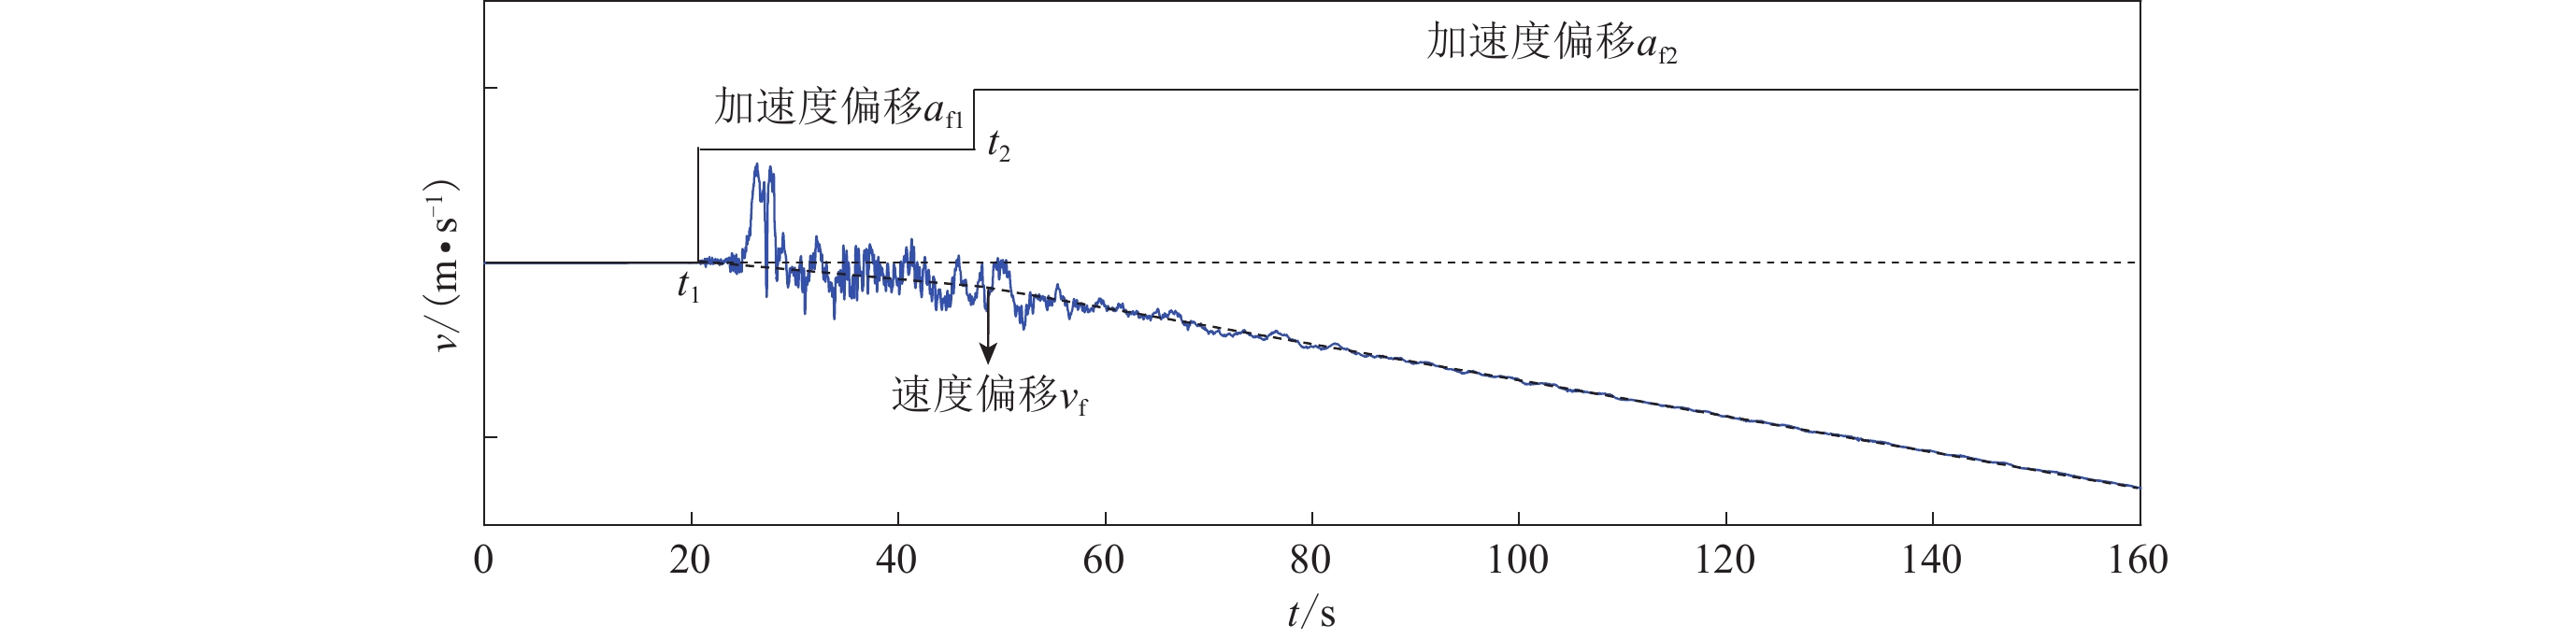
图 2 速度时程基线校正示意图
Figure 2. Schematic diagram of baseline correction for velocity time history
![]()
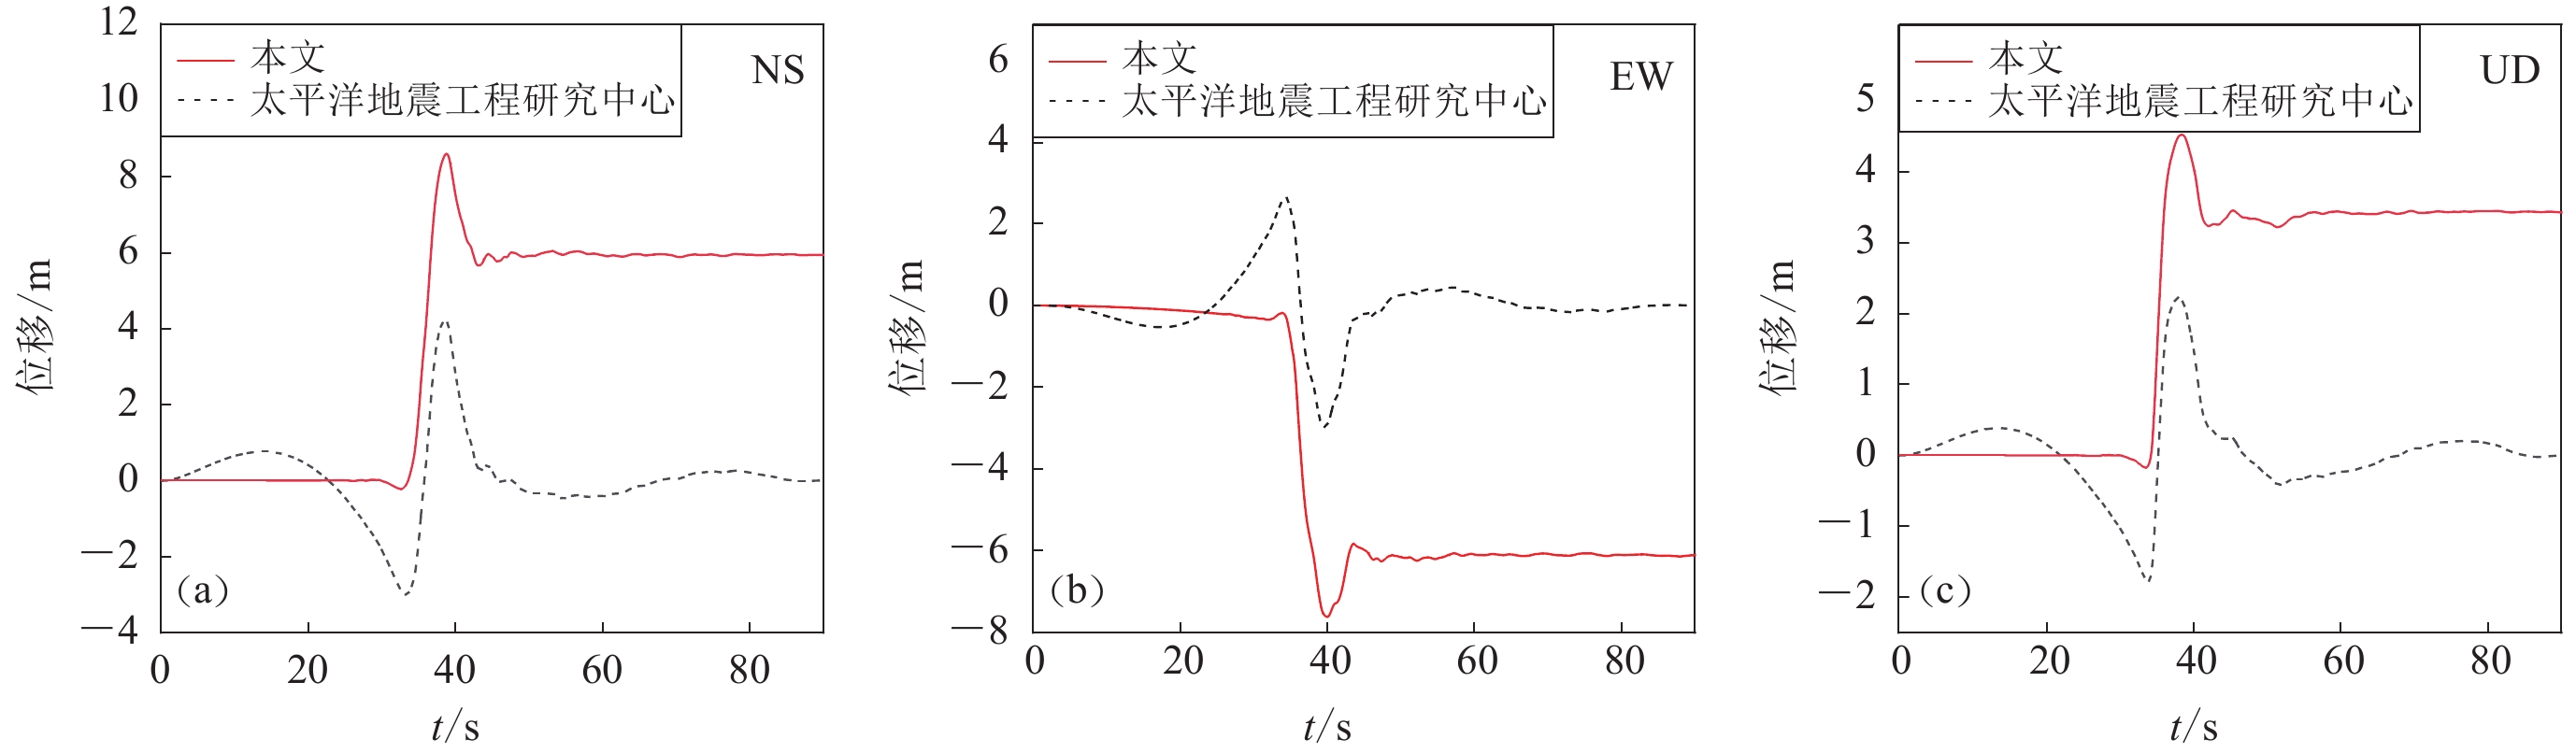
图 3 本文方法与太平洋地震工程研究中心方法处理的TCU068台站近断层地震动位移时程比较
(a) NS分量;(b) EW 分量;(c) UD 分量
Figure 3. Comparison of near fault ground motion displacement time histories of the station TCU068 processed by the method proposed in this study with those from Pacific Earthquake Engineering Research Center
(a) NS component;(b) EW component;(c) UD component
![]()
图 4 上盘台站强震动记录三分量EW (左),NS (中),UD (右)分量的位移时程
蓝线表示位移的最值,红线表示位移初始值或最终值,下图同
Figure 4. Displacement time histories of EW (left),NS (middle) and UD (right) components of strong ground motion records at the hanging wall stations
The blue line indicates the extreme displacement,and the red line indicates the initial or final displacement,the same below (c) TCU072;(d) TCU071;(e) TCU089;(f) TCU078
![]()
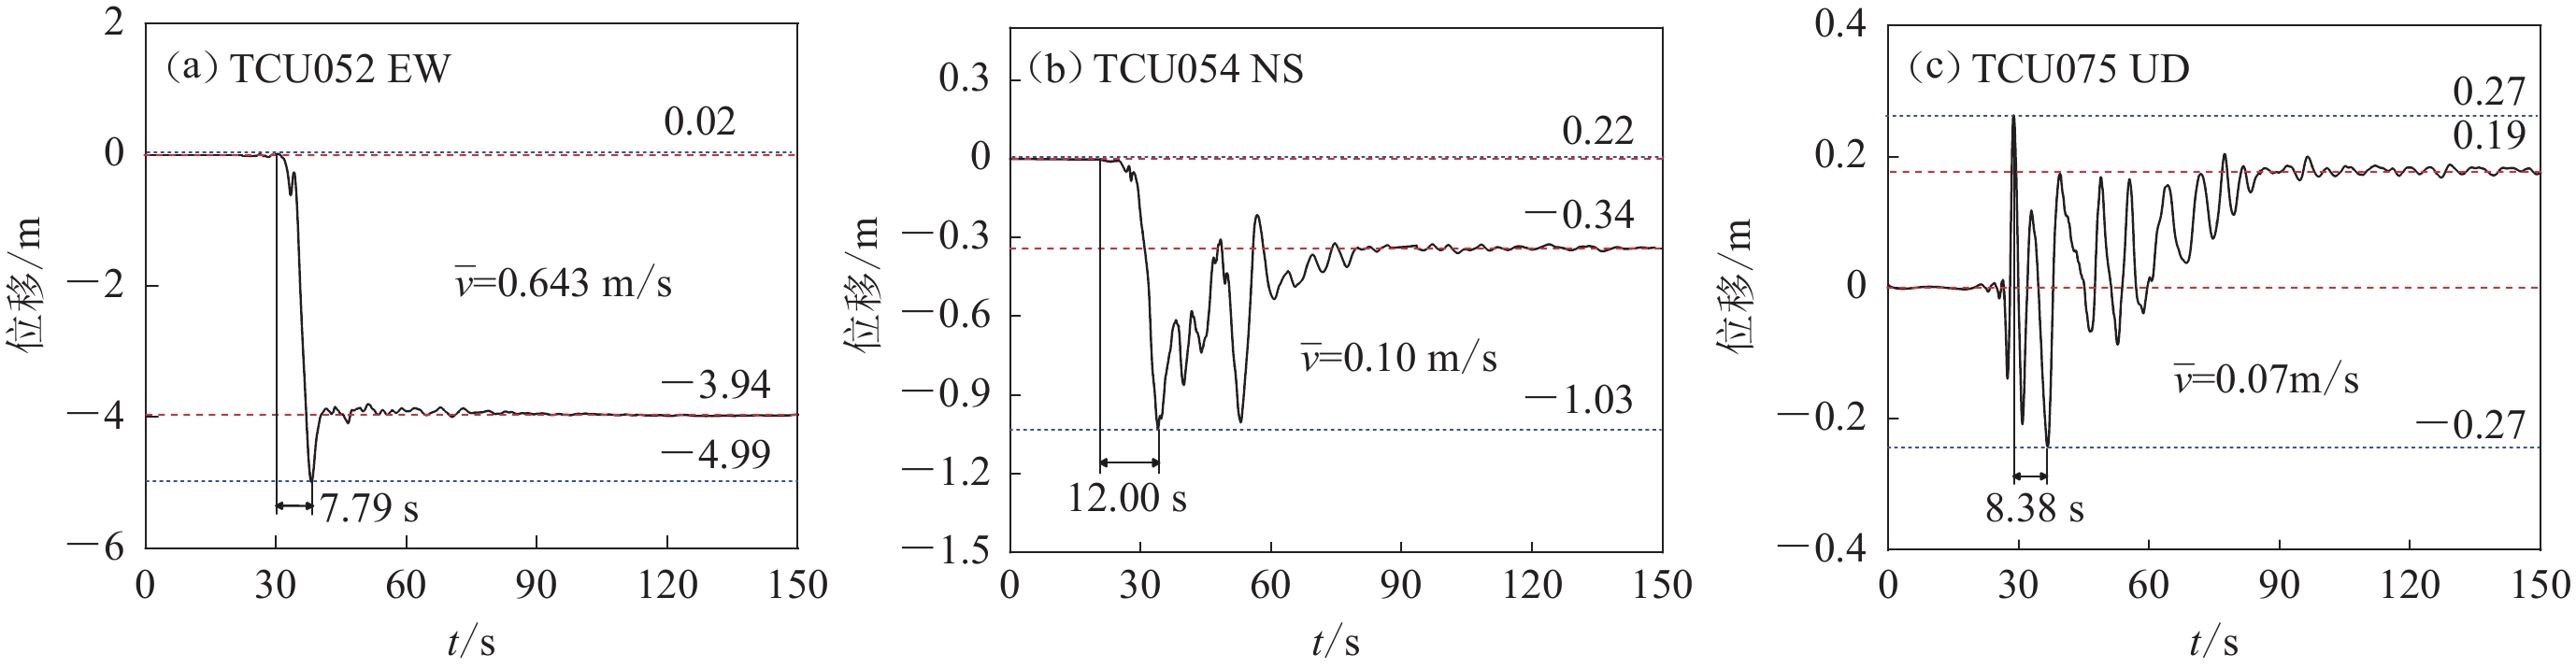
图 5 强震动位移时程形态典型特征
(a) TCU052台站EW分量;(b) TCU054台站NS分量;(c) TCU075台站UD分量
Figure 5. Typical characteristics of strong ground motion displacement time histories
(a) EW component at the station TCU052;(b) NS component at the station TCU054;(c) UD component at the station TCU075
![]()
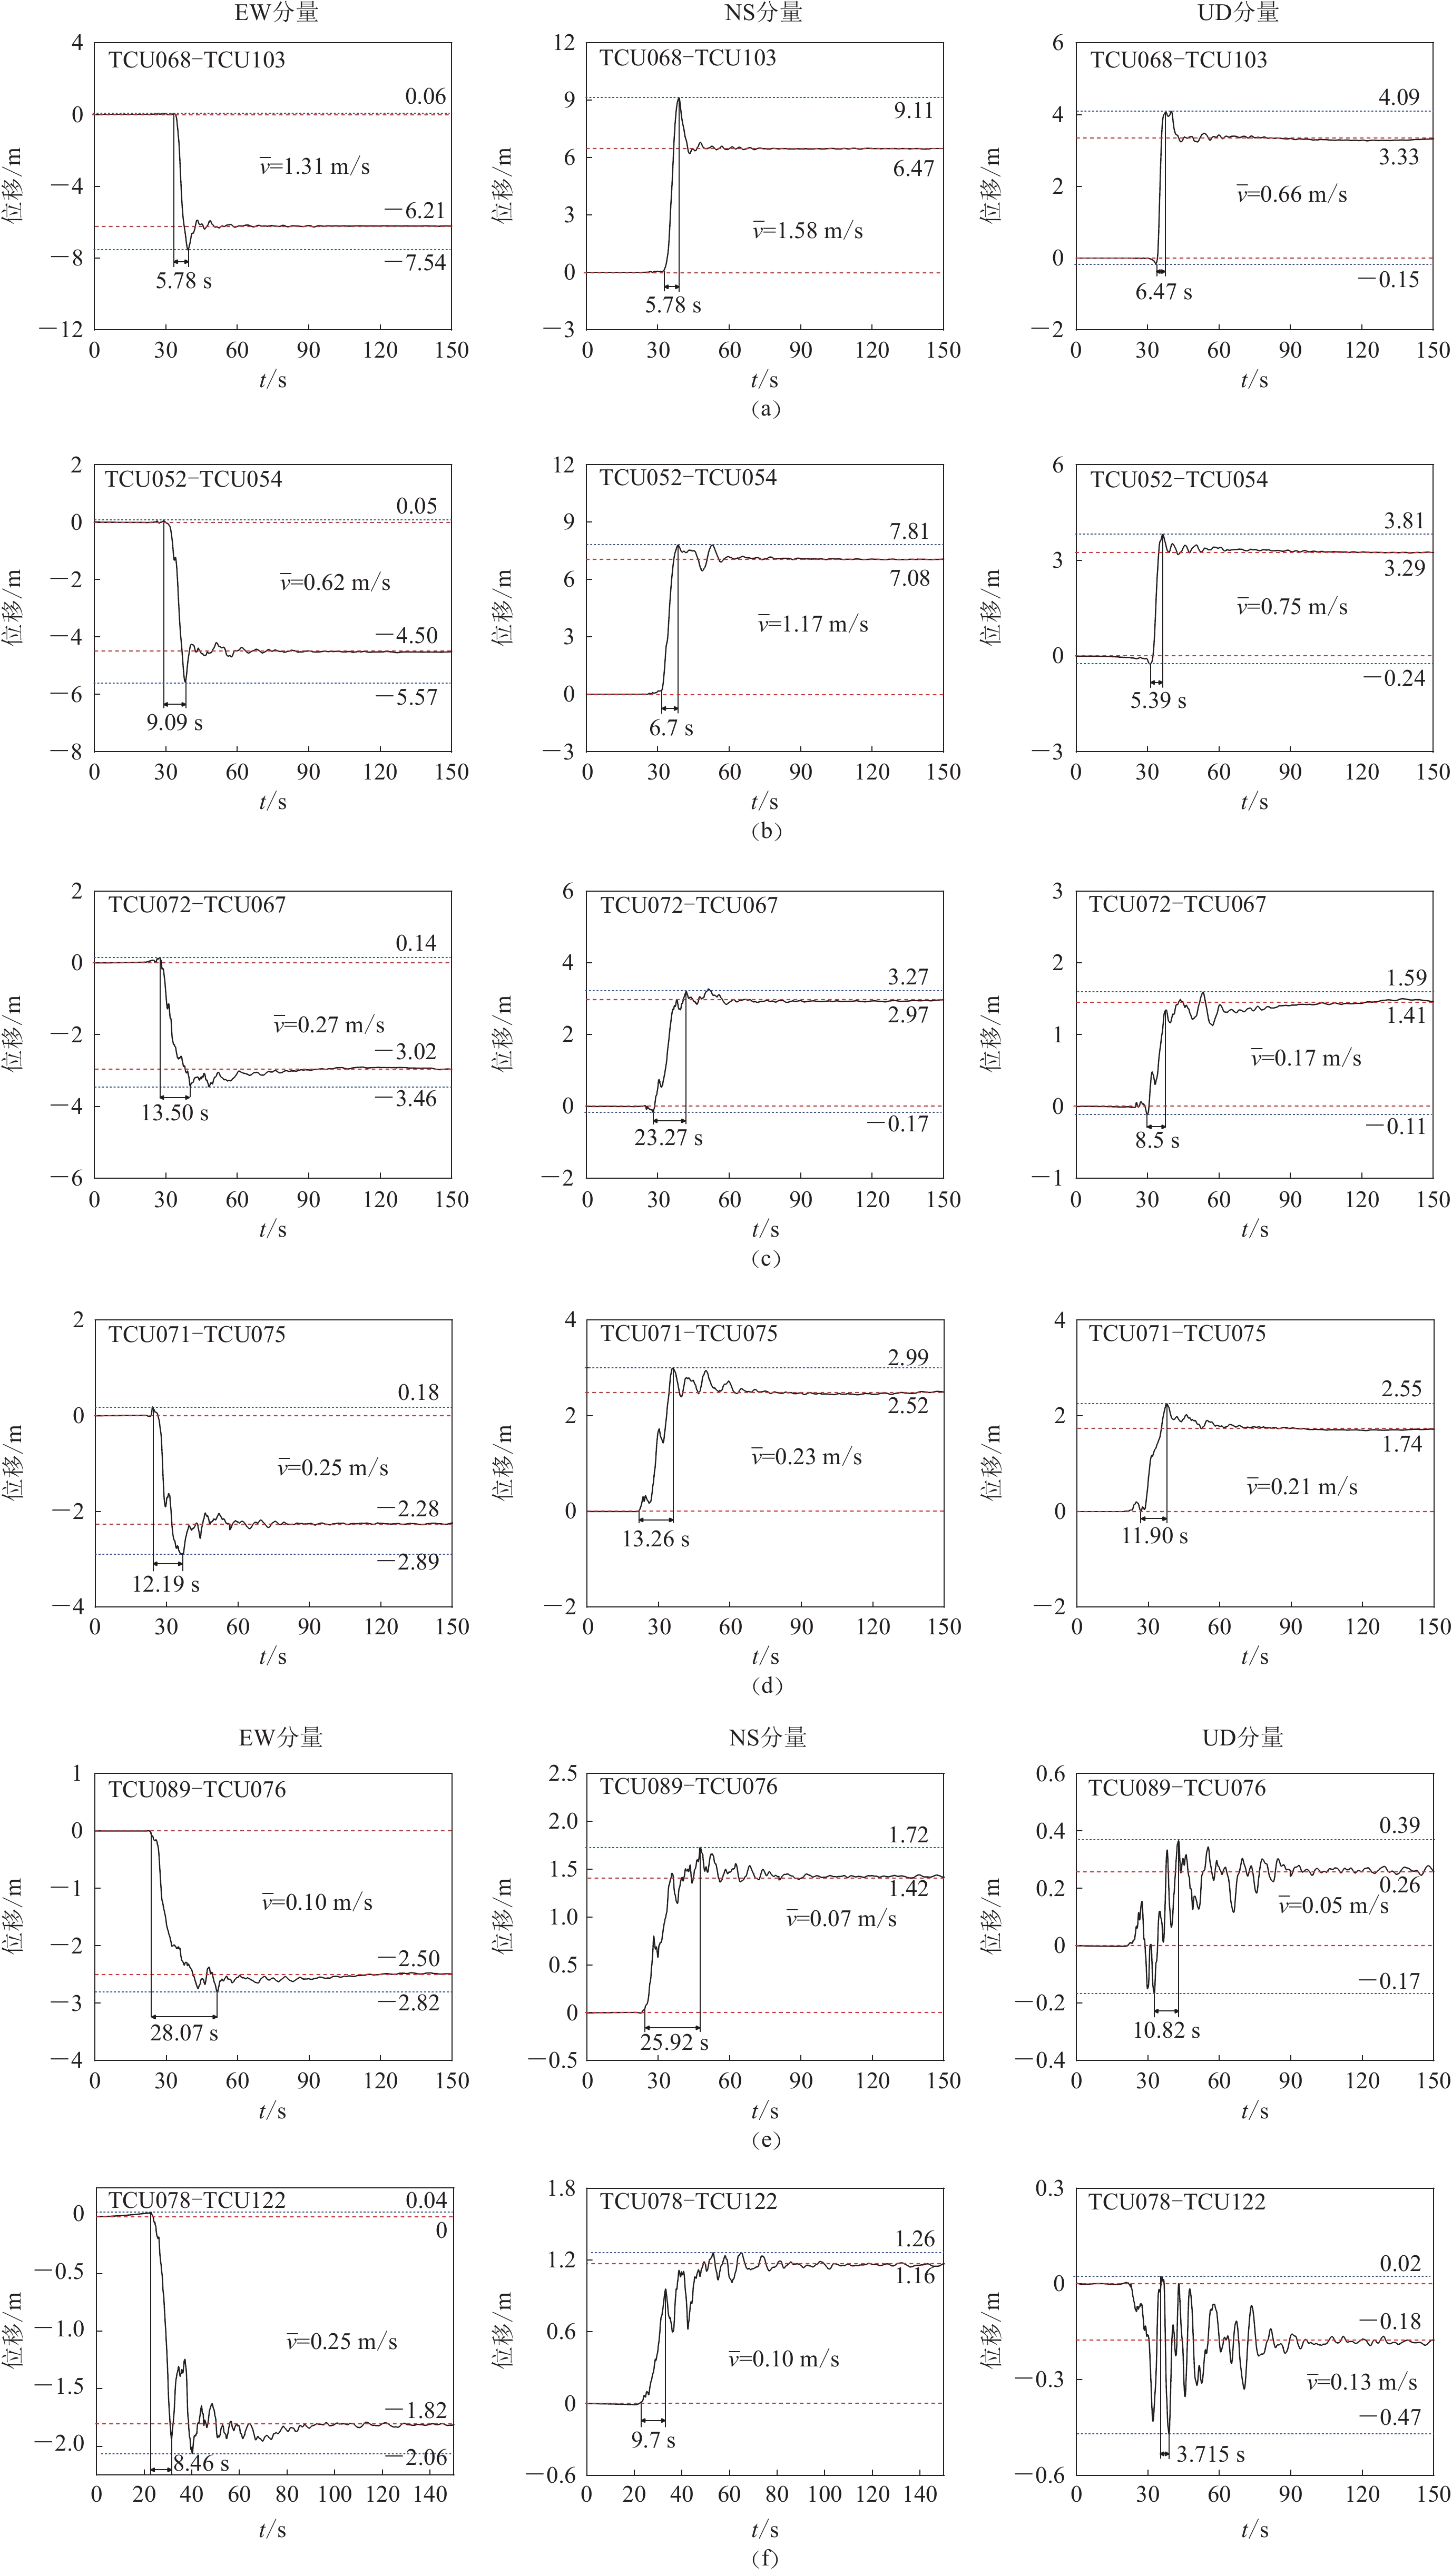
图 6 六对上、下盘台站的EW (左),NS (中)和UD (右)分量的相对位移时程
Figure 6. The relative displacement time history of EW (left),NS (middle),and UD (right) components of the six pairs of the hanging wall and footwall stations
(e) TCU089-TCU076;(f) TCU078-TCU122
![]()
图 7 上下盘台站最大相对位移与相对残余位移关系
Figure 7. Relationship between maximum relativedisplacement and relative residual displacement of hanging wall and footwall stations
![]()
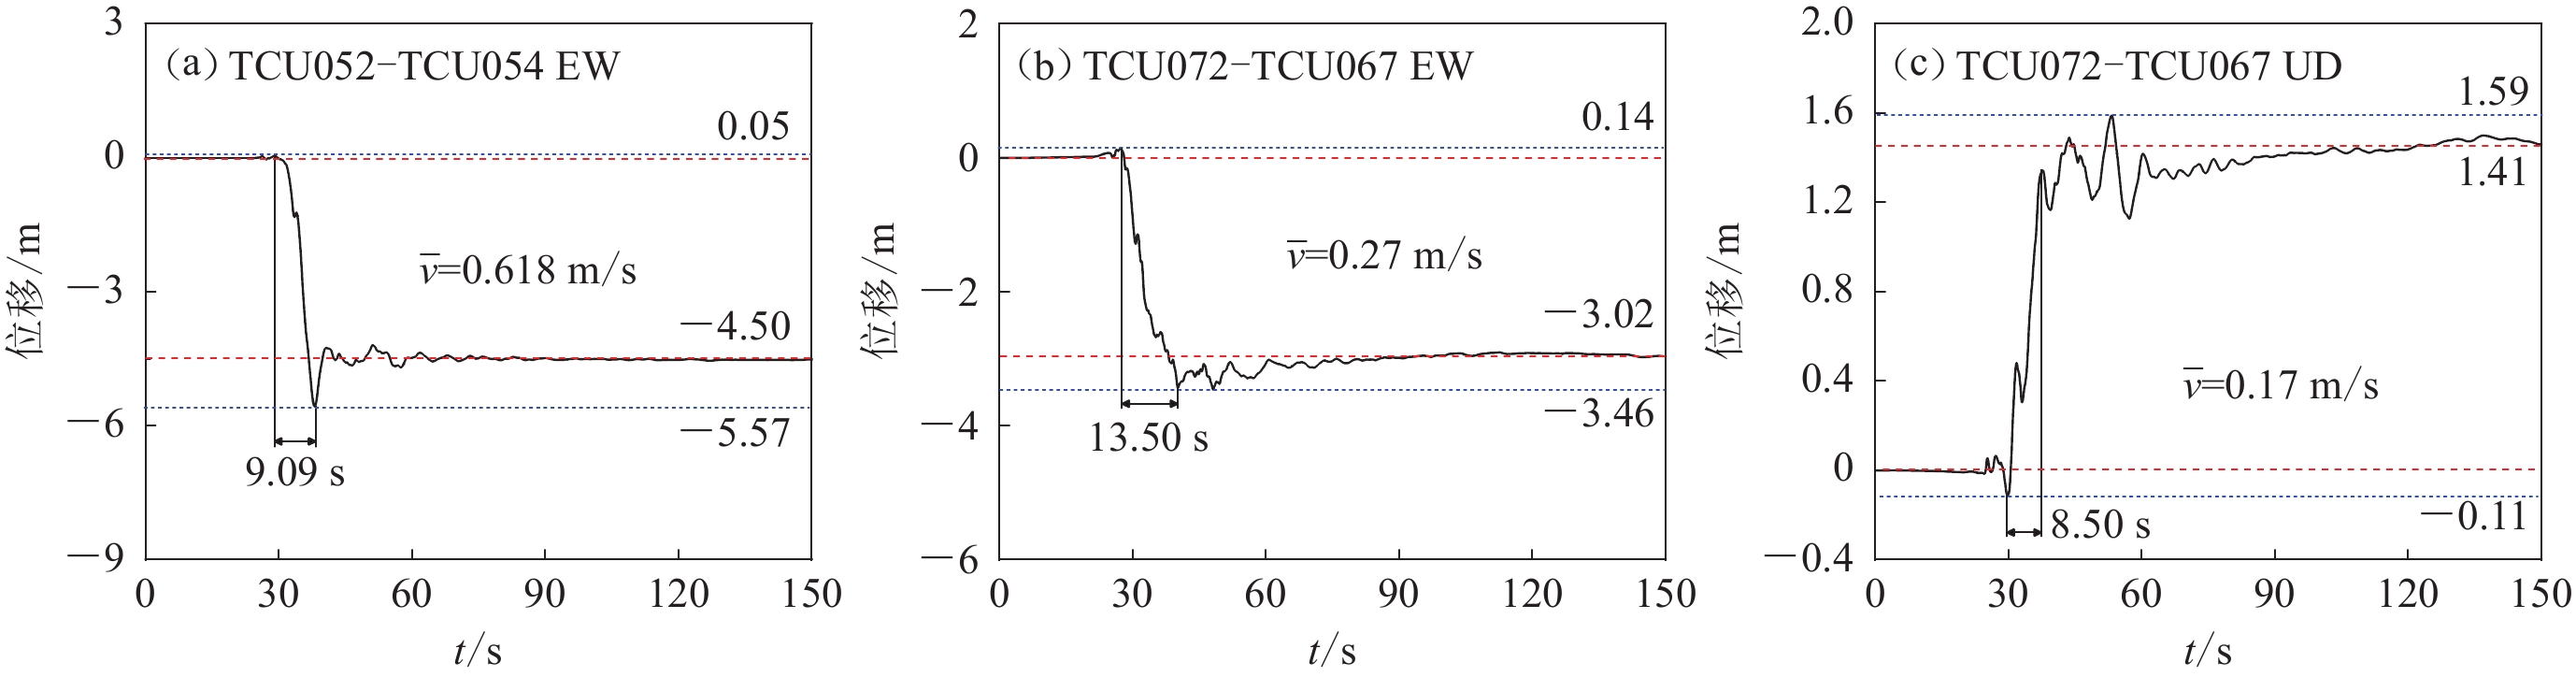
图 8 上、下盘台站强震动相对位移时程典型特征
(a) TCU052-TCU054台站的EW分量;(b) TCU072-TCU067台站的EW分量;(c) TCU072-TCU067台站的UD分量
Figure 8. Typical characteristics of relative displacement time history of strong ground motion records at hanging wall and footwall stations
(a) EW component of the station TCU052-TCU054;(b) EW component of the station TCU072-TCU067;(c) UD component of the station TCU072-TCU067
![]()
图 9 集集地震土木工程断层破坏7例
(a) 石岗大坝(TCU068-TCU103);(b) 北丰桥(TCU068-TCU103);(c) 欢乐谷公寓群(TCU068-TCU103);(d) 第一公园大桥(TCU052-TCU054);(e) 光复中学(TUC071-TCU075);(f) 乌溪桥(TUC071-TCU075);(g) 刘眉桥(TCU078-TCU122)
Figure 9. Seven cases of civil engineering fault failure in Chi-Chi earthquake
(a) Shigang Dam (TCU068-TCU103);(b) Beifeng Bridge (TCU068-TCU103);(c) Happy Valley Apartments (TCU068-TCU103);(d) The First Park Bridge (TCU052-TCU054);(e) Guangfu Middle School (TUC071-TCU075);(f) Wuxi Bridge (TUC071-TCU075);(g) Liumei Bridge (TCU078-TCU122)
![]()
图 10 四对上、下盘台站的空间相对位移时程
Figure 10. Spatial relative displacement time histories of the four pairs of hanging wall and footwall stations
(a) TCU068-TCU103;(b) TCU052-TCU054;(c) TCU071-TCU075;(d) TCU078-TCU122
![]()
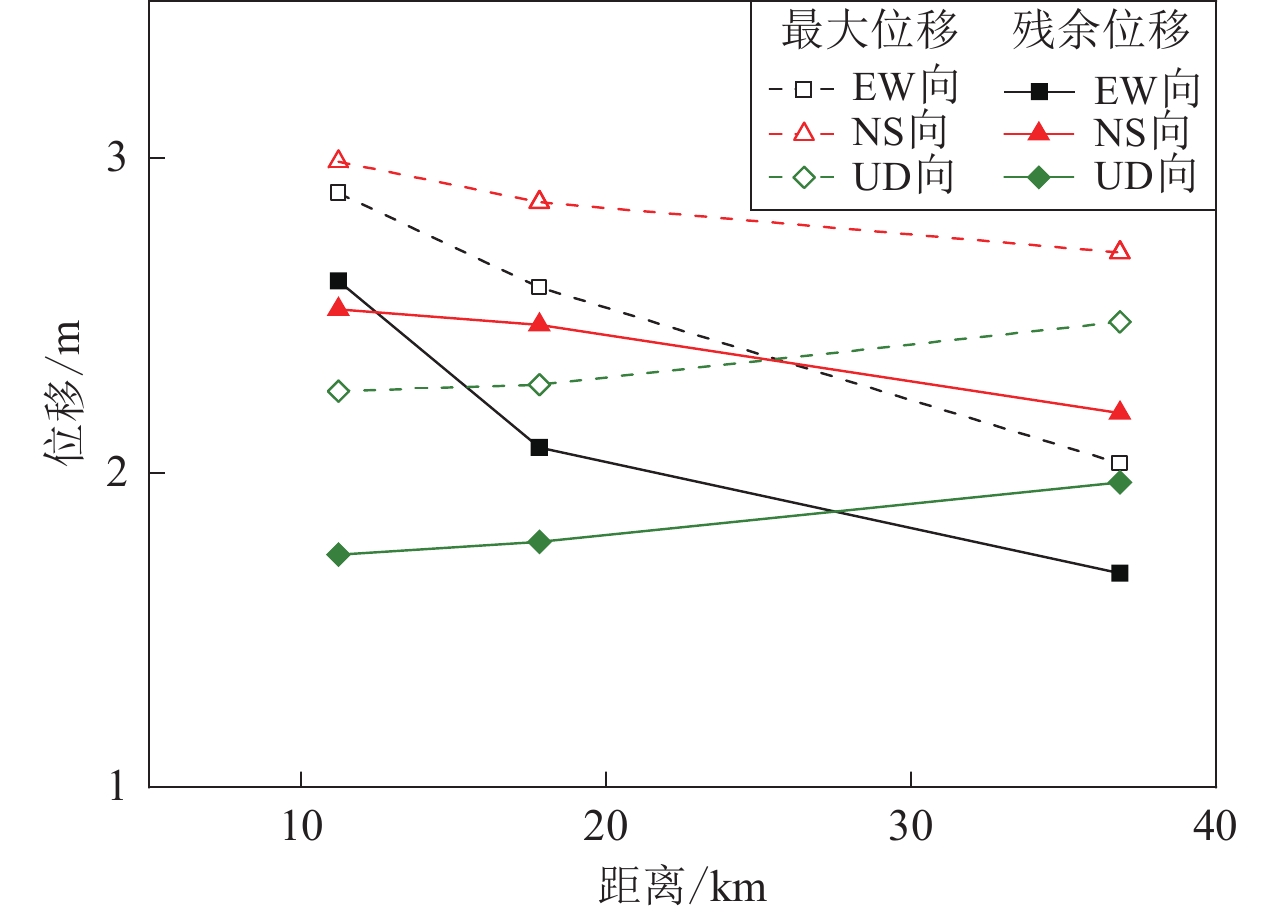
图 11 跨断层场点间相对位移与场点间距的关系
Figure 11. Relationship between relative displacement and field spacing across fault sites
![]()
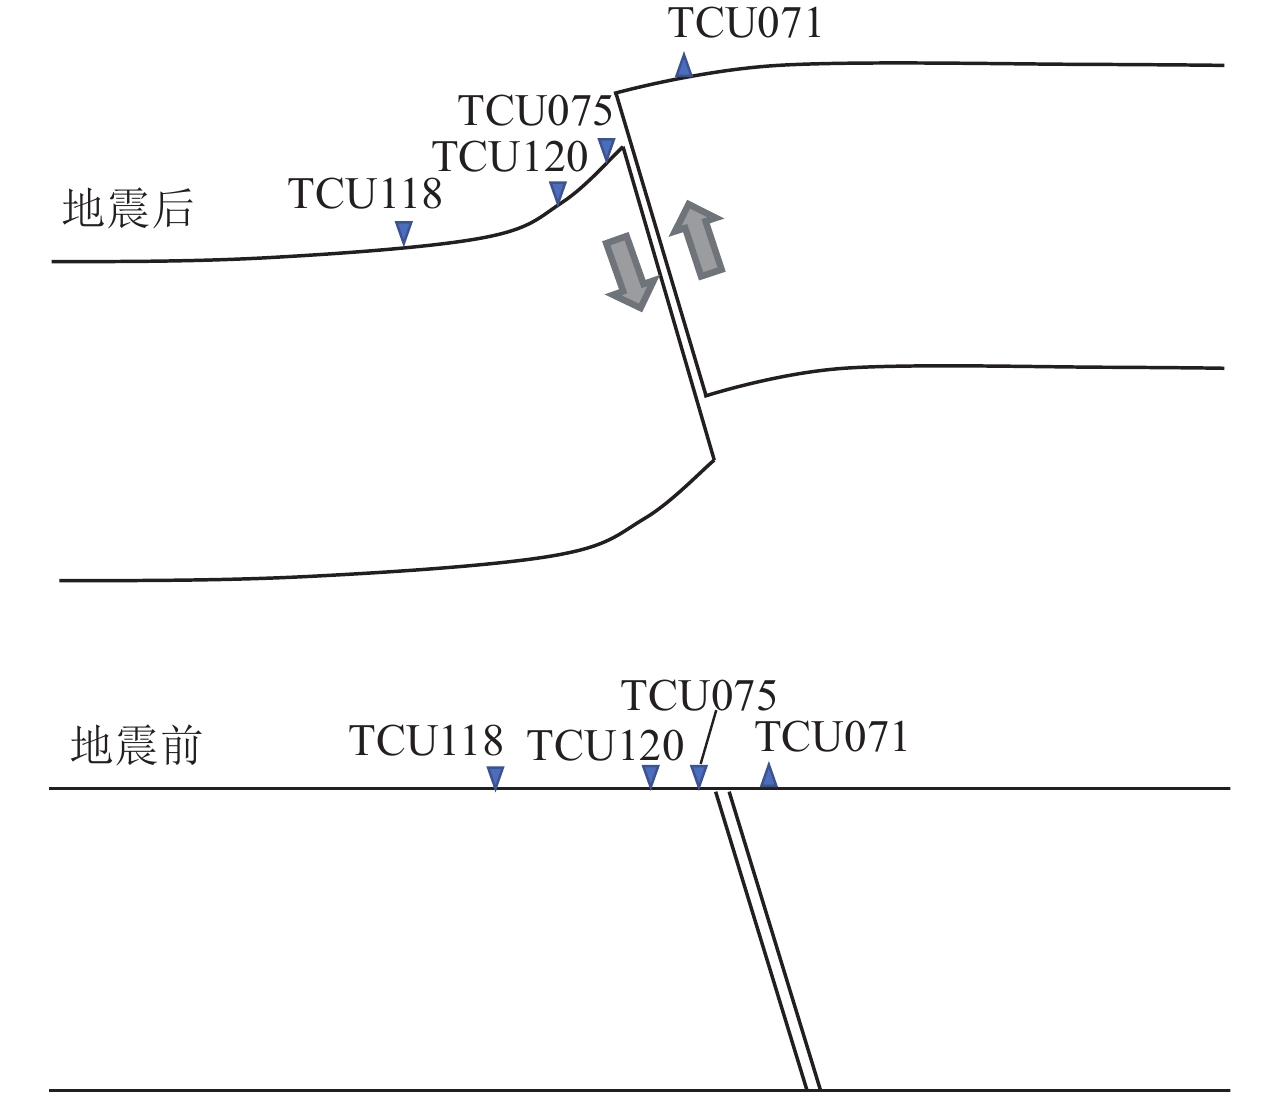
图 12 逆断层盘间相对位移趋势示意图
Figure 12. Schematic diagram of relative displacement trend between reverse fault walls
表 1 1999年台湾集集MW7.6地震强震动台站位置
Table 1 Location of ground motion stations of 1999 MW7.6 Chi-Chi earthquake in Taiwan region
断层盘 台站 东经/° 北纬/° 海拔/km 断层距/km 上盘 TCU068 120.8 24.3 0.276 0.071 TCU052 120.7 24.2 0.170 0.092 TCU072 120.8 24.0 0.363 13.021 TCU071 120.8 24.0 0.187 10.003 TCU089 120.9 23.9 0.020 15.277 TCU078 120.8 23.8 0.272 14.402 下盘 TCU103 120.7 24.3 0.222 5.982 TCU054 120.7 24.2 0.097 7.029 TCU067 120.7 24.1 0.073 0.716 TCU075 120.7 24.0 0.096 1.209 TCU120 120.6 24.0 0.228 7.793 TCU118 120.4 24.0 0.008 30.496 TCU076 120.7 24.0 0.103 3.653 TCU129 120.7 23.9 0.110 3.059 TCU122 120.6 23.8 0.075 10.996 CHY024 120.6 23.8 0.085 12.255 注:数据来源于台湾气象厅公开发行的光盘( Lee et al,2001 )。 下载: 导出CSV
表 2 1999年集集MW7.6地震上、下盘台站本文所选组对情况
Table 2 Group matching of hanging wall and footwall stations of the 1999 MW7.6 Chi-Chi earthquake in this paper
台站 组队 上盘 TCU068 TCU052 TCU072 TCU071 TCU089 TCU078 下盘 TCU103 TCU054 TCU067 TCU075 TCU075 TCU122
下载: 导出CSV
表 3 上盘台站强震动记录位移最大值及残余位移
Table 3 Maximum displacement and residual displacement of strong ground motion records at the hanging wall stations
上盘台站 EW分量 NS分量 UD分量 最大位移/m 残余位移/m 最大位移/m 残余位移/m 最大位移/m 残余位移/m TCU068 7.06 5.81 8.61 5.94 4.52 3.45 TCU052 4.99 3.94 7.18 6.78 3.92 3.16 TCU072 2.02 1.80 2.35 2.00 1.33 1.16 TCU071 1.76 1.19 2.61 0.15 2.26 1.74 TCU089 1.91 1.81 1.37 1.18 0.24 0.03 TCU078 1.21 1.19 0.85 0.66 0.35 0.25
下载: 导出CSV
表 4 六对上、下盘台站强震动相对位移最大值及相对残余位移
Table 4 The maximum relative displacement and relative residual displacement of strong ground motion records at six pairs of hanging wall and footwall stations
上、下盘台站 EW分量 NS分量 UD分量 最大相对位移/m 相对残余位移/m 最大相对位移/m 相对残余位移/m 最大相对位移/m 相对残余位移/m TCU068-TCU103 7.54 6.21 9.11 6.47 4.09 3.33 TCU052-TCU054 5.57 4.50 7.81 7.08 3.81 3.29 TCU072-TCU067 3.46 3.02 3.27 2.97 1.59 1.41 TCU071-TCU075 2.89 2.28 2.99 2.52 2.55 1.74 TCU089-TCU076 2.82 2.50 1.72 1.42 0.39 0.26 TCU078-TCU122 2.06 1.82 1.26 1.16 0.35 0.18
下载: 导出CSV
表 5 工程破坏现场地表位错与附近断层上、下盘台站位错计算值的比较
Table 5 Comparison of calculated values of surface dislocations at the site of engineering failure with those at the hanging wall and footwall stations nearby faults
工程名称 上、下盘台站 台站间距/km 位错观察值/m 位错计算值/m 数据记录方向 石岗大坝 TCU068-TCU103 6.05 8.00 3.33 上下 北丰桥 5.50 上下 欢乐谷公寓群 3.50 上下 第一公园大桥 TCU052-TCU054 7.12 4.00 3.29 上下 光复中学 TCU071-TCU075 11.21 2.50 1.74 上下 乌溪桥 2.00 2.61 水平 刘眉桥 TCU078-TCU122 25.40 0.20 0.18 上下
下载: 导出CSV
-
曹志磊,周琼,葛计划,孙军,隆爱军,龙剑锋,赵希磊. 2019. 郯庐断裂带安徽段及“霍山窗”断层活动特征与地震关联性研究[J]. 大地测量与地球动力学,39(7):681–685. Cao Z L,Zhou Q,Ge J H,Sun J,Long A J,Long J F,Zhao X L. 2019. Fault activity and correlation study of Tan-Lu fault zone and “Huoshan Seismic Window"[J]. Journal of Geodesy and Geodynamics,39(7):681–685 (in Chinese).
陈勇,陈鲲,俞言祥. 2007. 用集集主震记录研究近断层强震记录的基线校正方法[J]. 地震工程与工程振动,27(4):1–7. doi: 10.3969/j.issn.1000-1301.2007.04.001 Chen Y,Chen K,Yu Y X. 2007. Base line correction method for near-fault accelerograms using Chi-Chi main shock record[J]. Journal of Earthquake Engineering and Engineering Vibration,27(4):1–7 (in Chinese).
高波,王峥峥,袁松,申玉生. 2009. 汶川地震公路隧道震害启示[J]. 西南交通大学学报,44(3):336–341. Gao B,Wang Z Z,Yuan S,Shen Y S. 2009. Lessons learnt from damage of highway tunnels in Wenchuan earthquake[J]. Journal of Southwest Jiaotong University,44(3):336–341 (in Chinese).
胡进军. 2009. 近断层地震动方向性效应及超剪切破裂研究[D]. 哈尔滨: 中国地震局工程力学研究所: 126–133. Hu J J. 2009. Directivity Effect of Near-Fault Ground Motion and Super-Shear Rupture[D]. Harbin: Institute of Engineering Mechanics, China Earthquake Administration: 126–133 (in Chinese).
胡聿贤. 2006. 地震工程学[M]. 第二版. 北京: 地震出版社: 13–14. Hu Y X. 2006. Earthquake engineering[M]. Second edition. Beijing: Seismological Press: 13–14 (in Chinese).
黄润秋,李为乐. 2009. 汶川大地震触发地质灾害的断层效应分析[J]. 工程地质学报,17(1):19–28. Huang R Q,Li W L. 2009. Fault effect analysis of geo-hazard triggered by Wenchuan earthquake[J]. Journal of Engineering Geology,17(1):19–28 (in Chinese).
李爽,周洪圆,刘向阳,贾俊峰. 2020. 基于中国规范的近断层区抗震设计谱研究[J]. 建筑结构学报,41(2):7–12. Li S,Zhou H Y,Liu X Y,Jia J F. 2020. Study on near-fault seismic design spectra based on Chinese Code for Seismic Design of Buildings[J]. Journal of Building Structures,41(2):7–12 (in Chinese).
王栋,谢礼立,胡进军. 2008. 倾斜断层不对称分布引起的几何效应:上下盘效应[J]. 地震学报,30(3):271–278. doi: 10.3321/j.issn:0253-3782.2008.03.006 Wang D,Xie L L,Hu J J. 2008. Geometric effects resulting from the asymmetry of dipping fault:Hanging wall/footwall effects[J]. Acta Seismologica Sinica,30(3):271–278 (in Chinese).
王永安,李琼,刘强. 2011. 跨断层形变累积率的变化特征与云南地区强震[J]. 地震研究,34(2):136–142. Wang Y A,Li Q,Liu Q. 2011. Variation of the cumulative rate of cross-fault deformation and strong earthquakes in Yunnan[J]. Journal of Seismological Research,34(2):136–142 (in Chinese).
谢礼立,徐龙军,陶晓燕,杨绪剑. 2021. 跨断层土木工程研究与实验装置研发现状[J]. 工程力学,38(4):20–29. Xie L L,Xu L J,Tao X Y,Yang X J. 2021. Research status of civil engineering structures across faults and the development of experimental devices for fault simulation[J]. Engineering Mechanics,38(4):20–29 (in Chinese).
喻畑,李小军. 2012. 基于NGA模型的汶川地震区地震动衰减关系[J]. 岩土工程学报,34(3):552–558. Yu T,Li X J. 2012. Attenuation relationship of ground motion for Wenchuan earthquake region based on NGA model[J]. Chinese Journal of Geotechnical Engineering,34(3):552–558 (in Chinese).
俞言祥,高孟潭. 2001. 台湾集集地震近场地震动的上盘效应[J]. 地震学报,23(6):615–621. Yu Y X,Gao M T. 2001. Effects of the hanging wall and footwall on peak acceleration during the Jiji (Chi-Chi),Taiwan Province,earthquake[J]. Acta Seismologica Sinica,14(6):654–659.
张红艳,谢富仁. 2013. 天山地区跨断层形变观测与地壳应力特征[J]. 西北大学学报(自然科学版),43(4):617–622. Zhang H Y,Xie F R. 2013. Cross-fault deformation observation and characteristics of crustal stress in Tianshan region[J]. Journal of Northwest University (Natural Science Edition),43(4):617–622 (in Chinese).
周云好,陈章立,缪发军. 2004. 2001年11月14日昆仑山口西MS8.1地震震源破裂过程研究[J]. 地震学报,26(增刊):9–20. Zhou Y H,Chen Z L,Miao F J. 2004. Source process of the 14 November 2001westhern Kunlun mountain MS8.1 earthquake[J]. Acta Seismological Sinica,26(S1):9–20 (in Chinese).
Abrahamson N A. 2000. Near-fault ground motions from the 1999 Chi-Chi earthquake[C]//Proc. of US-Japan Workshop on the Effects of Near-Field Earthquake Shaking. San Francisco, California: Pacific Earthquake Engineering Research Center: 11−13.
Bolt B A. 1999. Earthquakes[M]. Fourth edition. New York: W.H. Freeman and Company: 52–53.
Boore D M. 2001. Effect of baseline corrections on displacements and response spectra for several recordings of the 1999 Chi-Chi,Taiwan,earthquake[J]. Bull Seismol Soc Am,91(5):1199–1211.
Bray J D,Rodriguez-Marek A. 2004. Characterization of forward-directivity ground motions in the near-fault region[J]. Soil Dyn Earthq Eng,24(11):815–828. doi: 10.1016/j.soildyn.2004.05.001
Chao W A,Wu Y M,Zhao L. 2009. An automatic scheme for baseline correction of strong-motion records in coseismic deformation determination[J]. J Seismol,14(3):495–504.
Chu D B, Brandenberg S J, Lin P S. 2008. Performance of bridges in liquefied ground during 1999 Chi-Chi earthquake[C]//The 14th WCEE. Beijing: CAEE and IAEE: 13–17.
Dong J J, Wang C D, Lee C T, Liao J J, Pan Y W. 2004. The influence of surface ruptures on building damage in the 1999 Chi-Chi earthquake: A case study in Fengyuan City[J]. Engineering Geology, 71(1/2): 157–179.
Iwan W D,Moser M A,Peng C Y. 1985. Some observations on strong motion earthquake measurement using a digital accelerograph[J]. Bull Seismol Soc Am,75(5):1225–1246. doi: 10.1785/BSSA0750051225
Kawashima K. 2002. Damage of bridges resulting from fault rupture in the 1999 Kocaeli and Duzce, Turkey earthquakes and the 1999 Chi-Chi, Taiwan earthquake[J]. Structural Eng/Earthq Eng, 19(2 Special Issue): 179−197.
Lee W H K, Shin T C, Kuo K W, Chen K C, Wu C F. 2001. CWB free-field strong-motion data from the 21 September Chi-Chi, Taiwan, earthquake[J]. Bull Seismol Soc Am, 91(5): 1370−1376.
Lin M L,Lin C H,Li C H,Liu C Y,Hung C H. 2021. 3D modeling of the ground deformation along the fault rupture and its impact on engineering structures:Insights from the 1999 Chi-Chi earthquake,Shigang District,Taiwan[J]. Eng Geol,281:105993. doi: 10.1016/j.enggeo.2021.105993
Ma K F,Mori J,Lee S J,Yu S B. 2001. Spatial and temporal distribution of slip for the 1999 Chi-Chi,Taiwan earthquake[J]. Bull Seismol Soc Am,91(5):1069–1087.
Mccomb H,Ruge A,Neumann F. 1943. The determination of true ground motion by integration of strong-motion records:A symposium[J]. Bull Seismol Soc Am,33(1):1. doi: 10.1785/BSSA0330010001
Ota Y,Watanabe M,Suzuki Y,Yanagida M,Miyawaki A,Sawa H. 2007. Style of the surface deformation by the 1999 Chichi earthquake at the central segment of Chelungpu fault,Taiwan,with special reference to the presence of the main and subsidiary faults and their progressive deformation in the Tsauton area[J]. J Asia Earth Sci,31(3):214–225. doi: 10.1016/j.jseaes.2006.07.030
Somerville P G,Smith N F,Graves R W,Abrahamson N A. 1997. Modification of empirical strong ground motion attenuation relations to include the amplitude and duration effects of rupture directivity[J]. Seismol Res Lett,68(1):199–222. doi: 10.1785/gssrl.68.1.199
Wang G Q,Zhou X Y,Zhang P Z,Igel H. 2002. Characteristics of amplitude and duration for near fault strong ground motion from the 1999 Chi-Chi,Taiwan earthquake[J]. Soil Dyn Earthq Eng,22(1):73–96. doi: 10.1016/S0267-7261(01)00047-1
Wang R J,Schurr B,Milkereit C,Shao Z G,Jin M P. 2011. An improved automatic scheme for empirical baseline correction of digital strong-motion records[J]. Bull Seismol Soc Am,101(5):2029–2044. doi: 10.1785/0120110039
Wang W L,Wang T T,Su J J,Lin C H,Seng C R,Huang T H. 2001. Assessment of damage in mountain tunnels due to the Taiwan Chi-Chi earthquake[J]. Tunn Undergr Space Technol,16(3):133–150. doi: 10.1016/S0886-7798(01)00047-5
Wu Y M, Wu C F. 2007. Approximate recovery of coseismic deformation from Taiwan strong-motion records[J]. J Seismol, 11(2): 159–170.
Xu L J,Zhao G C,Gardoni P,Xie L L. 2018. Quantitatively determining the high-pass filter cutoff period of ground motions[J]. Bull Seismol Soc Am,108(2):857–865. doi: 10.1785/0120170074
Zhao G C,Xu L J,Gardoni P,Xie L L. 2019. A new method of deriving the acceleration and displacement design spectra of pulse-like ground motions based on the wavelet multi-resolution analysis[J]. Soil Dyn Earthq Eng,119:1–10. doi: 10.1016/j.soildyn.2019.01.008
-
期刊类型引用(6)
1. 王玮铭,廖晓峰,任越霞. 四川江油台地电场优势方位角异常核实与分析. 四川地震. 2024(01): 7-12 .  百度学术
百度学术
2. 刘海洋,饶文,徐衍刚,艾萨·伊斯马伊力. 2024年1月23日乌什M_S7.1地震前新疆地电优势方位角变化特征分析. 内陆地震. 2024(02): 182-193 . 百度学术
3. 张华美,刘阳,陈祥开,张帆,叶向顶. 翁田台地电场观测受干扰的因素分析. 地震科学进展. 2022(02): 67-76 . 百度学术
4. 王秋宁,李媛媛. 陕西地区地电场典型干扰研究. 山西地震. 2022(02): 22-26+32 . 百度学术
5. 王宇,谭大诚,邱大琼,张锋,陈亮. 2020年新疆于田M_S6.4地震和田台地电场异常的测道差异性. 地震. 2021(02): 180-189 . 百度学术
6. 辛建村,张晨蕾. 漾濞县M_S6.4、玛多县M_S7.4地震前地电场变化分析. 地震工程学报. 2021(04): 818-825 . 百度学术
其他类型引用(1)


计量
- 文章访问数: 420
- HTML全文浏览量: 102
- PDF下载量: 109
- 被引次数: 7
