

Time problems of recorded data in artificial source ocean bottom seismometer exploration and cause analyses
-
摘要: 简要概括了国产主动源海底地震仪(OBS)数据处理中常见的时间异常现象,以OBS2020-1测线的实际处理为主并结合了OBS处理中对数据异常校正取得的部分进展为实例,通过检查数据记录格式、计算相邻数据文件间的时间差、对比不同处理方法所得剖面、分析初始时间和采样时间是否异常、使用数据重采样等手段,对OBS时间异常问题进行了分类处理和校正。分析显示,国产OBS在数据记录中普遍存在的时间问题大部分均能解决,通过本文提供的方法可以避免处理不当所导致的OBS地震剖面出现同相轴“断阶”、“倾斜”,甚至“缺失”等现象,确保了有效震相的完整性,有效解决了OBS数据时间异常问题,提高了数据的质量和利用率,为后续开展走时层析成像奠定了良好的基础,并为今后主动源OBS数据处理流程和方法提供了借鉴。
-
关键词:
- 海底地震仪(OBS) /
- 时间异常 /
- 震相 /
- 采样间隔 /
- 数据处理
Abstract: Artificial source seismic exploration based on ocean bottom seismometer (OBS) is one of the most effective methods to study the structure of crust and mantle, the seismogenic structure and the submarine mineral resources. In modeling velocity structure, the precise time measurements of recorded data by OBS are the key to ensure the reliability of velocity structure. However, in practical work, OBS placed at the seafloor directly, which is unable to acquire accurate time with the satellite navigation system in time, leads to time error of the recorded data, and its oscillation frequency of the quartz is easily affected by temperature, pressure, instrument properties, etc. Therefore, it is necessary to analyze the reasons of clock errors in the process of data processing to obtain the exact time. The common time errors in Chinese artificial source OBSs data processing were briefly summarized in this study, focusing on the processing of profile OBS2020-1 and combining the other previous correction examples. OBS time problems were classified and corrected through checking the data record format, calculating the time error between the adjacent data files, comparing the difference of profiles obtained by different processing methods, analyzing whether the initial time and sampling time are abnormal, using resample and other methods. The analysis shows that most of the time errors commonly existing in the data records of Chinese OBS can be solved, and the method provided in this paper can avoid “stair” , “incline” , even “missing” of the events in OBS seismic profiles caused by improper handling. It ensures the integrity of the effective seismic phase, and effectively solves the problem of time error of OBS data to improve the quality and utilization of data. This study establishes a good foundation for traveltime tomography, and provides a reference for the processing process and methods of artificial source OBS in the future.-
Keywords:
- ocean bottom seismometer (OBS) /
- time error /
- seismic phase /
- sampling interval /
- data processing
-
引言
地震是一种危害性极强的自然灾害,是在构造应力作用下断层上的应变不断积累达到极限后失稳破裂的结果。钻孔应变仪能够探测到岩石破裂前的微小应力载荷变化(邱泽华等,2021),因此钻孔应变观测既能记录长周期应变变化,又能提供高频的应变信息,是地震前兆研究的基础(邱泽华,2017)。钻孔应变仪的安装位置决定了其在应变观测过程中会受到固体潮、气压和水位等环境因素的影响(池成全,2020;于紫凝,2021;吉林大学,2022)。固体潮是地球在日月引力的作用下产生的周期形变,是钻孔应变观测数据中含有日波、半日波等周期变化的主要原因;气压对应变的影响主要是相对短周期内的简单弹性变化,是即时负相关的,可以分为周期性干扰和无周期规律的高频干扰;受地下水、降雨量等影响,钻孔水位变化会引起孔隙水压力变化,对应变数据产生即时负相关的影响。固体潮引起的应变在10−8—10−9量级,气压引起的应变量级为10−9,水位引起的应变量级有时可以达到10−5 (杨少华等,2016;邱泽华,2017;池成全,2020;于紫凝,2021;吉林大学,2022;娄家墅,田家勇,2022)。因此,从钻孔应变观测数据中去除环境引起的应变响应对于提取地震前兆异常有重要意义。
目前已经有很多学者对环境响应去除和震前异常提取展开过研究,例如:刘琦和张晶(2011)、邱泽华等(2009),周龙寿等(2009)采用高通滤波去除低频信号后,使用超限率分析法分析震前异常;Chi等(2019)采用变分模态分解将应变信号分解为五个本征模态函数,通过对比分析确定第三个为地壳短周期变化的应变分量;Yu等(2021)用卡尔曼滤波求解状态空间模型,得到了地壳应变和多个环境参数。这些研究使用分解滤波或状态空间模型方法去除环境响应,通过时、频域的幅度异常进行震前异常提取。然而,卡尔曼滤波求解环境响应时引入太多参数,计算过程复杂且很难保证结果的准确性;滤波法和分解法去除环境响应缺少对环境监测数据的充分利用;用幅度异常提取震前异常时,幅度易受到突发性干扰或噪声等偶然因素的影响。
本文拟采用时间序列分解法去除长期趋势和以固体潮为主的周期趋势,通过多通道奇异谱分析法去除气压和水位的应变响应。去除环境响应后,利用负熵进行地震异常提取,并与贝尼奥夫(Benioff)应变累积以及应变差分法进行对比,总结本文算法的优势。
1. 钻孔应变数据的环境响应去除和震前异常提取算法
1.1 钻孔应变观测
本文的应变数据来自YRY-4型分量式钻孔应变仪,分辨率高达10−10,有四个水平放置的传感器,在圆柱形外壳内以45°间隔排列,用于测量钻孔直径的变化。YRY-4型钻孔应变仪的自洽方程为
$$ {S_{ 1}} + {S_{ 3}}= {S_{ 2}} + {S_{ 4}} \text{,} $$ (1) 可体现四个传感器的测量值S1,S2,S3,S4之间的简单关系(邱泽华,2017),可以用来估计数据的可信度。考虑到平面应变状态只有三个独立分量,通常用三个间接观测量代替四个直接观测量(邱泽华,2017):
$$ \left\{ \begin{array}{l} {S_{ 13}} = {S_{ 1}} - {S_{ 3}} \text{,} \\ {S_{ 24}} = {S_{ 2}} - {S_{ 4}} \text{,} \\ {S_{\mathrm{ a}}} = \dfrac { ( {S_{ 1}} + {S_{ 2}} + {S_{ 3}} + {S_{ 4}} ) }{2}\text{,} \end{array} \right. $$ (2) 式中,S13和S24为两个独立的剪切应变,Sa为面应变。
1.2 时间序列分解法去除趋势
时间序列分解法是将变化复杂的时间序列分解为若干个变化规律的子成分。受长期趋势、周期和季节变动等因素的影响,钻孔应变数据出现了极大的波动,从中可以清晰地观测到固体潮的波形,因此将钻孔应变时间序列分解为长期趋势、周期趋势和余项(柳建菲,2020;赵然杭等,2021,吉林大学,2022),即
$$ Y ( t ) = T ( t ) + S ( t ) + R ( t ) \text{,} $$ (3) 式中:Y (t)为Sa面应变观测数据;T (t)为长期趋势项;S (t)为周期趋势项,是以固体潮为主的周期性应变响应;R (t)为余项,是下一步的待分解数据。分解的步骤为:
1) 局部加权回归法求解长期趋势T (t)。以时间点x为中心,总数据长度的60%为窗宽,作tricube函数加权线性回归,其回归线的中心值即为单点的长期趋势,计算整个钻孔应变时间序列,就得到钻孔应变的长期趋势项T (t)。
2) 周期平均法计算周期趋势S (t)。① 计算去除趋势后的数据
$$ D ( t ) = Y ( t ) - T ( t ) . $$ (4) ② 对$D ( t ) $进行周期分割,相同采样点求平均值,得到周期项$S' ( t ) $:
$$ S' ( t ) ={\displaystyle \sum _{i=0}^{n}{\frac {D ( t + if ) }{n} }}\text{,} $$ (5) 式中:f为数据的周期长度,本文使用的数据周期为1天;n为该段数据的周期数;t为一个周期内的采样点数,本文为
1440 。③ 计算中心化的周期项S (t),即$$ S ( t ) = S' ( t ) - \mu [ S' ( t ) ] \text{,} $$ (6) 式中$\mu [ S' ( t ) ] $为$ S' ( t ) $的均值。
3) Y (t)去除趋势项T (t)和周期项S (t)得到余项R (t)。
1.3 多通道奇异谱分析法去除气压和水位引起的应变响应
奇异谱分析的基本思想是将一维观测数据Y (t)=(y1,···,yT)转化为轨迹矩阵${\boldsymbol{X}} $,即
$${\boldsymbol{ X}} =\left({x_{ij}}\right)_{i\text{,} j = 1}^{L\text{,} K} = \left( {\begin{array}{*{20}{c}} {{y_1}}&{{y_2}}& \cdots &{{y_K}} \\ {{y_2}}&{{y_3}}& \cdots &{{y_{K + 1}}} \\ \vdots & \vdots & \cdots & \vdots \\ {{y_L}}&{{y_{L + 1}}}& \cdots &{{y_T}} \end{array}} \right)\text{,} $$ (7) 其中,L为窗口长度(一般不超过观测数据长度的1/3),K=T−L+1。计算XXT并对其进行奇异值分解,从而得到L个特征值及其相应的特征向量,将每一个特征值所代表的信号进行分析组合,重构出新的时间序列。
多通道奇异谱分析不仅分析信号组本身的特性,而且考虑根据不同测量信号之间的相关性(王雪园,2017),可以利用不同通道信号之间的相关性对数据进行分解(Kojima et al,2020;Yu et al,2020),其步骤与单通道奇异谱分析类似(Groth,Ghil,2011,2015;于紫凝,2021;吉林大学,2022)。本文通过构造钻孔面应变余项R(t)=(r1, ···, rT)、气压P(t)=(p1, ···, pT)和水位W(t)=(w1, ···, wT)三通道测量信号的轨迹矩阵${\boldsymbol{Z}} $,进行多通道奇异谱分析。轨迹矩阵$ {\boldsymbol{Z}}$为
$$ {\boldsymbol{Z}} = \left( \begin{gathered} \begin{array}{*{20}{c}} {{r_1}}&{{r_2}}& \cdots &{{r_K}} \\ {{r_2}}&{{r_3}}& \cdots &{{r_{K + 1}}} \\ \vdots & \vdots & \vdots & \vdots \\ {{r_L}}&{{r_{L + 1}}}& \cdots &{{r_T}} \end{array} \\ \begin{array}{*{20}{c}} {{p_1}}&{{p_2}}& \cdots &{{p_K}} \\ {{p_2}}&{{p_3}}& \cdots &{{p_{K + 1}}} \\ \vdots & \vdots & \vdots & \vdots \\ {{w_L}}&{{w_{L + 1}}}& \cdots &{{w_T}} \end{array} \\ \end{gathered} \right) . $$ (8) 对轨迹矩阵${\boldsymbol{Z}} $进行奇异值分解并重构,得到余项、气压和水位三组分解分量,根据气压、水位与二者自身引起的应变响应具有实时负相关的特征,去除应变余项分解分量中与气压、水位分解分量相关系数小于−0.8的分量,得到重构的去除环境响应后的应变数据。
1.4 地震异常提取
不受强震和环境影响的正常地壳应变是短周期随机信号,服从高斯分布,其分布的负熵为零。当地壳应变信号偏离高斯分布时,负熵增大,数据出现有序、有组织的变化;反之,地壳应变越接近高斯分布,信号越混乱无序,负熵越小(Yu et al,2021)。本文采用通过偏度和峰度近似计算负熵的方法,利用负熵异常分析进行芦山地震的异常提取,式(9)—(11)给出了偏度、峰度、负熵的计算方法:
$$ s_{{\mathrm{k}}} = \dfrac{{\dfrac{1}{N}\displaystyle\sum\limits_{t = 1}^N {{{ ( {x_t} - \overline x ) }^3}} }}{\sqrt{{{\left[ {\dfrac{1}{N}\displaystyle\sum\limits_{t = 1}^N {{{ ( {x_t} - \overline x ) }^2}} } \right]}^{3}}}} \text{,} $$ (9) $$ k_{{\mathrm{u}}} = \dfrac{{\dfrac{1}{N}\displaystyle \sum\limits_{t = 1}^N {{{ ( {x_t} - \overline x ) }^4}} }}{{{{\left[ {\dfrac{1}{N}\displaystyle \sum\limits_{t = 1}^N {{{ ( {x_t} - \overline x ) }^2}} } \right]}^2}}} - 3 \text{,} $$ (10) $$ \begin{split}\\ A_{{\mathrm{Ne}}} ( X ) {\text{≈}} \frac{1}{{12}} {s_{{\mathrm{k}}}^2} ( X ) + \frac{1}{{48}}{k_\mathrm{u}^2} ( X ) \text{,} \end{split} $$ (11) 式中,xt为一天的应变数据,$t=1\text{,} \cdots \text{,} N$,$\overline x $为$x-t $的均值,$A_{{\mathrm{Ne}}} $为负熵。计算每天的负熵值,以2.5倍标准差提取出现负熵异常的天数并累积,观察震前的负熵异常结果。
2. 环境响应去除结果与震前异常提取结果
2.1 地震数据的选取
2013年4月20日8时2分,四川雅安芦山县发生MS7.0地震,震中位于(30.277°N,102.937°E),震源深度约为13 km。四川省姑咱台位于北西向的鲜水河断裂带、北东向的龙门山断裂带和北南向的安宁河断裂带交会的靠北地区,距芦山地震震中仅75 km,姑咱台钻孔应变数据能够充分地反映芦山地震前后地壳应力的变化。图1给出了姑咱台和芦山地震的地理位置。
四川省姑咱台的钻孔应变仪探头安装深度为40.69 m,采样周期为1 min。本文选取姑咱台2011年1月至2014年1月的钻孔面应变数据Sa进行环境响应去除和震前异常提取,原始观测数据如图2所示。
![]() 图 2 姑咱台钻孔面应变观测数据 (2011年1月—2014年1月)Figure 2. Borehole strain data Sa of Guzan station (from January 2011 to January 2014)
图 2 姑咱台钻孔面应变观测数据 (2011年1月—2014年1月)Figure 2. Borehole strain data Sa of Guzan station (from January 2011 to January 2014)2.2 固体潮引起的应变响应
钻孔面应变数据的时间序列分解结果如图3所示。从图中可以看出,趋势项体现了应变数据的整体趋势,周期项的频点为1.157×10⁻⁵ Hz和2.315×10⁻⁵ Hz,刚好对应日波和半日波的频点,体现了固体潮为主的周期变化。余项是去除趋势项和周期项后的待处理数据。
![]() 图 3 钻孔面应变数据的时间序列分解结果(a) 趋势项T(t);(b) 周期项S(t);(c) 余项R(t)Figure 3. Time series decomposition results of borehole strain data(a) Trend T(t);(b) Seasonal S(t);(c) Residual R(t)
图 3 钻孔面应变数据的时间序列分解结果(a) 趋势项T(t);(b) 周期项S(t);(c) 余项R(t)Figure 3. Time series decomposition results of borehole strain data(a) Trend T(t);(b) Seasonal S(t);(c) Residual R(t)2.3 气压和水位引起的应变响应
由于水位、气压和应变余项的数据量级差异较大,对数据标准化后,用多通道奇异谱分析法分解数据,得到了水位和气压引起的应变响应。
姑咱台站位于大渡河附近,水位对应变数据的影响表现在长时间尺度上,钻孔应变仪记录到了应变随水位的明显变化(任天翔等,2018),图4为姑咱台站的水位数据及水位应变响应。从图中可以看出,水位数据及水位应变响应表现为高度的负相关,相关系数为−0.97。
![]() 图 4 姑咱台水位数据 (a) 及水位应变响应 (b)Figure 4. Water level data (a) and its strain response (b) of Guzan station
图 4 姑咱台水位数据 (a) 及水位应变响应 (b)Figure 4. Water level data (a) and its strain response (b) of Guzan station气压对应变数据的影响表现在短周期上,图5为2011年1月姑咱台站的气压数据及气压应变响应。从图中可以看出,气压与气压应变响应表现为高度的负相关,2011年1月气压与气压引起的应变响应的相关系数为−0.96。
![]() 图 5 姑咱台2011年1月气压数据 (a) 及气压应变响应 (b)Figure 5. Air pressure data (a) and its strain response (b) of Guzan station in January 2011
图 5 姑咱台2011年1月气压数据 (a) 及气压应变响应 (b)Figure 5. Air pressure data (a) and its strain response (b) of Guzan station in January 2011为了进一步验证气压应变响应的可靠性,研究更短周期,计算了日气压与其引起的应变响应之间的相关系数。表1为两者相关系数占比,从表中可以看出,−0.9—−1.0的天数占到了96.1%。
表 1 姑咱台日气压与其引起的应变响应之间的相关系数占比Table 1. Proportion of the correlation coefficients of daily air pressure and its strain responses at Guzan station相关系数范围 天数比重 0— −0.9 3.9% −0.9— −1.0 96.1% 水位及水位应变响应的相关系数为−0.97,日气压及其应变响应的相关系数绝对值大于0.9的天数达到了96.1%,都体现出高相关性,证实了本文多通道奇异谱分析法提取气压和水位应变响应的有效性。
2.4 环境响应去除结果
去除固体潮、气压、水位的环境响应后,得到的地壳应变数据如图6所示,可以看出,去除环境响应后的地壳应变数据已经没有了周期趋势,表现为短周期信号,可以清晰地看到波动信号。
2.5 芦山地震异常提取
采用2.3节负熵异常提取方法对地壳应变数据按天进行异常提取并对异常个数进行累积,结果如图7所示。从图中可以看出,2011年7月异常累积曲线线性增长到2012年10月19日,2012年10月19日至2012年12月8日(芦山地震前4—6个月)异常累积曲线出现了加速增长,此后至芦山地震震前则又变为缓慢的线性增长,地震当天开始异常累积曲线加速增长。
![]() 图 7 芦山地震前姑咱台的负熵异常累积曲线Figure 7. The negentropy anomaly accumulation curveat Guzan station before the Lushan earthquake
图 7 芦山地震前姑咱台的负熵异常累积曲线Figure 7. The negentropy anomaly accumulation curveat Guzan station before the Lushan earthquake本文认为2012年10月19日至2012年12月8日异常累积曲线出现的加速增长可能为芦山地震的前兆异常。并推测,在孕震初期,异常累积表现为线性,整个断层因受构造应力影响而稳定滑动;震前4—6个月出现的震前负熵异常累积加速是随着构造应力的不断累积,出现了不同规模的局部小裂缝和滑移;当沿断层的摩擦阻力大于断层的剪应力时,就会形成闭锁区,闭锁区弹性能量不断积累,几何尺寸变化不大,此阶段负熵异常呈缓慢的线性增长;当应力越来越集中的闭锁区达到所能承受的强剪应力极限时,整个闭锁区瞬间失稳,促使了芦山地震的发生(徐克科,李伟,2017)。
3. 芦山地震异常对比分析
3.1 本文的负熵异常累积与贝尼奥夫应变累积的对比分析
贝尼奥夫应变研究应变积累释放的特征,是对地震活动定量的描述,在研究震前加速现象方面得到了广泛应用(Benioff,1949;陈学忠等,2021;贺小丹,2022;牛安福等,2022)。本文算法的负熵异常累积与贝尼奥夫应变累积的对比结果如图8所示。从图中可以看出,在芦山地震前,负熵异常加速出现的时间与贝尼奥夫应变骤增的时间大致相同,结合芦山地震的孕震过程猜测,负熵异常累积加速可能与地震前兆有关。
![]() 图 8 本文的负熵异常累积与贝尼奥夫应变累积对比Figure 8. Comparison of negentropy anomaly accumulation and Benioff strain accumulation
图 8 本文的负熵异常累积与贝尼奥夫应变累积对比Figure 8. Comparison of negentropy anomaly accumulation and Benioff strain accumulation3.2 本文算法与应变差分法的负熵异常累积对比分析
为了进一步验证多通道奇异谱分析去除环境响应的优势,将本文算法与应变差分法进行对比,得到的时域曲线和负熵异常累积结果如图9所示。从图9a可以看出,本文算法与应变差分法的幅度波动时间大致相同,只数值大小有所区别;图9b的负熵异常累积对比显示,趋势相同,都是先线性增长,之后在震前4—6个月出现加速阶段,然后又恢复线性变化,地震发生后再次加速。但本文算法与应变差分法提取到的异常个数有所差别,如2012年6月13日本文算法未提取到异常,而应变差分法提取到了异常,3.4节会对此展开更深入的讨论。
![]() 图 9 姑咱台面应变原始数据与两种算法的时域曲线 (a) 及本文算法与应变差分法的负熵异常累积对比 (b)Figure 9. The strain observation data at Guzan station and time domain curves of two algorithms (a) and comparison on the negentropy anomaly accumulation between the proposed method and strain difference method (b)
图 9 姑咱台面应变原始数据与两种算法的时域曲线 (a) 及本文算法与应变差分法的负熵异常累积对比 (b)Figure 9. The strain observation data at Guzan station and time domain curves of two algorithms (a) and comparison on the negentropy anomaly accumulation between the proposed method and strain difference method (b)3.3 本文算法与应变差分法的非高斯分布天数累积对比分析
不受强震影响的正常地壳应变的短周期信号服从高斯分布(Yu et al,2021),本文使用Kolmogorov-Smirnov检验法分析应变数据的高斯分布情况,对比了本文算法与应变差分法的非高斯分布天数累积(图10)。从图10可以看出,应变差分的非高斯分布的天数累积呈线性,而本文地壳应变数据的非高斯分布天数在震前4—6个月出现加速,与负熵异常加速出现的时间相对应。虽然两种算法的负熵异常累积结果相似,但是本文算法的非高斯分布天数在震前也出现加速,说明去除环境响应后的地壳应变数据可以更有效地提取地震前兆异常。
![]() 图 10 钻孔应变差分和地壳应变的非高斯分布天数累积Figure 10. Accumulated days of non-Gaussian distribution of borehole strain difference and crustal strain
图 10 钻孔应变差分和地壳应变的非高斯分布天数累积Figure 10. Accumulated days of non-Gaussian distribution of borehole strain difference and crustal strain3.4 本文算法与应变差分法的去除气压响应对比分析
如3.2节所述,本文算法未提取到2012年6月13日应变差分法提取出的异常(图9b),观察2012年6月13日的观测数据可以发现,气压数据在采样点800至1 000处均出现了一个波动,这个波动在面应变数据上表现明显,如图11a所示。本文依据气压数据求解得到的气压应变响应真实地反应了这个波动,因而在气压响应去除时能将这个波动去除,这是应变差分法无法做到的(图11b)。
![]() 图 11 2012年6月13日气压数据及气压的应变响应 (a) 及本文算法与应变差分法所得的地壳应变 (b)Figure 11. Air pressure data and its strain response (a) and crustal strain received by the proposed method and strain difference method (b)on June 13,2012
图 11 2012年6月13日气压数据及气压的应变响应 (a) 及本文算法与应变差分法所得的地壳应变 (b)Figure 11. Air pressure data and its strain response (a) and crustal strain received by the proposed method and strain difference method (b)on June 13,20124. 讨论与结论
针对提取钻孔应变异常时受到环境影响干扰的问题,利用时间序列分解法和多通道奇异谱分析法,可有效地去除固体潮、气压和水位引起的应变响应,验证了本文算法在环境响应去除方面的优势,且负熵异常累积与贝尼奥夫应变累积相符。
据本文算法所得的芦山地震负熵异常累积表现为线性增加—加速增加—线性增加—加速增加的趋势,与贝尼奥夫应变累积趋势相符。认为地震前4—6个月出现的负熵异常累积加速可能为地震前兆。结合岩石应力加载的破裂演化过程(初始微破裂—扩张破裂—应力闭锁—地震爆发)猜测,震前4—6个月的异常可能与扩张破裂有关。
本文仅使用姑咱台站钻孔应变数据对2013年芦山地震进行了分析,为获取更加令人信服的结果,需要进一步对更多台站和更多震例进行分析,未来也会进一步研究震前应变异常与孕震过程的关系。
感谢国家地震前兆台网中心(http://qzweb.seis.ac.cn/twzx)提供钻孔应变数据。
-
![]()
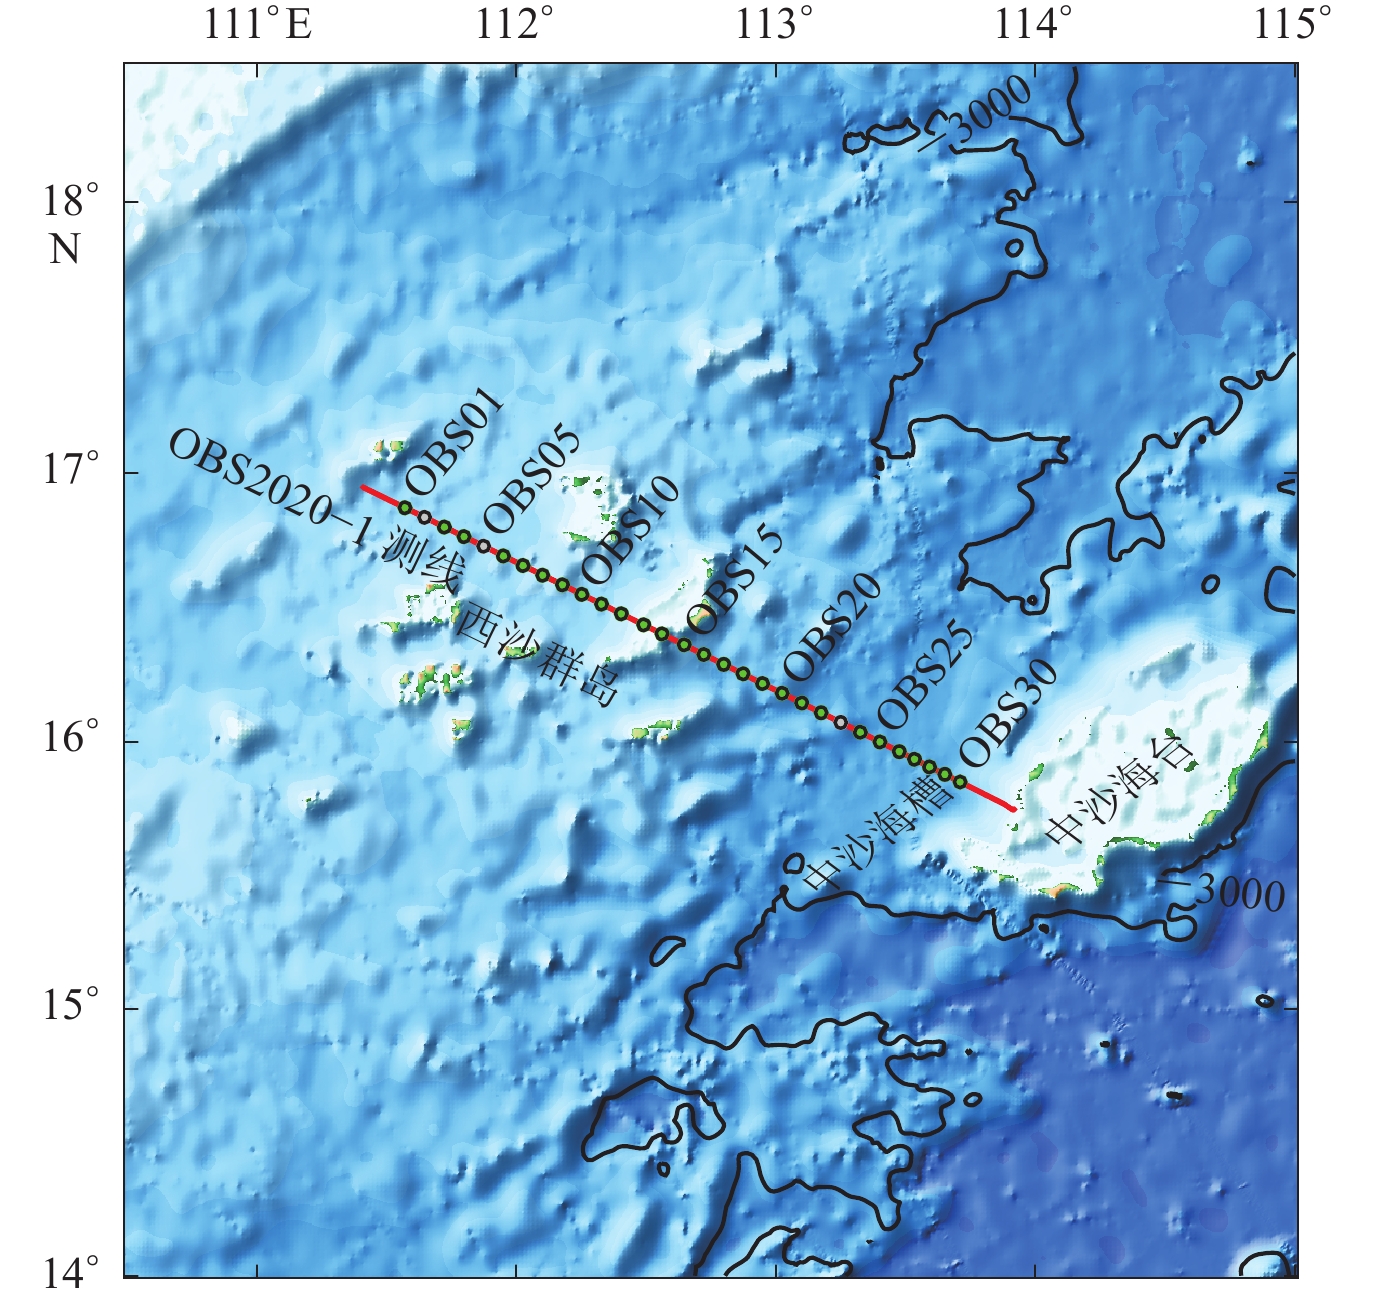
图 1 OBS2020-1地震测线分布及区域位置图
红线为放炮测线,绿色圆圈为成功回收且数据质量好的OBS站点,灰色圆圈为丢失或无数据的OBS站点
Figure 1. OBS2020-1 seismic line distribution and studied area
The red line is the shooting line,green circles are OBS stations that are successful recovery and have good data quality, and gray circles are OBS stations with lost or without data
![]()
图 2 OBS27台站使用错误采样率造成异常现象的前后对比
(a) OBS27台站参考配置文件使用错误采样率导致的异常单台地震剖面(垂直分量),折合速度为6.0 km/s;(b) OBS27台站更改为仪器固定采样率得到的正常地震记录剖面(垂直分量),折合速度为6.0 km/s
Figure 2. Comparison of anomalies caused by incorrect sampling rate used by OBS27
(a) Abnormal seismic profile (vertical component) caused by incorrect sampling rate in OBS27 reference configuration file,reduced velocity is 6.0 km/s;(b) The normal seismic profile (vertical component) obtained by fixed sampling rate in OBS27,reduced velocity is 6.0 km/s
![]()
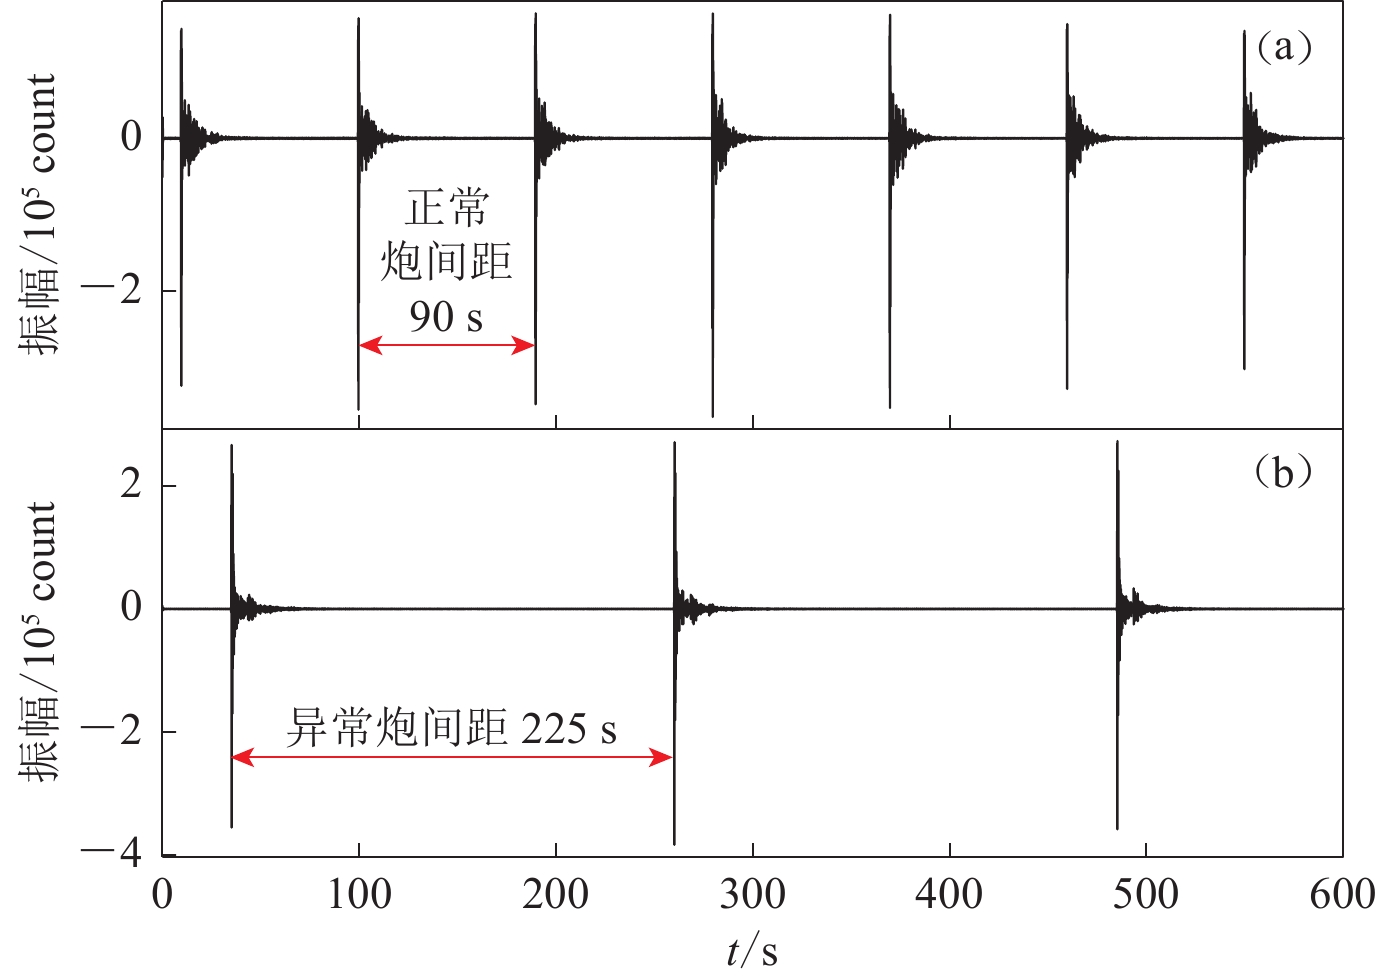
图 3 OBS25(正常)与OBS27(异常)的SAC波形数据对比
(a) OBS25台站正确的放炮时间间隔(90 s);(b) OBS27使用错误采样率导致的异常放炮时间间隔(225 s)
Figure 3. Comparison of waveforms between OBS25 (normal) and OBS27 (abnormal) in SAC format
(a) The correct shooting time interval (90 s) of OBS25;(b) Abnormal shooting time interval (225 s) of OBS27 caused by using wrong sampling rate
![]()
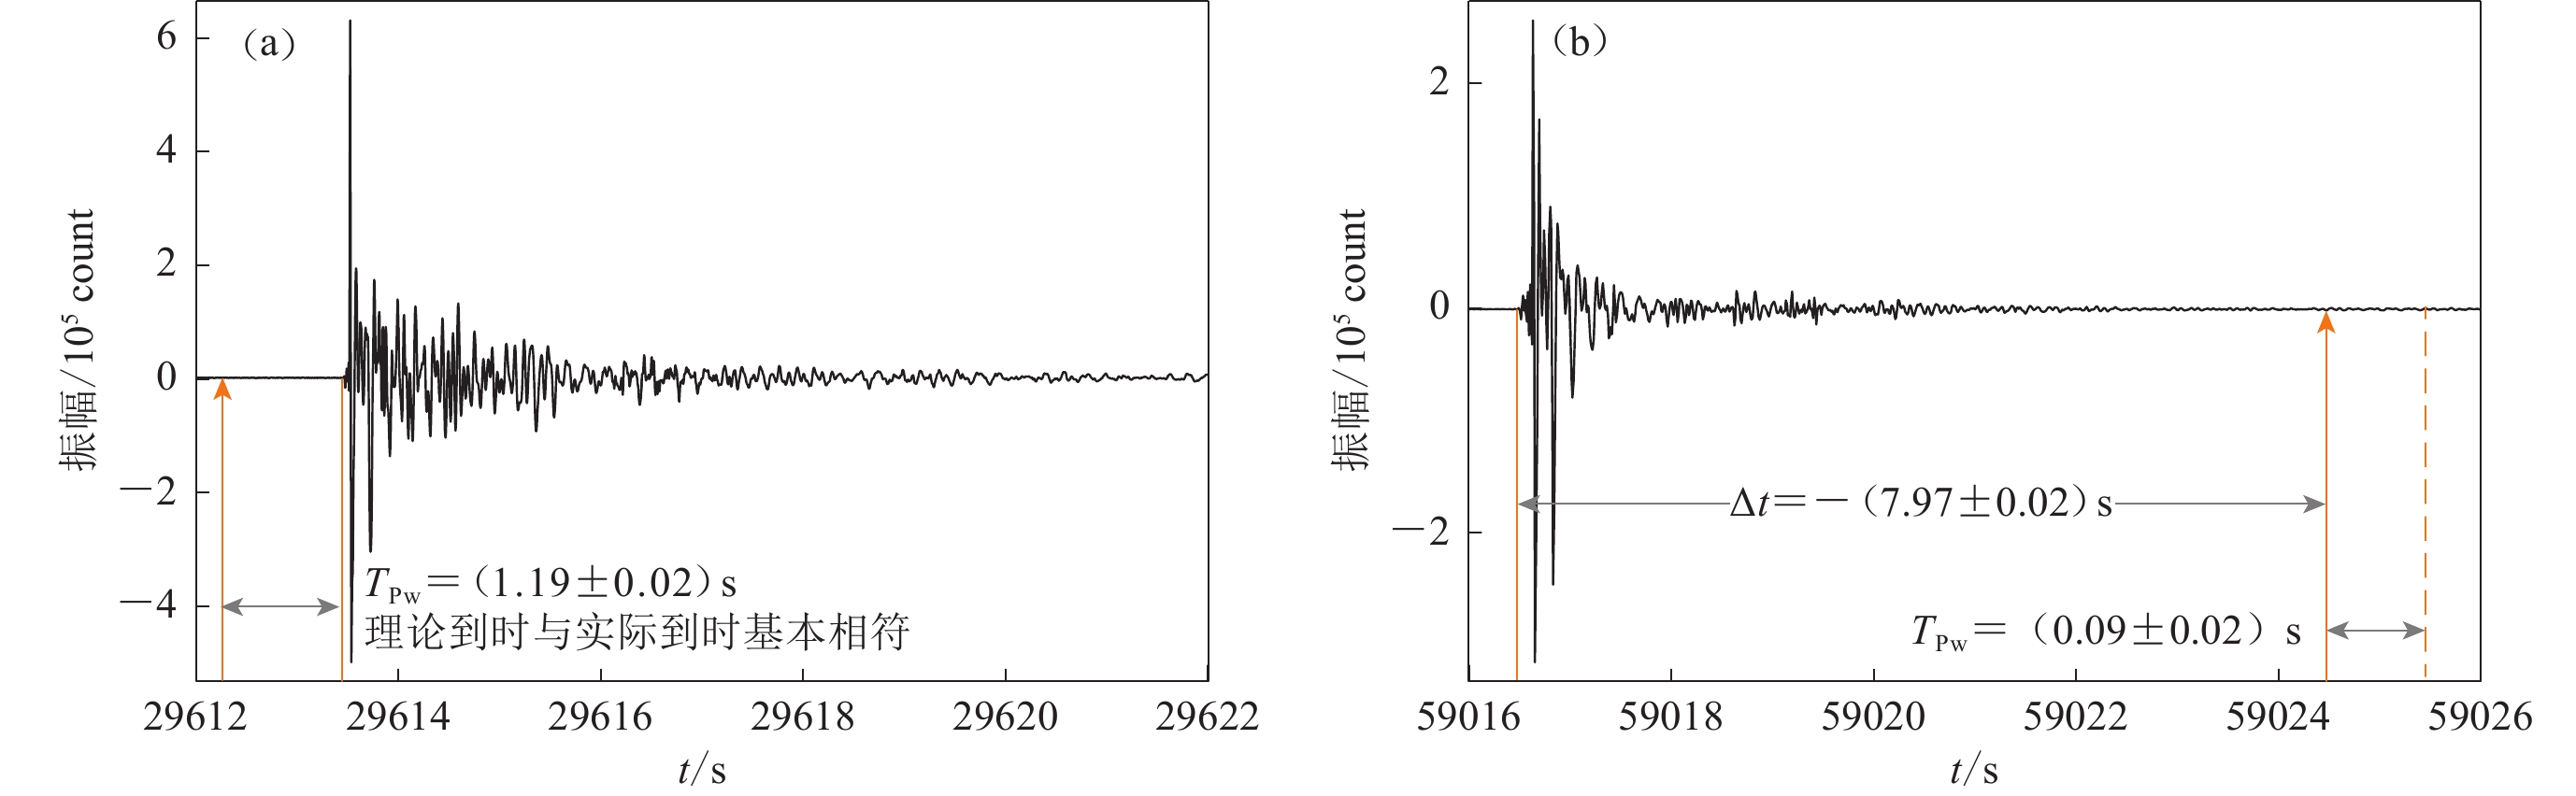
图 4 OBS20 (正常)与OBS18 (异常)时间异常对比
Δt为观测到时与放炮时间的差值;TPw为计算得到的直达水波理论到时;橙色实线表示SAC格式数据中的直达水波实际到时;橙色箭头表示此信号的气枪放炮时间;橙色虚线表示OBS18台站的直达水波理论到时(a) OBS20近偏移距SAC数据波形;(b) OBS18近偏移距SAC数据波形
Figure 4. Abnormal time comparison between the OBS20 (normal) and OBS18 (abnormal)
Δt is the difference between the observation time and the shooting time;TPw is the calculated theoretical arrival time of the direct water wave. The orange solid line represents the actual arrival time of the direct water wave in SAC format data;the orange arrow indicates the shooting time of the air gun for this signal;the orange dashed line indicates the theoretical arrival time of the direct water wave of OBS18 station (a) SAC format waveform of the OBS20 near offset;(b) SAC format waveform of the OBS18 near offset
![]()
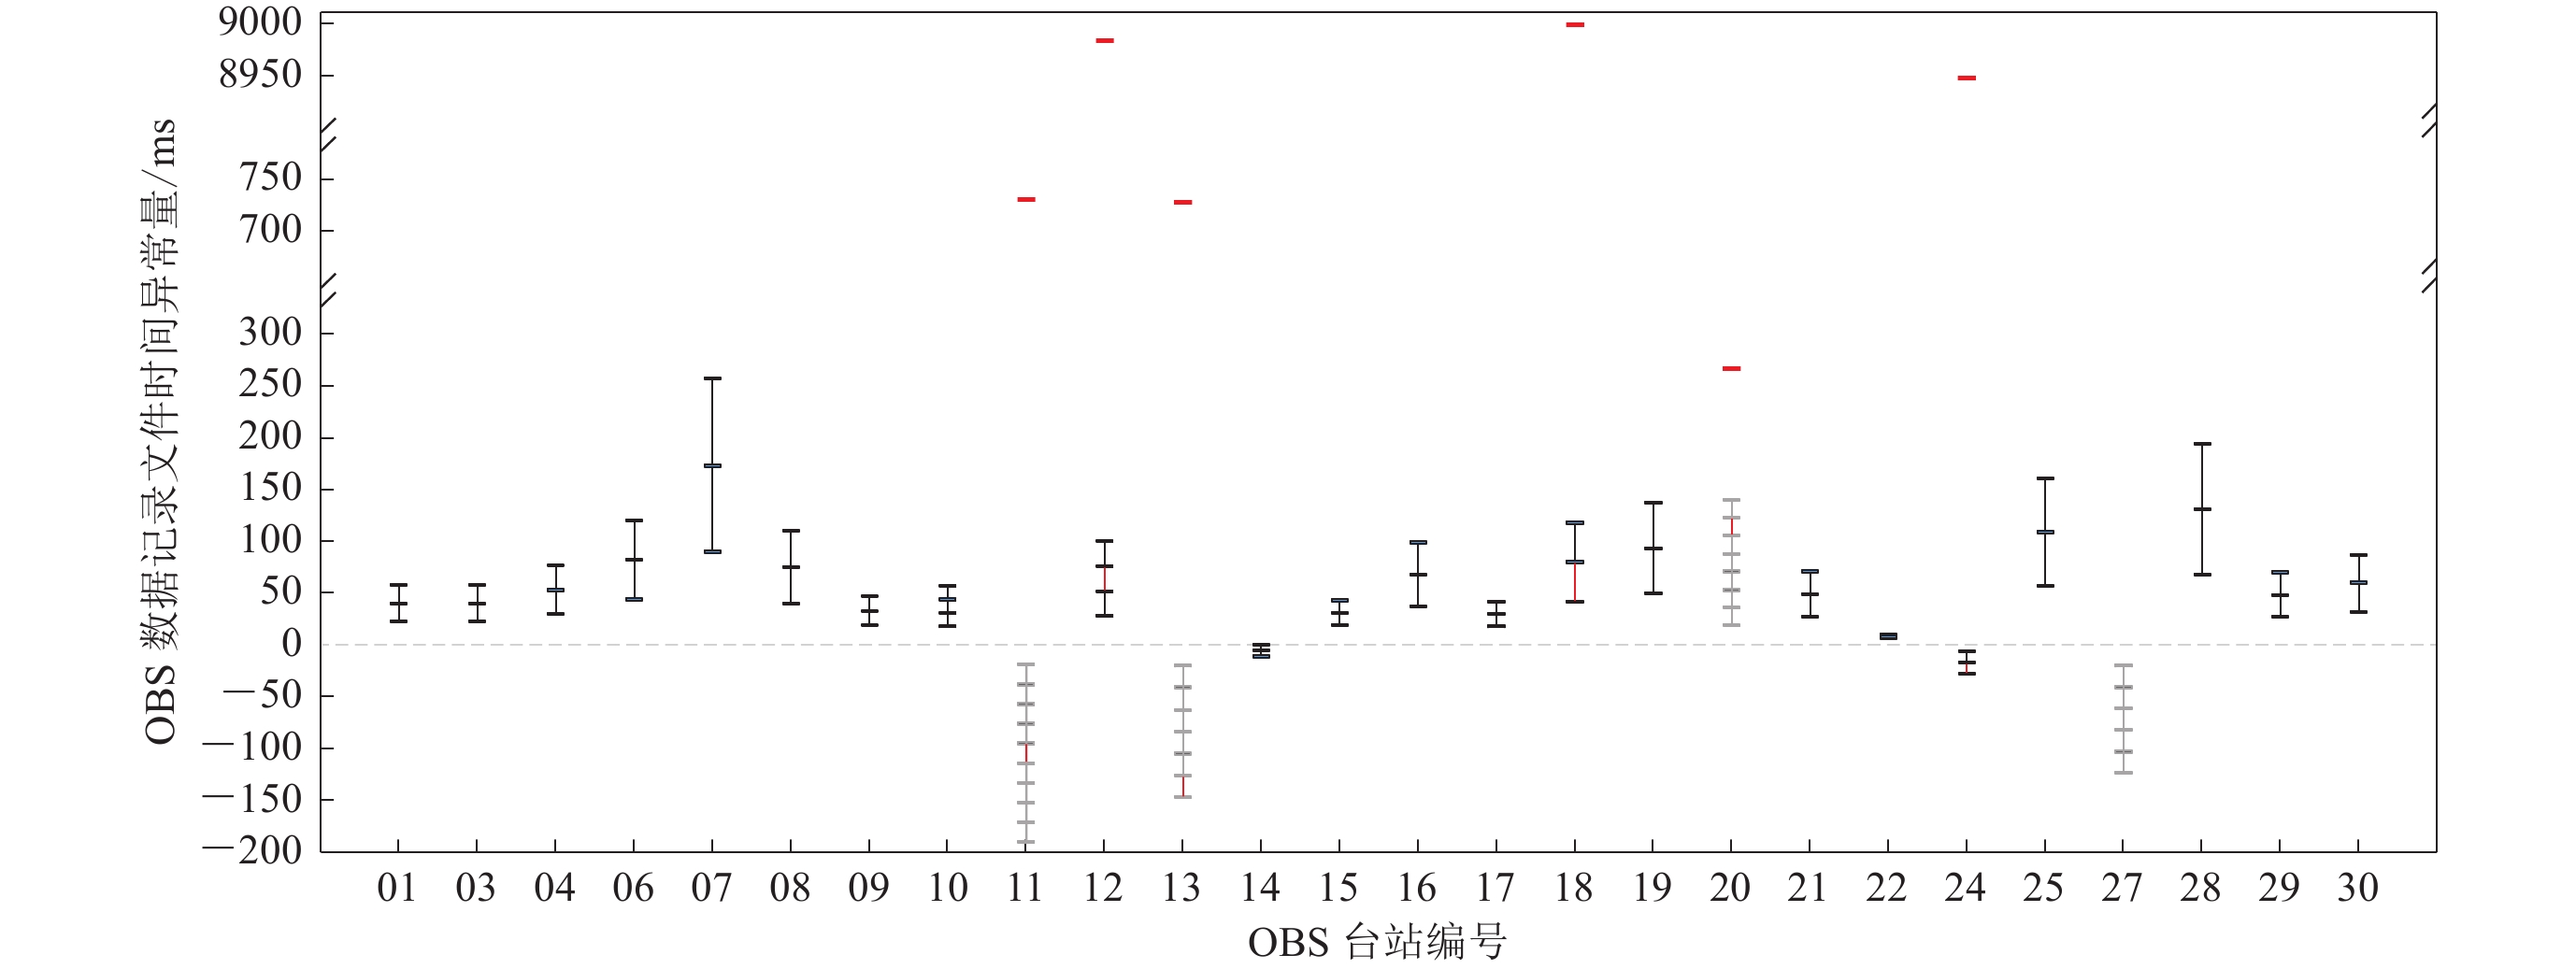
图 5 OBS数据记录文件中相邻文件间的时间差
黑色与灰色线段分别代表预设采样率为100 sps和250 sps时相邻文件间的时间差,红色线段代表非内部时间漂移的时间间隙,上部双斜线表示不连续的时间
Figure 5. Time error between adjacent files in OBSs
The black and gray lines represent a preset sampling frequency of 100 sps and 250 sps,respectively;the red line represents the time gap without internal time drift,and the top double diagonal line represents the discontinuous time
![]()
图 6 不同拼接方法获得的OBS18单台地震剖面
(a,b) 未进行初始时间校正拼接获得的单台地震剖面;(c) 初始时间校正后再拼接获得的正常的单台地震剖面。红色实线标注了数据文件拼接处;红色虚线框表示处理不当可能导致震相“缺失”
Figure 6. Seismic profile of OBS18 obtained by different splicing methods
(a,b) Seismic profiles obtained by splicing without initial time correction;(c) Normal seismic profile obtained by splicing after initial time correction. The red solid line indicates the splice of data files;the dashed red box indicates that the phase may be “missing” due to improper handling
![]()
图 8 OBS07台站单台地震剖面中的同相轴“断阶”
(a) OBS07台站单台地震剖面,图中红色实线表示数据文件拼接处,红框表示图b,c和d的放大;(b) 图a中可辨识出的同相轴“断阶”部分(红色虚线指示了明显的“断阶”);(c) 图b经校正后同相轴“断阶”现象消失;(d) 图a中难以分辨出的内部时间漂移。红色椭圆标注了文件拼接处即存在“断阶”的位置
Figure 8. The "stair" of the event in the seismic profile of OBS07
(a) Seismic profile of OBS07. The red solid line indicates the splice of data files,and the red box indicates the enlargement of figs. b,c and d;(b) The recognizable “stair” in fig. a,the red dotted line is an obvious “stair”;(c) The “stair” phenomenon shown in fig. b disappears after correction;(d) Internal time drift that is difficult to distinguish in fig. a. The red ellipse marks the position where the document is abnormal,the position where there is a “stair”
![]()
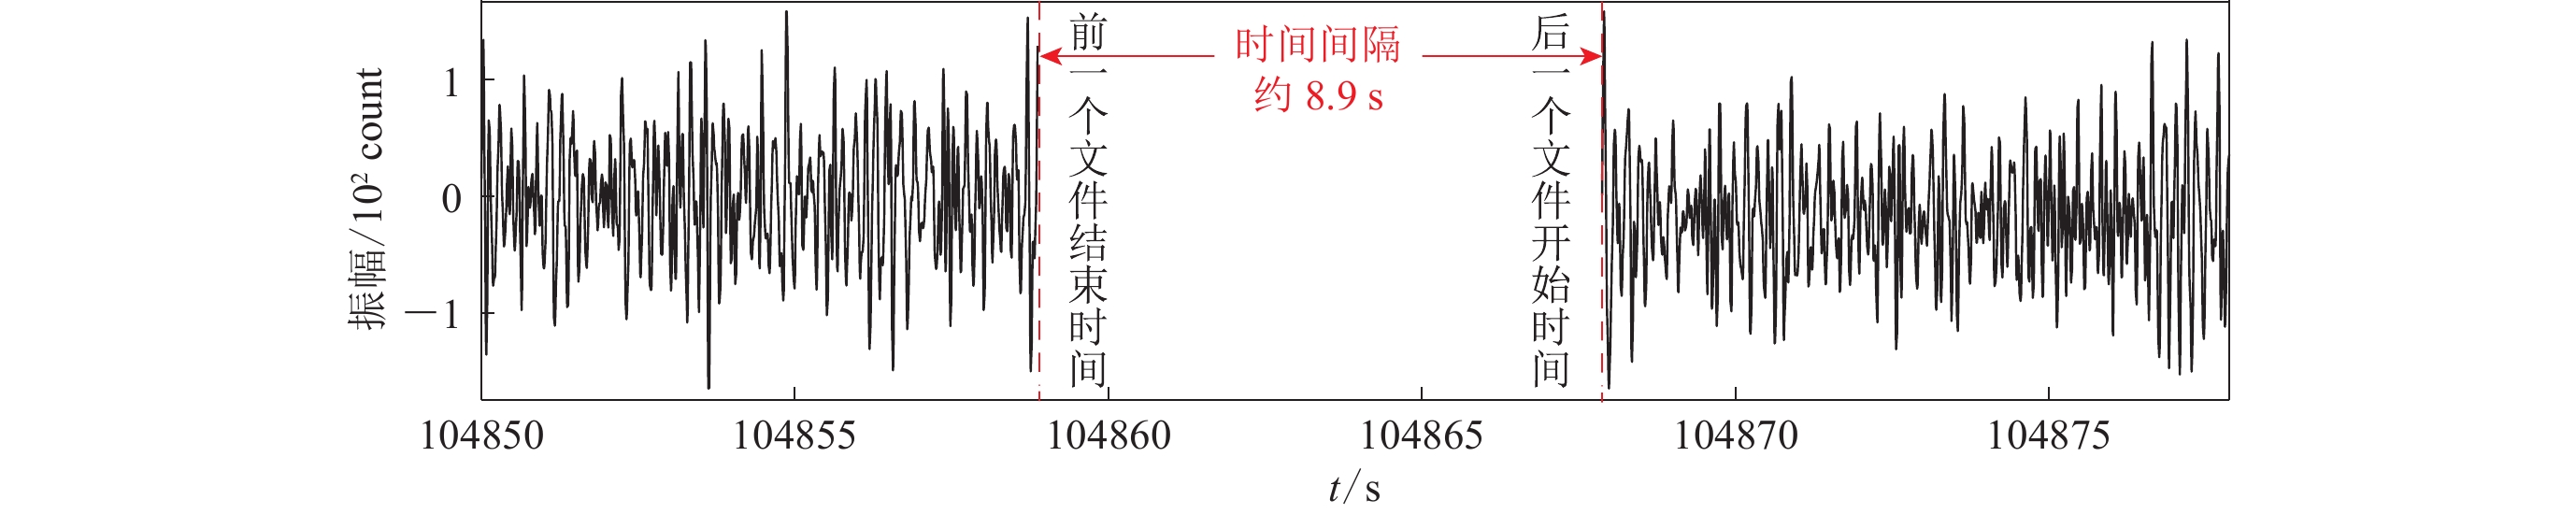
图 9 SAC波形数据中OBS12数据记录中较大的时间间隙
红色虚线标注了相邻文件结束和开始的时间,中间空白处是相邻文件的时间间隙
Figure 9. The larger time gap in waveforms from the OBS12 with SAC format
The red dotted line indicates the end and start time of adjacent files. The space in the middle is the time gap of adjacent files
![]()
图 10 OBS12台站单台地震剖面(垂直分量,折合速度为6.0 km/s)
(a) 减去停止记录后重采样拼接的单台地震剖面,剖面正常清晰;(b) 将SAC格式文件以对钟的头文件为起始时间拼接得到的单台地震剖面(拼接法①),左侧部分震相丢失;(c) 将SAC格式文件以每个文件的初始时间拼接得到的单台地震剖面(拼接法②),剖面正常清晰;(d) 经过时间间隙重采样拼接的单台地震剖面(拼接法③),剖面异常倾斜。红色实线表示数据记录文件的拼接处
Figure 10. Seismic profile of OBS12 (vertical component,reduced velocity is 6.0 km/s)
(a) The seismic profiles spliced by resampling after stopping the recording are normal and clear;(b) The seismic profile (splicing method ①) obtained by splicing SAC format files with the header file of clock as the starting time,and some seismic phases on the left side are lost;(c) The seismic profile obtained by splicing SAC format files with the initial time of each file (splicing method ②) is normal and clear;(d) The seismic profile (splicing method ③) after time gap resampling splicing,the profile is abnormally inclined. The solid red line indicates the splice of the data record file
表 1 OBS2020-1测线主动源海底地震仪仪器参数及数据记录异常分类表
Table 1 Classification of artificial source OBS instrument parameters and data record anomalies for Line OBS2020-1
台站 球号 异常类型
(均包含采样时间异常)相邻文件间的
时间异常范围/s现象 OBS13 A37 固定采样率(250 sps) −0.020—−0.021 使用错误采样率造成,
无法显示有效震相
(例如图2)OBS20 B29 固定采样率(250 sps) 0.017—0.019 OBS27 B40 固定采样率(250 sps) −0.020—−0.021 OBS11 A35 固定采样率(250 sps) −0.019 授时异常 提前0.731 处理不当造成震相
“缺失”或异常“倾斜”
(例如图4和图6)OBS18 K82 授时异常 0.038—0.042
提前0.899OBS01 L94 0.017—0.023 震相清晰连续处的
近偏移距可观察到
小“断阶”(例如
图7和图8)OBS03 L26 0.017—0.023 OBS04 L16 0.023—0.030 OBS06 L96 0.038—0.040 OBS07 N2001 0.083—0.090 OBS08 H56 0.035—0.040 OBS09 L45 0.014—0.019 OBS10 L85-1 0.013—0.018 OBS14 B20-04 0—−0.006 OBS15 L31 0.012—0.019 OBS16 S11new 0.031—0.037 OBS17 L99 0.012—0.018 OBS19 L70 0.043—0.050 OBS21 L85 0.022—0.027 OBS22 L37 0.001—0.007 OBS24 L23 −0.006—−0.011 OBS25 B20-01 0.052—0.057 OBS28 S13 0.063—0.068 OBS29 L98 0.021—0.027 OBS30 L95 0.027—0.032 OBS12 MIC002 采集器暂停工作 0.024—0.028
暂停8.984处理不当造成震相
“缺失”或异常“倾斜”
(例如图9和图10)OBS26 L27 - 故障,仅一个文件 -  下载: 导出CSV
表 2 OBS数据记录异常现象对比
Table 2 Comparison of OBS data anomalies
异常类型 异常现象 异常原因 鉴别方法 处理方法 记录格式异常 无法识别有效震相 实际采样率与预设
采样率的信息不符对比配置文件中的
采样率与实际采样率采样率更正为
实际采样率初始
时间
异常授时异常 震相时间异常明显,实际走时与理论
走时相差较大GPS授时误差 对比直达水波理论
到时与实际到时根据直达水波
理论到时校正文件名转换异常 同上 文件名写入错误 同上 同上 时钟晶振异常 时钟出现线性漂移,误差随时间而增大 OBS内部时钟
晶振频率影响投放回收时两次
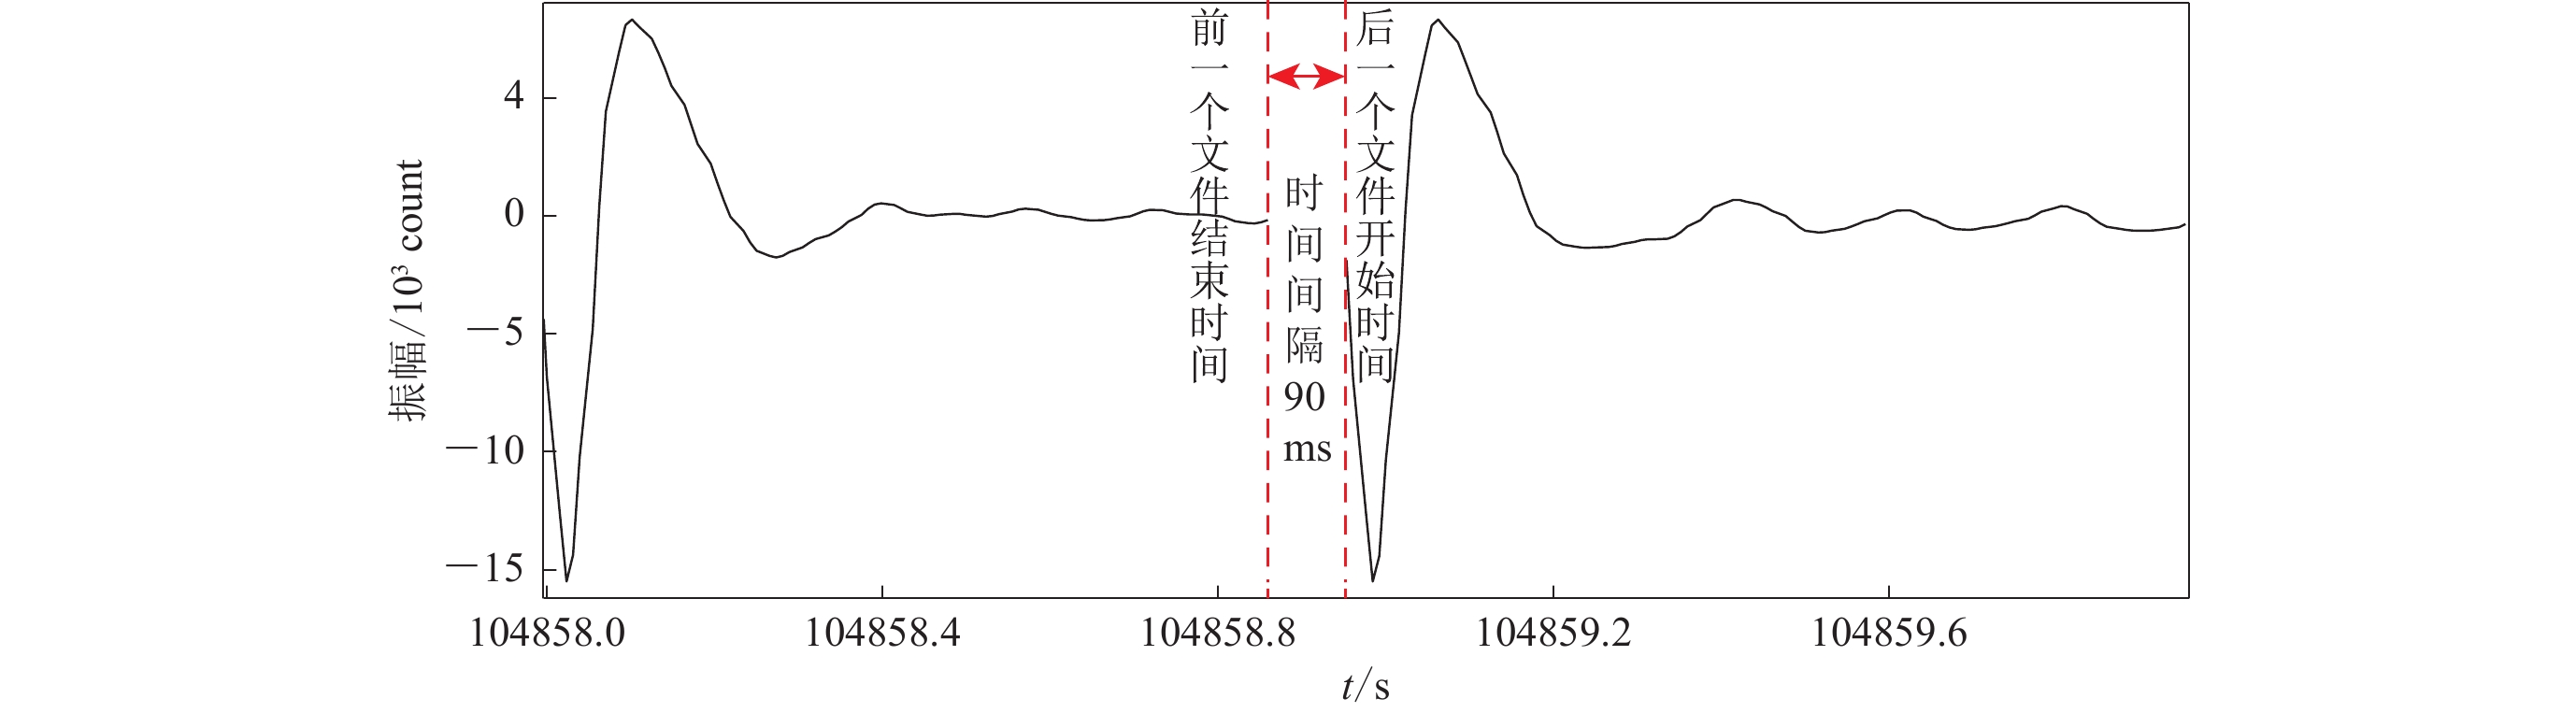
GPS对钟线性分配 采样时间异常 震相清晰连续的近偏移距处可观察到同相轴“断阶”现象 实际采样间隔
非整数毫秒计算相邻文件间的
时间间隙,间隔
稳定在90 ms内将采样间隔更正为
实际值,再重采样
处理采集器
工作
异常采样器
暂停工作处理不当则出现同相轴“断阶”,甚至异常“倾斜”现象 采集器在换文件时暂停工作 计算相邻文件间的
时间间隙,时间
间隙突变若要重采样处理需
先减去采集器停止
工作的时间采样间隔
不稳定无法识别有效震相 时钟晶振频率不稳定,随机异常变化 放炮时间间隔不规律,
与实际等间隔放炮
时间不符无法统一处理
下载: 导出CSV
-
范朝焰. 2019. 南海东北部地壳结构及其对陆缘张裂前后的构造启示[D]. 北京: 中国科学院大学: 32–38. Fan C Y. 2019. Crustal Structure of the Northeastern South China Sea and Its Tectonic Implication for the Pre-Rifting and Post-Rifting Stages of Continental Margin[D]. Beijing: University of Chinese Academy of Sciences: 32–38 (in Chinese).
郝天珧, 游庆瑜. 2011. 国产海底地震仪研制现状及其在海底结构探测中的应用[J]. 地球物理学报, 54(12): 3352-3361. doi: 10.3969/j.issn.0001-5733.2011.12.033 Hao T Y, You Q Y. 2011. Progress of homemade OBS and its application on ocean bottom structure survey[J]. Chinese Journal of Geophysics, 54(12): 3352-3361 (in Chinese).
郝小柱, 伍忠良, 王巍伟, 胡家赋. 2013. 海底地震仪精密计时器的研制与应用[J]. 气象水文海洋仪器, 30(2): 9-13. doi: 10.3969/j.issn.1006-009X.2013.02.003 Hao X Z, Wu Z L, Wang W W, Hu J B. 2013. Research and application on OBS accurate timer[J]. Meteorological, Hydrological and Marine Instruments, 30(2): 9-13 (in Chinese).
郝小柱, 伍忠良, 王伟巍. 2015. 高频海底地震仪性能检测[J]. 热带海洋学报, 34(4): 54-58. doi: 10.3969/j.issn.1009-5470.2015.04.007 Hao X Z, Wu Z L, Wang W W. 2015. Performance test of high-frequency ocean bottom seismometer[J]. Journal of Tropical Oceanography, 34(4): 54-58 (in Chinese).
金震, 郭晓然, 陈方颖. 2020. 国产OBS的时间矫正方法: 以2019年台湾海峡地壳结构海陆探测实验为例[J]. 热带海洋学报, 39(3): 42-48. Jin C, Guo X R, Chen F Y. Correction of made-in-China OBS raw data based on 2019 Fujian and Taiwan Straits crustal structures in sea-land exploration experiments[J]. Journal of Tropical Oceanography, 39(3): 42-48 (in Chinese).
李江, 庄灿涛, 薛兵, 朱小毅, 陈阳, 朱杰, 彭朝勇, 叶鹏, 梁鸿森, 刘明辉, 杨桂存, 周银兴, 林湛, 李建飞. 2010. 宽频带海底地震仪的研制[J]. 地震学报, 32(5): 610-618. doi: 10.3969/j.issn.0253-3782.2010.05.010 Li J, Zhuang C T, Xue B, Zhu X Y, Chen Y, Zhu J, Peng C Y, Ye P, Liang H S, Liu M H, Yang G C, Zhou Y X, Lin Z, Li J F. 2010. Development of broadband ocean bottom seismograph (OBS)[J]. Acta Seismologica Sinica, 32(5): 610-618 (in Chinese).
李军, 金星, 李强, 游秀珍, 胡淑芳, 黄艳丹. 2020. 福建金钟水库OBS记录时钟校正分析[J]. 自然灾害学报, 29(5): 56-63. doi: 10.13577/j.jnd.2020.0506 Li J, Jin X, Li Q, You X Z, Hu S F, Huang Y D. 2020. Clock correction of OBS recorded in Jinzhong reservoir in Fujian province[J]. Journal of Natural Disasters, 29(5): 56-63 (in Chinese).
刘晨光, 华清峰, 裴彦良, 杨挺, 夏少红, 薛梅, 黎伯孟, 霍达, 刘芳, 黄海波. 2014. 南海海底天然地震台阵观测实验及其数据质量分析[J]. 科学通报, 59(16): 1542-1552. Liu C G, Hua Q F, Pei Y L, Yang T, Xia S H, Xue M, Li B M, Huo D, Liu F, Huang H B. 2014. Passive-source ocean bottom seismograph (OBS) array experiment in South China Sea and data quality analyses[J]. Chinese Science Bulletin, 59(33): 4524-4535. doi: 10.1007/s11434-014-0369-4
刘丽华, 吕川川, 郝天珧, 游庆瑜, 郑彦鹏, 支鹏遥, 潘军, 刘少华. 2012. 海底地震仪数据处理方法及其在海洋油气资源探测中的发展趋势[J]. 地球物理学进展, 27(6): 2673-2684. doi: 10.6038/j.issn.1004-2903.2012.06.047 Liu L H, Lü C C, Hao T Y, You Q Y, Zheng Y P, Zhi P Y, Pan J, Liu S H. 2012. Data processing methods of OBS and its development tendency in detection of offshore oil and gas resources[J]. Progress in Geophysics, 27(6): 2673-2684 (in Chinese).
牛雄伟, 阮爱国, 吴振利, 张洁. 2014. 海底地震仪实用技术探讨[J]. 地球物理学进展, 29(3): 1418-1425 doi: 10.6038/pg20140358 Niu X W, Ruan A G, Wu Z L, Zhang J. 2014. Progress on practical skills of Ocean Bottom Seismometer (OBS) experiment[J]. Progress in Geophysics, 29(3): 1418-1425 (in Chinese). doi: 10.6038/pg20140358
丘学林, 赵明辉, 徐辉龙, 李家彪, 阮爱国, 郝天珧, 游庆瑜. 2012. 南海深地震探测的重要科学进程: 回顾和展望[J]. 热带海洋学报, 31(3): 1-9. Qiu X L, Zhao M H, Xu H L, Li J B, Ruan A G, Hao T Y, You Q Y. 2012. Important processes of deep seismic surveys in the South China Sea: Retrospection and expectation[J]. Journal of Tropical Oceanography, 31(3): 1-9 (in Chinese).
阮爱国, 李家彪, 冯占英, 吴振利. 2004. 海底地震仪及其国内外发展现状[J]. 东海海洋, 22(2): 19-27 Ruan A G, Li J B, Feng Z Y, Wu Z L. 2004. Ocean bottom seismometer and its development in the world[J]. Donghai Marine Science, 22(2): 19-27 (in Chinese).
阮爱国, 丘学林, 李家彪, 郝天珧. 2009. 中国海洋深地震探测与研究进展[J]. 华南地震, 29(2): 10-18. doi: 10.3969/j.issn.1001-8662.2009.02.002 Ruan A G, Qiu X L, Li J B, Hao T Y. 2009. Wide aperture seismic sounding in the Margin Seas of China[J]. South China Journal of Seismology, 29(2): 10-18 (in Chinese).
阮爱国, 李家彪, 陈永顺, 丘学林, 吴振利, 赵明辉, 牛雄伟, 王春龙, 王显光. 2010. 国产I-4C型OBS在西南印度洋中脊的试验[J]. 地球物理学报, 53(4): 1015-1018. doi: 10.3969/j.issn.0001-5733.2010.04.026 Ruan A G, Li J B, Chen Y S, Qiu X L, Wu Z L, Zhao M H, Niu X W, Wang C L, Wang X G. 2010. The experiment of broad band I-4C type OBS in the Southwest India ridge[J]. Chinese Journal of Geophysics, 53(4): 1015-1018 (in Chinese).
邵安民, 张玉云, 赵风文. 2003. 海底地震数据记录器[J]. 地球物理学报, 46(2): 224-228. doi: 10.3321/j.issn:0001-5733.2003.02.015 Shao A M, Zhang Y Y, Zhao F W. 2003. An ocean bottom seismic data recorder[J]. Chinese Journal of Geophysics, 46(2): 224-228 (in Chinese).
王强, 丘学林, 赵明辉, 黄海波, 敖威. 2016. 南海海底地震仪异常数据的分析和处理[J]. 地球物理学报, 59(3): 1102-1112. doi: 10.6038/cjg20160330 Wang Q, Qiu X L, Zhao M H, Huang H B, Ao W. 2016. Analysis and processing on abnormal OBS data in the South China Sea[J]. Chinese Journal of Geophysics, 59(3): 1102-1112 (in Chinese).
王伟巍, 朱世华, 袁修贵, 罗跃逸, 赵庆献. 2013. 海底地震仪的时间同步技术[J]. 海洋信息, (2): 9-12. Wang W W, Zhu S H, Yuan X G, Luo Y Y, Zhao Q X. Time synchronization technology of submarine seismograph[J]. Marine Information, (2): 9–12 (in Chinese).
王彦林, 阎贫, 郑红波, 吕修亚. 2007. OBS记录的时间和定位误差校正[J]. 热带海洋学报, 26(5): 40-46. doi: 10.3969/j.issn.1009-5470.2007.05.007 Wang Y L, Yan P, Zheng H B, Lü X Y. 2007. Timing and positioning corrections of ocean bottom seismograph data[J]. Journal of Tropical Oceanography, 26(5): 40-46 (in Chinese).
夏常亮. 2009. OBS地震数据关键处理环节研究[D]. 北京: 中国地质大学(北京): 8−12. Xia C L. 2009. A Study on Pivotal Data Processing Procedure of Ocean Bottom Seismograph[D]. Beijing: China University of Geosciences (Beijing): 8−12 (in Chinese).
夏少红, 丘学林, 赵明辉, 叶春明, 陈营华, 徐辉龙, 王平. 2007. 香港与珠三角地区海陆联合地震探测的数据处理[J]. 热带海洋学报, 26(1): 35-38. doi: 10.3969/j.issn.1009-5470.2007.01.006 Xia S H, Qiu X L, Zhao M H, Ye C M, Chen Y H, Xu H L, Wang P. 2007. Data processing of onshore-offshore seismic experiment in Hongkong and Zhujiang River Delta region[J]. Journal of Tropical Oceanography, 26(1): 35-38 (in Chinese).
夏少红, 敖威, 赵明辉, 丘学林, 徐辉龙. 2011. 海洋广角地震数据校正方法探讨[J]. 海洋通报, 30(5): 487-491. doi: 10.3969/j.issn.1001-6392.2011.05.002 Xia S H, Ao W, Zhao M H, Qiu X L, Xu H L. 2011. Corrections and analysis of wide angle seismic data from the sea[J]. Marine Science Bulletin, 30(5): 487-491 (in Chinese).
夏少红, 曹敬贺, 万奎元, 范朝焰, 孙金龙. 2016. OBS广角地震探测在海洋沉积盆地研究中的作用[J]. 地球科学进展, 31(11): 1111-1124. doi: 10.11867/j.issn.1001-8166.2016.11.1111 Xia S H, Cao J H, Wan K Y, Fan C Y, Sun J L. 2016. Role of the wide-angle OBS seismic exploration in the research of marine sedimentary basin[J]. Advances in Earth Science, 31(11): 1111-1124 (in Chinese).
薛彬, 阮爱国, 李湘云, 吴振利. 2008. SEDIS IV型短周期自浮式海底地震仪数据校正方法[J]. 海洋学研究, 26(2): 98-102. doi: 10.3969/j.issn.1001-909X.2008.02.014 Xue B, Ruan A G, Li X Y, Wu Z L. 2008. The seismic data corrections of short period auto-floating ocean bottom seismometer[J]. Journal of Marine Sciences, 26(2): 98-102 (in Chinese).
游庆瑜, 刘福田, 冉崇荣, 王广福. 2003. 高频微功耗海底地震仪研制[J]. 地球物理学进展, 18(1): 173-176. doi: 10.3969/j.issn.1004-2903.2003.01.030 You Q Y, Liu F T, Ran C R, Wang G F. 2003. High frequency micro-power ocean bottom seismograph[J]. Progress in Geophysics, 18(1): 173-176 (in Chinese).
张光学, 徐华宁, 刘学伟, 张明, 伍忠良, 梁金强, 王宏斌, 沙志彬. 2014. 三维地震与OBS联合勘探揭示的神狐海域含水合物地层声波速度特征[J]. 地球物理学报, 57(4): 1169-1176. doi: 10.6038/cjg20140414 Zhang G X, Xu H N, Liu X W, Zhang M, Wu Z L, Liang J Q, Wang H B, Sha Z B. 2014. The acoustic velocity characteristics of sediment with gas hydrate revealed by integrated exploration of 3D seismic and OBS data in Shenhu area[J]. Chinese Journal of Geophysics, 57(4): 1169-1176 (in Chinese).
张浩宇, 丘学林, 张佳政, 贺恩远, 游庆瑜. 2019. 国产海底地震仪的时间记录与原始数据精细校正[J]. 地球物理学报, 62(1): 172-182. doi: 10.6038/cjg2019L0715 Zhang H Y, Qiu X L, Zhang J Z, He E Y, You Q Y. 2019. Time record and accurate correction of Chinese OBS raw data[J]. Chinese Journal of Geophysics, 62(1): 172-182 (in Chinese).
张佳政, 丘学林, 赵明辉, 游庆瑜, 贺恩远, 王强. 2018. 南海巴士海峡三维OBS探测的异常数据恢复[J]. 地球物理学报, 61(4): 1529-1538. doi: 10.6038/cjg2018L0268 Zhang J Z, Qiu X L, Zhao M H, You Q Y, He E Y, Wang Q. 2018. Abnormal data retrieval of three-dimensional OBS survey at the Bashi Channel area of the South China Sea[J]. Chinese Journal of Geophysics, 61(4): 1529-1538 (in Chinese).
赵明辉, 丘学林, 夏少红, 王平, 夏戡原. 2007. 南海东北部三分量海底地震仪记录中横波的识别和分析[J]. 自然科学进展, 17(11): 1516-1523. doi: 10.3321/j.issn:1002-008x.2007.11.008 Zhao M H, Qiu X L, Xia S H, Wang P, Xia K Y. 2007. Identification and analysis of shear waves recorded by three component seabed seismograph in the northeastern South China Sea[J]. Progress in Natural Science, 17(11): 1516-1523 (in Chinese).
赵明辉, 杜峰, 王强, 丘学林, 韩冰, 孙龙涛, 张洁, 夏少红, 范朝焰. 2018. 南海海底地震仪三维深地震探测的进展及挑战[J]. 地球科学, 43(10): 3749-3761. Zhao M H, Du F, Wang Q, Qiu X L, Han B, Sun L T, Zhang J, Xia S H, Fan C Y. 2018. Current status and challenges for three-dimensional deep seismic survey in the South China Sea[J]. Earth Science, 43(10): 3749-3761 (in Chinese).
Fan C Y, Xia S H, Zhao F, Sun J L, Cao J H, Xu H L, Wan K Y. 2017. New insights into the magmatism in the northern margin of the South China Sea: Spatial features and volume of intraplate seamounts[J]. Geochem Geophys Geosyst, 18(6): 2216-2239. doi: 10.1002/2016GC006792
Hannemann K, Krüger F, Dahm T. 2014. Measuring of clock drift rates and static time offsets of ocean bottom stations by means of ambient noise[J]. Geophys J Int, 196(2): 1034-1042. doi: 10.1093/gji/ggt434
Le B M, Yang T, Chen Y J, Yao H J. 2018. Correction of OBS clock errors using Scholte waves retrieved from cross-correlating hydrophone recordings[J]. Geophys J Int, 212(2): 891-899. doi: 10.1093/gji/ggx449
Lin J N, Xia S H, Wang X Y, Zhao D P, Wang D W. 2022. Seismogenic crustal structure affected by the Hainan mantle plume[J]. Gondwana Res, 103: 23-36. doi: 10.1016/j.gr.2021.10.029
Liu Y L, Liu C, Tao C H, Yao H J, Qiu L, Wang A, Ruan A G, Wang H C, Zhou J P, Li H M, Dong C W. 2018. Time correction of the ocean bottom seismometers deployed at the southwest Indian ridge using ambient noise cross-correlation[J]. Acta Oceanol Sin, 37(5): 39-46. doi: 10.1007/s13131-018-1209-1
Loviknes K, Jeddi Z, Ottemöller L, Barreyre T. 2020. When clocks are not working: OBS time correction[J]. Seismol Res Lett, 91(4): 2247-2258. doi: 10.1785/0220190342
Shariat-Panahi S, Alegria F C, Làzaro A M, del Rio J. 2009. Time drift of ocean bottom seismometers (OBS)[C]//XIX IMEKO World Congress Fundamental and Applied Metrology. Lisbon, Portugal: IMEKO: 2548–2553.
Tian J Y, Lin J, Zhang F, Xu M, Zhang Y Y, Guo L Y, Zeng X. 2021. Time correction of Ocean-Bottom Seismometers using improved ambient noise cross correlation of multicomponents and dual-frequency bands[J]. Seismol Res Lett, 92(3): 2004-2014. doi: 10.1785/0220200358
Wen G G, Wan K Y, Xia S H, Fan C Y, Cao J H, Xu H L. 2021. Crustal extension and magmatism along the northeastern margin of the South China Sea: Further insights from shear waves[J]. Tectonophysics, 817: 229073. doi: 10.1016/j.tecto.2021.229073
William C T, Joseph E T. 1991. SAC Seismic Analysis Code Users Manual[M]. Livermore, CA: Lawrence Livermore National Laboratory: 1–153.
Xia S H, Zhao F, Zhao D P, Fan C Y, Wu S G, Mi L J, Sun J L, Cao J H, Wan K Y. 2018. Crustal plumbing system of post-rift magmatism in the northern margin of South China Sea: New insights from integrated seismology[J]. Tectonophysics, 744: 227-238. doi: 10.1016/j.tecto.2018.07.002
Zhang C L, Xia S H, Fan C Y, Cao J H. 2023. Submarine volcanism in the southern margin of the South China Sea[J]. J Oceanol Limnol, 41(2): 612−629.
Zhao M H, Qiu X L, Xia S H. 2010. Seismic structure in the northeastern South China Sea: S-wave velocity and vP/vS ratios derived from three-component OBS data[J]. Tectonophysics, 480(1/2/3/4): 183-197.
-
期刊类型引用(1)
1. 延海军,张文鑫,沈宁,吴迪,马楠,张燕霞,蔡黎明,张慧. 银川M4.8地震震前应变异常特征分析. 防灾减灾学报. 2025(02): 88-94 .  百度学术
百度学术
其他类型引用(0)


计量
- 文章访问数: 367
- HTML全文浏览量: 122
- PDF下载量: 126
- 被引次数: 1
