

Rapid magnitude estimation based on multi-input Gaussian process regression
-
摘要:
为充分利用初至地震波中与震级相关的信息,提高震级估算精度,本文提出了一种震级快速估算方法(GPR),该方法将初至地震波在时域、频域和时频域中的10个特征参数输入高斯过程回归模型实现震级估算。利用日本的大量地表强震记录对GPR方法进行训练和测试,并与最大卓越周期${\tau ^{\max }_{\mathrm{p}}} $方法和位移幅值P d方法进行了对比。结果表明,GPR方法在有震源距和无震源距两种情况下,估算震级的准确性均显著好于${\tau ^{\max }_{\mathrm{p}}} $方法和P d方法。此外,利用智利的地表强震记录对日本数据训练的GPR进行泛化能力测试的结果显示,GPR方法较${\tau ^{\max }_{\mathrm{p}}} $方法和P d方法具有更好的泛化能力。利用GPR方法对我国的三次典型震例进行震级估算,验证该方法是合理且可靠的,表明GPR方法不会受到地域差异的影响,可以有效提高地震预警系统估算震级的准确度。
Abstract:Accurate and rapid magnitude estimation is of paramount importance for earthquake early warning systems (EEWs). Traditional magnitude estimation methods based on a single characteristic parameter of the initial seismic wave are widely used in EEWs. However, these empirical formulae, established by a single characteristic parameter, fail to fully exploit the information related to magnitude contained in the initial seismic wave, significantly limiting the effectiveness of magnitude estimation. To improve the accuracy of magnitude estimation in EEWs, this paper proposes a Gaussian process regression (GPR) based method that can estimate magnitudes in both scenarios: with and without hypocentral distance. The proposed method, GPR-M, uses multiple characteristic parameters from the time domain, frequency domain, and time-frequency domain as inputs, while GPR-M-R incorporates hypocentral distance. Both methods estimate magnitude by integrating various aspects of information from the initial seismic wave. The study utilized
33698 vertical acceleration records from the Japanese Kiban-Kyoshin Network (KiK-net) for training and testing, and5353 vertical acceleration records from the Chilean Simulation Based Earthquake Risk and Resilience of Interdependent Systems and Networks (SIBER-RISK) for generalization testing. Additionally, the method’s practical application was validated using three typical earthquake cases in China, with MS5.4, MS6.4, and MS8.0. The performance of the GPR method was compared with the widely adopted ${\tau ^{\max }_{\mathrm{p}}} $ and P d methods. The test results from the Japanese records indicate that for initial seismic waves of 3 to 10 s, both GPR-M and GPR-M-R outperform the ${\tau ^{\max }_{\mathrm{p}}} $ and P d methods in magnitude estimation. Specifically, the standard deviation of estimation errors for the GPR-M method is reduced by approximately 52.53% to 61.20% compared with the ${\tau ^{\max }_{\mathrm{p}}} $ method, while the GPR-M-R method reduces the standard deviation of estimation errors by about 37.72% to 41.21% compared with the P d method. For larger earthquakes (MW≥6.5), the magnitude saturation phenomenon is less pronounced in the GPR-M and GPR-M-R methods compared with the ${\tau ^{\max }_{\mathrm{p}}} $ and P d methods. The accuracy of magnitude estimation for MW≥6.5 is improved by 1.4 to 1.5 times with the GPR-M method compared with the ${\tau ^{\max }_{\mathrm{p}}} $ method, and by 1.2 to 1.45 times with the GPR-M-R method compared with the P d method. The test results from the Chilean data demonstrate that both the GPR-M and GPR-M-R methods can effectively estimate earthquake magnitudes in Chile. The standard deviation of estimation errors for the GPR-M method is reduced by approximately 53.08% to 55.13% compared with the ${\tau ^{\max }_{\mathrm{p}}} $ method, and the GPR-M-R method reduces the standard deviation of estimation errors by about 35.88% to 36.59% compared with the P d method, showing excellent generalization capability. The test results from the three Chinese earthquake cases further confirmed that the GPR methods exhibit better accuracy and reliability compared with the ${\tau ^{\max }_{\mathrm{p}}} $ and P d methods. The GPR method can significantly improve the accuracy of magnitude estimation in EEWs and is not affected by regional differences. In conclusion, this study presents a novel GPR-based magnitude estimation method that integrates multiple seismic wave features and optionally incorporates hypocentral distance information. The method demonstrates superior performance in terms of accuracy, reliability, and generalization ability compared with traditional single-parameter approaches. By effectively reducing estimation errors and mitigating magnitude saturation issues, particularly for larger earthquakes, the proposed GPR method offers significant potential for improving the effectiveness of EEWs across diverse geographical regions. -
引言
地震应力降是描述地震震源特性的关键参数,它将地震矩与震源破裂尺度建立了联系(Eshelby,1957),它是认识地震震源破裂、评估地震危险性、可靠模拟高频地震动等的关键物理量。地震应力降可以用来揭示地震震源自相似特性、发震区构造环境以及解释地震中高频地震动特性。由于震源破裂尺度不能直接测量,所以地震应力降也难以测定,需要利用震源辐射的地震波来估算,尽管单个地震的应力降具有很大的不确定性,且地震应力降的变化范围很大(0.1—100 MPa),但地震的统计平均应力降仍然具有重要意义。对于可看作点源的小地震,根据圆盘震源模型(Brune,1970),震源破裂半径与地震体波谱拐角频率的球面平均有关,震源辐射出的体波在传播时经过地壳介质和地表浅层土层时发生了变化,因此,从地震动观测记录中有效地剔除传播介质衰减和局部场地效应来获得可靠的地震体波谱是估计地震应力降的关键问题,目前已经发展了多种有效的方法,例如:多台多震联合谱反演法(Boatwright et al,1991)、经验格林函数(empirical Green function,缩写为EGF)谱比法(Hartzell,1978)。
EGF谱比法已广泛应用于地震动的传播路径衰减和局部场地效应的消除,进而估计地震的拐角频率和应力降,已有研究主要针对具有大量小地震(M<3.0)的测震记录开展(Viegas et al,2010;Abercrombie et al,2017;Trugman,Shearer,2018;Yoshimitsu et al,2019),为了探究基于中小地震(M4.0—5.9)强震动观测记录的EGF谱比法估计地震应力降的可行性,完善应力降相关领域的研究工作,以及更全面地了解2013年ML7.0芦山地震序列的震源特性,本文基于芦山地震序列强震动观测记录的EGF谱比法估计芦山强余震的地震拐角频率和应力降,拟根据给出的强震动观测记录的EGF谱比曲线的定量质量指标,给出ML3.8—5.4芦山地震17次余震的拐角频率和应力降,以期为EGF谱比法在国内强震动记录的应用提供参考资料。
1. 经验格林函数 ( EGF ) 谱比法
经验格林函数(EGF)谱比法利用震源靠近、震源机制近似一致、震级不同的两次地震在同一观测台站记录的体波加速度傅里叶幅值谱U之比来消除传播介质衰减项P和局部场地效应G,分离出震源辐射地震体波谱(震源谱)E之比,即
$$ \frac{{{U_{1i}} ( f ) }}{{{U_{ji}} ( f ) }} = \frac{{{E_{1i}} ( f ) {P_{1i}} ( f ) {G_i} ( f ) }}{{{E_{ji}} ( f ) {P_{ji}} ( f ) {G_i} ( f ) }} {\text{≈}} \frac{{{E_{1i}} ( f ) }}{{{E_{ji}} ( f ) }} \text{,} $$ (1) 式中,f为频率;下标i表示第i个台站;下标1表示大震级的目标地震;下标j表示目标地震的第j个EGF地震,一个目标地震可以有多个EGF地震。两个地震震源位置接近以保证其在同一台站观测记录的传播介质衰减近似一致,为避免地震震源辐射模式不同引起的地震动空间分布的差异,两次地震的震源机制解应尽可能相同。
根据圆盘震源模型式(1),目标地震及其第j个EGF地震中第i个台站观测记录的傅里叶谱比A可近似为理论震源谱谱比B,表示为A=B,即
$$ \frac{{{U_{1i}} ( f ) }}{{{U_{ji}} ( f ) }} = {\frac{{{M_{01}}}}{{{M_{0j}}}}}\left[ {{\frac{{1 + {{\left( {\dfrac{f}{{{f_{{\text{c}}j}}}}} \right)}^{\gamma n}}}}{{1 + {{\left( {\dfrac{f}{{{f_{{\text{c1}}}}}}} \right)}^{\gamma n}}}}} }\right]^{\tfrac{1}{\gamma}}\text{,} $$ (2) 式中:M0为地震矩,根据Hanks和Kanamori (1979),lgM0=1.5(MW+10.7),其中MW为地震矩震级;fc为地震的拐角频率;γ和n分别为与拐角频率附近谱形状和高频衰减有关的常数,一般n=2,γ的取值与采用的理论震源模型有关,例如应用 Boatwright (1980)模型时,γ=2,而应用Brune (1970)模型时,γ=1,本文中γ取为2。
采用Nelder-Mead单纯形法基于理论震源谱比B拟合观测记录谱比A,其中待求解的M01/M0j,fc1和fcj均为变量,分别取其初始值为观测记录谱比的最大值、最小可用频率和最大可用频率,根据观测记录谱比与理论震源谱比残差(
$\mathrm{R}\mathrm{e}\mathrm{s}=\sum\limits _{m=1}^{{N}_{f}}{ ( \mathrm{l}\mathrm{n}A-\mathrm{l}\mathrm{n}B ) }^{2}$ ,Nf表示频率点数)最小的原则,给出目标地震和其第j次EGF地震的拐角频率fc1,fcj和地震矩之比M01/M0j的初始估计值。为评估地震拐角频率估计的不确定性,再次以震源谱比B拟合观测记录谱比A,但将目标地震的拐角频率设定为在fc1初始估计值附近变化的一系列可能值,对于每一个fc1可能值,均采用Nelder-Mead单纯形法搜索给出相应的fcj和M01/M0j的估计值,并分别计算针对每个fc1可能值的归一化拟合方差Var,其中Var=Res/(Nf M01/M0j),根据Var随fc1可能值的变化(一般为开口向上的抛物线型)最终给定fc1的最佳估计值,即当Var为最小值时的fc1可能值,以1.05倍的Var最小值对应的两个fc1可能值(fc1max和fc1min)表示fc1的不确定性,参考Viegas等(2010)和Abercrombie等(2017)的规定判断fc1最佳估计值是否可靠,即当(fc1max-fc1min)/fc1≤2时认为fc1最佳估计值不确定性较小,估计可靠。基于第j个EGF地震中第i个台站EGF的目标地震拐角频率最佳估计值,可将基于多个EGF地震多个台站的目标地震fc1估计值表示为以归一化拟合方差倒数为权重的加权平均值(Abercrombie et al,2017),即
$$ {f_{{\text{c}}1}} = \frac{{\displaystyle\sum\limits_i {\displaystyle\sum\limits_j { {\dfrac{f_{{\text{c}}1ij}}{{\rm{Va}}{{\rm{r}}_{ij}}}} } } }}{{\displaystyle\sum\limits_i {\displaystyle\sum\limits_j { {\dfrac{1}{{\rm{Va}}{{\rm{r}}_{ij}}}} } } }},$$ (3) 根据地震矩和拐角频率,地震应力降Δσ可表示为
$$ \Delta \sigma {{ = }}\frac{7}{{16}}{M_0}{\left( {\frac{{{f_{\text{c}}}}}{{k{\beta ^{}}}}} \right)^3} \text{,} $$ (4) 式中β为震源附近的剪切波速,k为与特定理论震源模型拐角频率球面平均相关的常数,根据Brune (1970),将S波k取0.37,根据Kaneko和Shearer (2014),k与震源破裂速度负相关,破裂速度为0.8β时,k分别取为0.35 (P波)和0.26 (S波)。
2. 芦山地震序列的应力降
2.1 芦山地震序列
2013年4月20日四川省雅安市芦山县发生MS7.0地震,主震后余震活动频繁,至2013年7月20日已累计发生余震5 800余次,主要分布于宝兴县、芦山县和天全县,大多数余震ML≤1.0,ML≥2.0余震约480次,余震最大震级为ML5.4,芦山地震序列发生于龙门山断裂西南段。我国数字强震动观测台网和主震后布设的5个流动观测强震动台站共收集到芦山地震序列的1200余组三分量强震动加速度记录,记录震中距主要介于5—300 km之间,记录到ML2.0—5.4余震176次,震源机制解表明多数余震与主震具有相似的逆冲破裂特征(林向东等,2013; 吕坚等,2013)。然而记录中震级较小的余震其记录数量较少,仅有约为26%的ML3.0—3.8余震和约为90%的ML3.8—5.4余震的记录数不少于4组,为确保可以获得足够多的小震记录作为EGF,本文选择32次ML3.8—5.4余震作为目标地震,目标地震和EFG地震分布如图1所示。
![]() 图 1 目标地震及其经验格林函数地震分布图中数字编号为筛选后的目标地震编号(按发震时间排序)Figure 1. Distribution of target earthquakes and its EGF earthquakesThe numbers in the figure mean the selected target earthquakes’ number (sorted by occuring time)
图 1 目标地震及其经验格林函数地震分布图中数字编号为筛选后的目标地震编号(按发震时间排序)Figure 1. Distribution of target earthquakes and its EGF earthquakesThe numbers in the figure mean the selected target earthquakes’ number (sorted by occuring time)2.2 应力降计算
本文以32次ML3.8—5.4芦山地震余震作为目标地震,根据EGF地震与目标地震震中距不超过10 km (Boyd et al,2017)、EGF地震至少比目标地震震级小1.0的原则,筛选符合条件的EGF地震。尽管林向东等(2013)和吕坚等(2013)表明芦山地震序列多数余震震源机制解与主震具有类似的逆冲破裂特征,为确保目标地震与EGF地震具有相似的震源机制,本文规定了在同一个台站两次地震的观测记录波形的互相关系数不小于0.5 (Viegas et al,2010),较高的互相关系数说明记录波形相似,可进一步表明两次地震震源机制较为一致。计算互相关系数时采用窄带宽0.4—1.0 Hz的巴特沃斯带通滤波对同台站观测记录进行处理,可保证高频截止远低于目标地震的拐角频率,且信号在大于低频截止的频带范围有较好的信噪比条件。本文采用全时程加速度观测记录进行计算,为避免不同记录的初始时刻不一致,本文将滤波后的记录经快速傅里叶变换转至频域,对目标地震记录及其EGF的振幅谱计算互相关系数。
选取出目标地震及其EGF后,依次采用对强震动记录进行零线校正、记录首尾加余弦窗并补零、带宽0.2—50 Hz巴特沃斯非因果带通滤波处理。计算两个水平分量在对数空间下均匀分布的1000个频率点的傅里叶幅值谱,频率在对数空间下采样可对拟合中的低频和高频进行权重(Ide et al,2003)。采用Konno和Ohmachi (1998)窗函数平滑傅里叶谱,以两个水平分量傅里叶谱的矢量和来表示水平向傅里叶谱。计算每个目标地震记录及其EGF的傅里叶谱比,最后给出目标地震拐角频率的最佳估计值。
为保证EGF谱比法估计地震拐角频率的可靠性,本文规定了以下EGF谱比曲线的质量标准:
1) 当且仅当EGF地震的拐角频率fcj在有效频带内且高频段范围内的谱比曲线出现明显的平台段时,fcj可看作是EGF地震拐角频率的可靠估计值。
2) 为确保谱比曲线的中间频段出现明显的ω−2衰减,低频段和高频段平台幅值应相差足够大,因此规定M01/M0j≥5.6,即目标地震和EGF地震的矩震级相差不小于0.5,确保了EGF地震的震源时间函数相对目标地震可近似看作delta函数(Holmgren et al,2019)。
3) 再次拟合目标地震拐角频率时,随fc1可能值变化的Var应呈开口向上的抛物线型,且(fc1max−fc1min)/fc1≤2,如不满足此条件,则给出的fc1最佳估计值不可靠,fc1最佳估计值低于有效频段,谱比曲线的低频段无明显平台段。
4) Var最小值应不大于3×10⁻²。
图2给出了基于EGF谱比法计算目标地震拐角频率的算例,以2013年4月20日08:06:35发生的ML4.8地震作为目标地震,根据筛选原则,选择了16次ML3.3—3.7余震作为EGF地震(图2a),共获得了22条符合的质量标准EGF谱比曲线,以2013年4月24日21:36:36发生的ML3.3地震中051BXD台站记录作为EGF地震时,目标地震及EGF地震在051BXD台站观测记录的水平向傅里叶谱如图2b所示,相应的傅里叶谱比如图2c中黑色虚线所示,低频段和高频段均出现明显的平台段,而中间频段则为明显的ω−2衰减,低频段和高频段平台幅值相差很大,经拟合得到M01/M0j=56.26≥5.6,满足要求。拐角频率不确定性如图2c所示,可见fc1可能值变化时的一系列拟合曲线(彩色实线)和最小方差的最佳拟合(粗黑实线),随fc1变化,拟合得出的fcj和M01/M0j如图2d所示,Var随fc1的变化如图2e所示,可见Var的拟合值呈开口向上的抛物线型,Var最小值为8.96×10−4≤3×10−2,(fc1max−fc1min)/fc1=0.19<2,均满足谱比曲线质量标准。利用这两次地震在051BXD台站的记录谱比,计算拐角频率的最佳估计值fc1=1.4 Hz和fcj=5.1 Hz。而利用22条EGF谱比曲线计算出的目标地震拐角频率fc1估计值及其加权平均值和加权标准差范围如图2f所示。
![]() 图 2 EGF谱比法计算目标地震拐角频率算例(a) 目标地震及其EGF地震和触发台站位置分布;(b) 水平向傅氏谱;(c) EGF谱比曲线拟合;(d) M01/M0j,ƒcj随ƒc1可能值的变化;(e) Var随ƒc1可能值(颜色与图(c)对应)的变化;(f) 基于多个EGF谱比曲线的目标地震拐角频率估计值Figure 2. An example of estimating target earthquake 's corner frequency by spectral ratio method(a) Target earthquakes ,EGF earthquakes and trigger stations location distribution ; (b) Horizontal fourier spectrum ;(c) EGF spectral ratio curve fitting;(d) M01/M0j,fcj vary with the possible value of fc1;(e) Var varies with the possible value of fc1 ,color corresponding to figure (c);(f) Estimated value of target earthquake’s corner frequency based on multiple EGF spectral ratio curves
图 2 EGF谱比法计算目标地震拐角频率算例(a) 目标地震及其EGF地震和触发台站位置分布;(b) 水平向傅氏谱;(c) EGF谱比曲线拟合;(d) M01/M0j,ƒcj随ƒc1可能值的变化;(e) Var随ƒc1可能值(颜色与图(c)对应)的变化;(f) 基于多个EGF谱比曲线的目标地震拐角频率估计值Figure 2. An example of estimating target earthquake 's corner frequency by spectral ratio method(a) Target earthquakes ,EGF earthquakes and trigger stations location distribution ; (b) Horizontal fourier spectrum ;(c) EGF spectral ratio curve fitting;(d) M01/M0j,fcj vary with the possible value of fc1;(e) Var varies with the possible value of fc1 ,color corresponding to figure (c);(f) Estimated value of target earthquake’s corner frequency based on multiple EGF spectral ratio curves本文选用32个目标地震中,17个目标地震(见表1)具有不少于2个满足质量标准的EGF谱比曲线,根据式(2)对每个目标地震基于不同EGF的拐角频率选取最佳估计值,再根据式(3)给出17个目标地震的拐角频率加权平均值(见表1),这些拐角频率主要介于1.0—2.0 Hz之间。为计算这些地震的应力降,本文直接采用其它研究给出的芦山余震地震矩震级,包括易桂喜等(2016)基于CAP波形反演方法给出的地震矩震级和温瑞智等(2015)基于地震动广义谱反演给出的地震矩震级,并根据式(4)给出目标地震的应力降(见表1),其中k取0.37,根据龙门山断裂带南段速度结构(郑勇等,2013)并考虑到选用地震的震源深度范围(10—20 km),取β=3.6 km/s。地震应力降在0.77—24.31 MPa范围内,应力降中位值为9.41 MPa,平均值为9.98 MPa,明显高于温瑞智等(2015)基于广义谱反演方法给出的30次芦山余震的平均应力降(3.14 MPa),也明显高于Wang和Wen (2020)给出的46次MW3.4—5.9伽师地震序列的平均应力降(3.942 MPa)以及喻畑和李小军(2012)给出的13次汶川MW>5.0余震的平均应力降(3.80 MPa)。EGF谱比法的应力降估计值偏高可能与低频段信噪比质量较差引起的目标地震拐角频率估计偏高有关。本文估计的芦山余震(ML3.8—5.4)的拐角频率主要在1.0—2.0 Hz范围内,接近或位于噪声影响大的低频段,若EGF谱比法估计M2和M3左右小震的应力降,则信噪比质量对拐角频率估计结果影响相对较小。
表 1 目标地震的震源参数Table 1. Source parameters of target earthquakes地震序号 发震时间 ML 震中位置 EGF地震个数 记录数 ƒc1/Hz MW Δσ/MPa 年-月-日 时:分:秒 北纬/° 东经/° 1 2013-04-20 08:06:38 4.8 30.18 102.88 16 22 1.56 2 2013-04-20 08:31:34 4.1 30.39 103.01 2 3 1.91 5 2013-04-20 09:02:57 4.6 30.28 102.93 9 9 1.28 4.67* 4.41 6 2013-04-20 09:11:51 4.3 30.25 102.83 9 14 1.67 4.76* 13.35 7 2013-04-20 09:20:09 4.6 30.17 102.99 3 3 2.48 4.59* 24.31 8 2013-04-20 09:26:00 4.4 30.19 102.95 3 4 1.66 4.21† 1.96 9 2013-04-20 09:37:28 4.9 30.28 102.99 18 20 1.87 4.78* 20.09 10 2013-04-20 09:39:34 4.5 30.13 102.84 5 5 1.44 4.54* 4.00 14 2013-04-20 11:34:17 5.3 30.24 102.94 23 114 1.16 5.15* 17.21 16 2013-04-21 11:59:37 4.9 30.26 103.00 7 8 1.34 4.85* 9.41 17 2013-04-21 12:39:18 3.8 30.22 102.89 2 2 1.64 3.95* 0.77 18 2013-04-21 17:05:22 5.4 30.34 103.00 15 91 1.14 5.09* 13.28 19 2013-04-21 17:30:24 4.2 30.28 102.98 14 15 2.21 4.27* 5.70 21 2013-04-21 22:16:54 4.3 30.33 102.93 20 28 1.91 4.32* 4.37 22 2013-04-23 05:54:49 4.5 30.35 103.00 6 6 1.67 4.32* 2.92 23 2013-04-23 22:07:15 3.8 30.29 102.96 4 4 5.14 3.76* 12.31 24 2013-05-01 02:14:13 4.1 30.25 102.89 9 9 3.2 4.24* 15.59 注:标*数据来自易桂喜等(2016),标†数据来自温瑞智等(2015)。 地震应力降随震级变化如图3所示,小震级地震的应力降的离散性更明显,地震应力降与震级有较为明显的相关性,震级越大则地震应力降普遍较高,此次地震序列可能不服从地震的自相似性,虽然地震自相似性在很多研究中得到证实(Allmann,Shearer,2009;Oth et al,2010),但在很多具体的地震序列中也发现了随震级明显变化的地震应力降(Pacor et al,2016;Li et al,2020;Trugman,2020)。随震级大而增大的应力降预示着震级更大的地震在相对较小的震源破裂尺度上的破裂滑动相对较大,相应的会产生更强的高频地震动。
针对17个目标地震所选的一系列EGF地震,根据式(2)可得出小震作为经验格林函数与不同的目标地震建立谱比的拐角频率估计值ƒcj,同时将得出的满足质量标准的EGF谱比曲线数量较多的EGF地震的拐角频率加权平均值,列于表2。
表 2 部分EGF地震的拐角频率Table 2. Corner frequency of partial EGF earthquakes发震时间 ML 震中位置 记录数 ƒcj/Hz 年-月-日 时:分:秒 北纬/° 东经/° 2013-04-20 22:10:32 3.1 30.28 102.39 4 6.78 2013-04-29 13:45:40 3.0 30.26 102.88 3 2.79 2013-04-25 01:20:15 3.2 30.29 102.88 5 3.58 2013-04-25 14:11:22 3.0 30.28 102.92 12 6.51 2013-04-22 19:04:52 3.1 30.21 102.96 3 2.42 2013-04-24 21:36:35 3.1 30.26 102.90 12 3.91 3. 结论
EGF谱比方法是估计震源参数的常用方法之一,本文基于EGF谱比方法,利用2013年芦山强余震的强震动观测记录,给出了17次芦山余震的地震拐角频率及应力降,主要结论如下:
1) 为确保地震拐角频率和应力降的可靠估计,给出了EGF谱比曲线的质量评判标准,谱比曲线应满足高频和低频平台段水平差异明显且中间频段为明显的ω−2衰减,谱比曲线拟合方差随fc变化呈开口向上且明显谷值的抛物线型。
2) 基于EGF谱比方法,估计了芦山余震中17次ML3.8—5.4目标地震的拐角频率,主要介于1.0—2.0 Hz之间。拐角频率估计值偏高,噪声对低频地震动更大的影响可能是导致拐角频率估计偏大的原因,而采用P波或S波的EGF谱比结果可能优于本文采用的全波形的EGF谱比结果.
3) 采用前人研究所给出的地震矩震级,计算给出芦山地震15次余震的应力降,介于0.77—24.31 MPa之间,平均值为9.98 MPa,应力降表现出明显的震级相关。
-
![]()
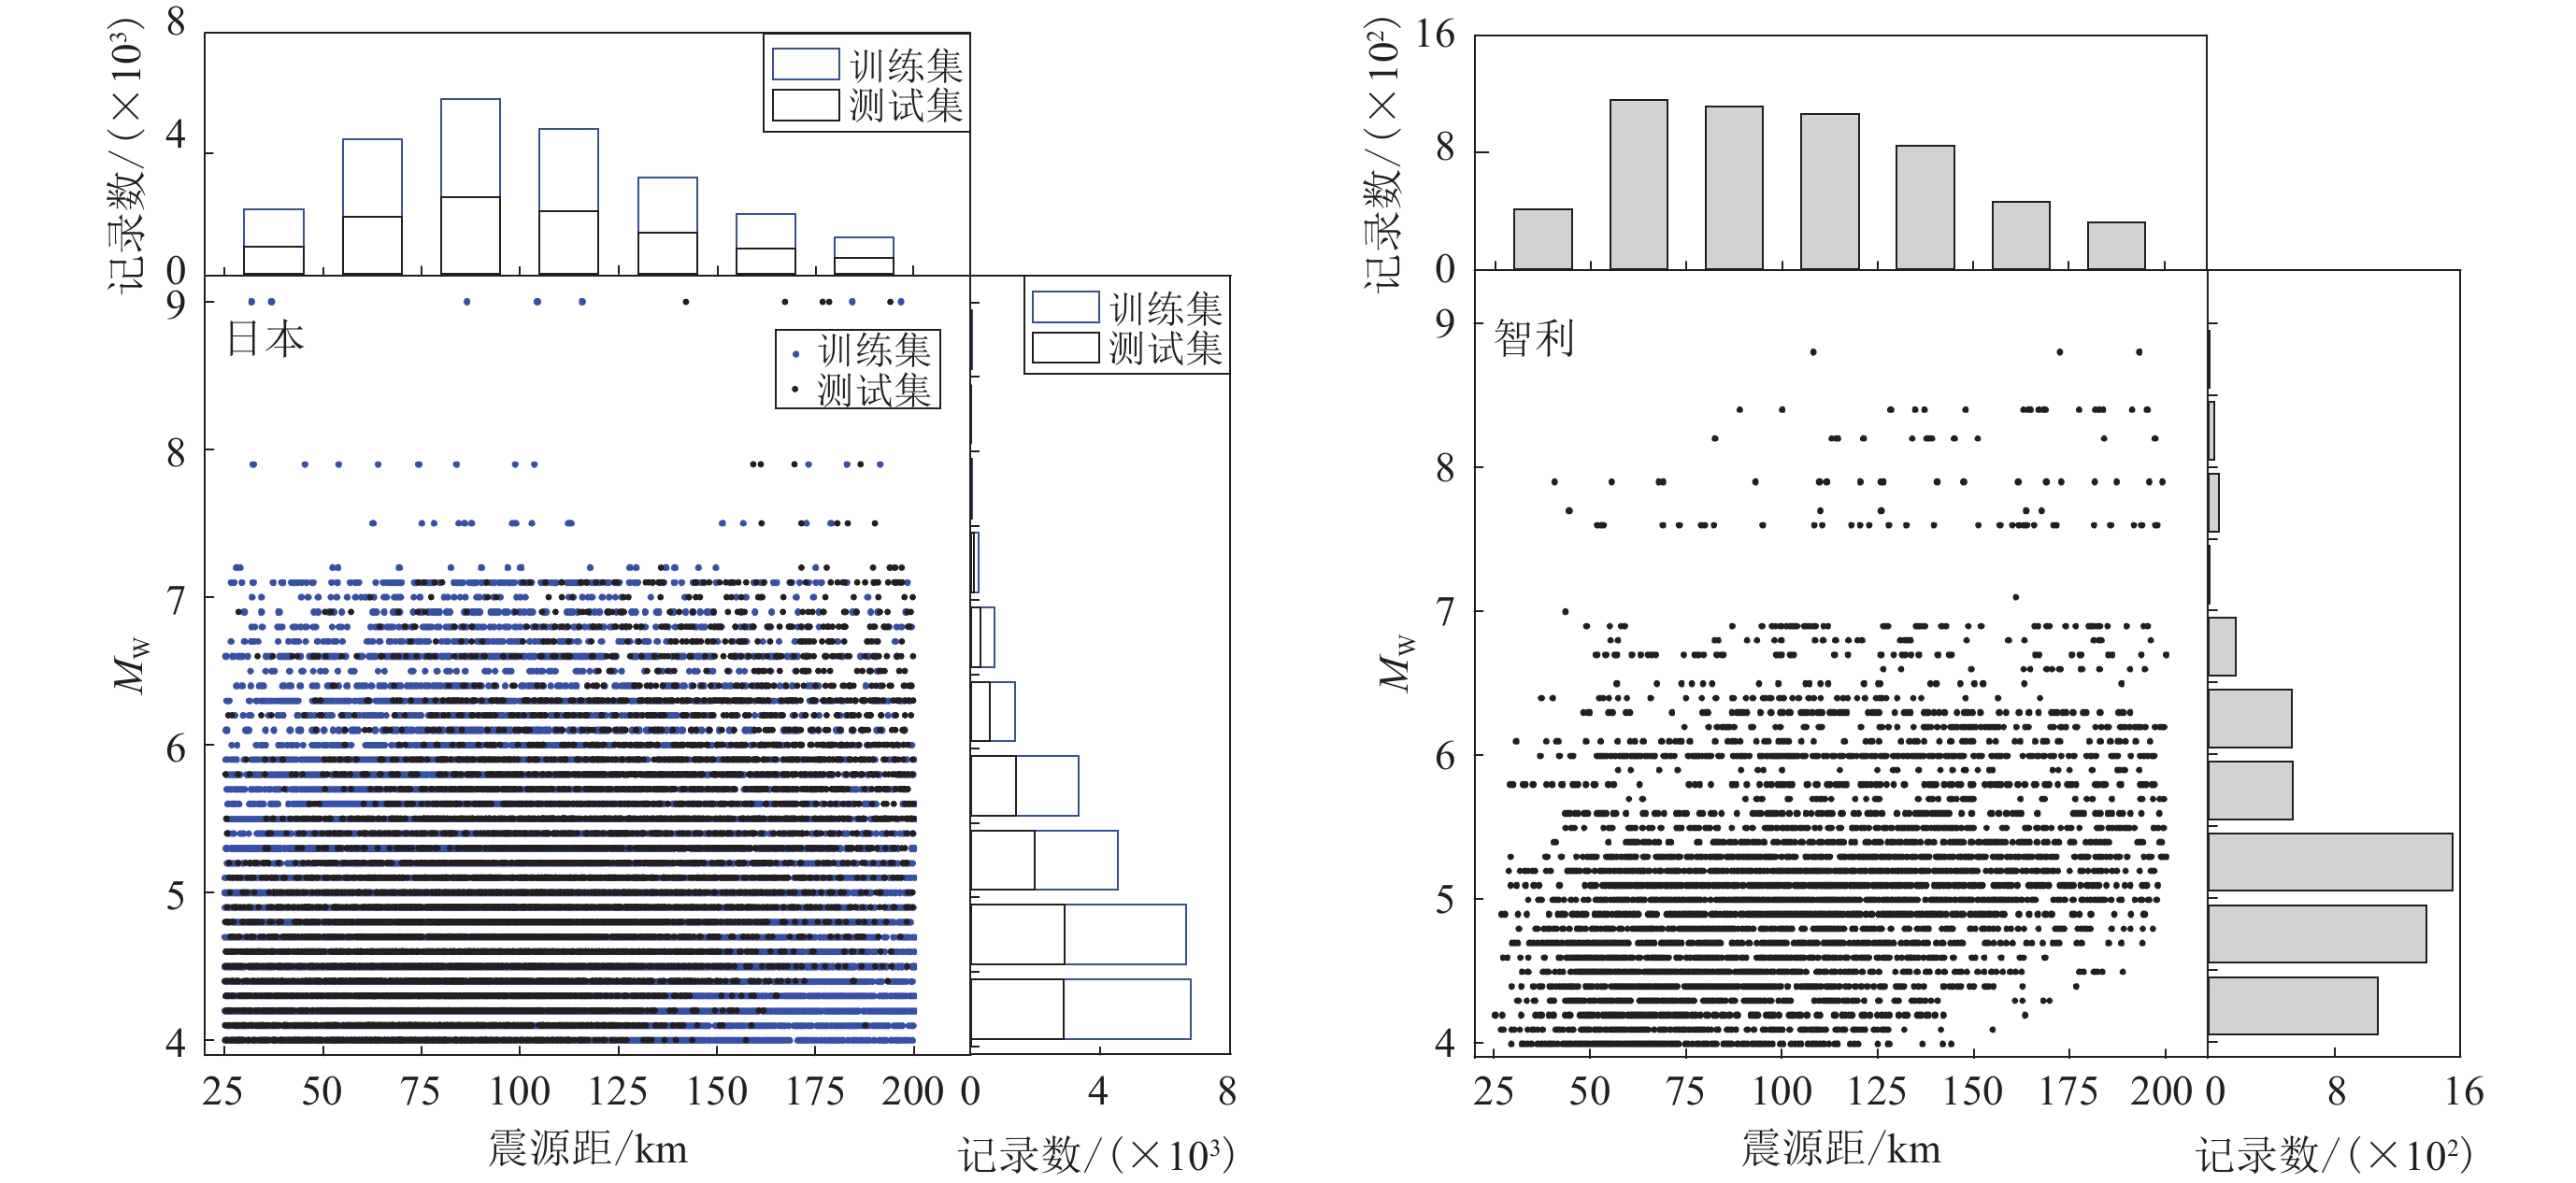
图 1 强震动记录随震级和震源距的分布(每个点代表一条地震动记录)
Figure 1. Distribution of strong motion records with magnitude and hypocentral distance (each point represents a ground motion record)
![]()
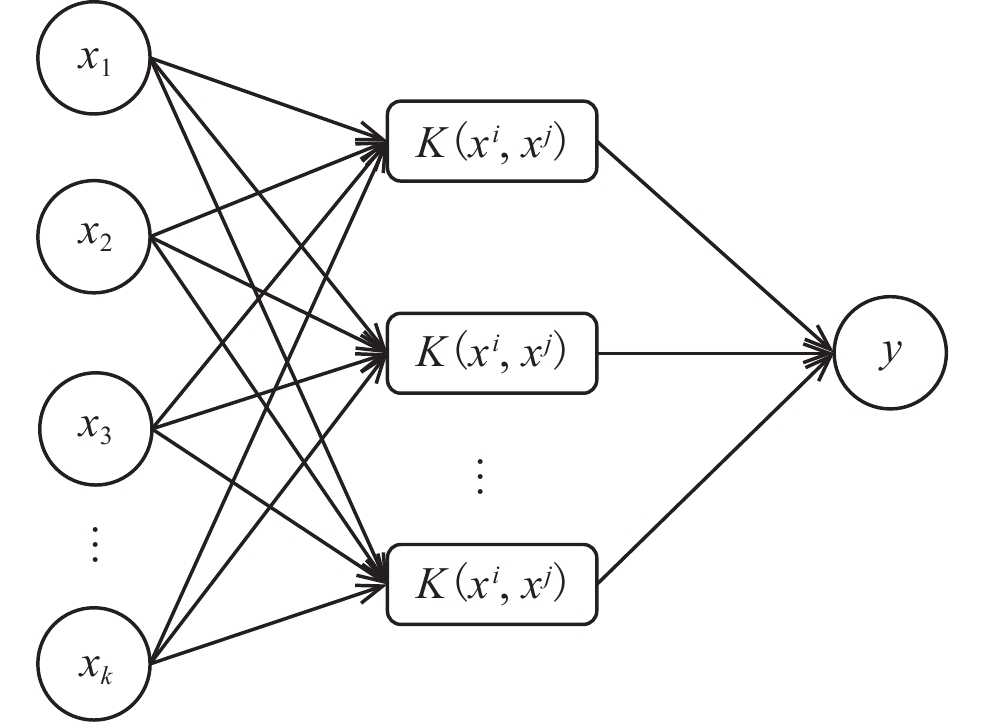
图 2 GPR的网络结构示意图
x为输入,K(${x^{i}}\text{,} x^{j} $)为协方差函数,y为输出
Figure 2. Schematic diagram of the GPR network structure
x is the input,K(${x^{i}}\text{,} x^{j} $) is the covariance function,and y is the output
![]()
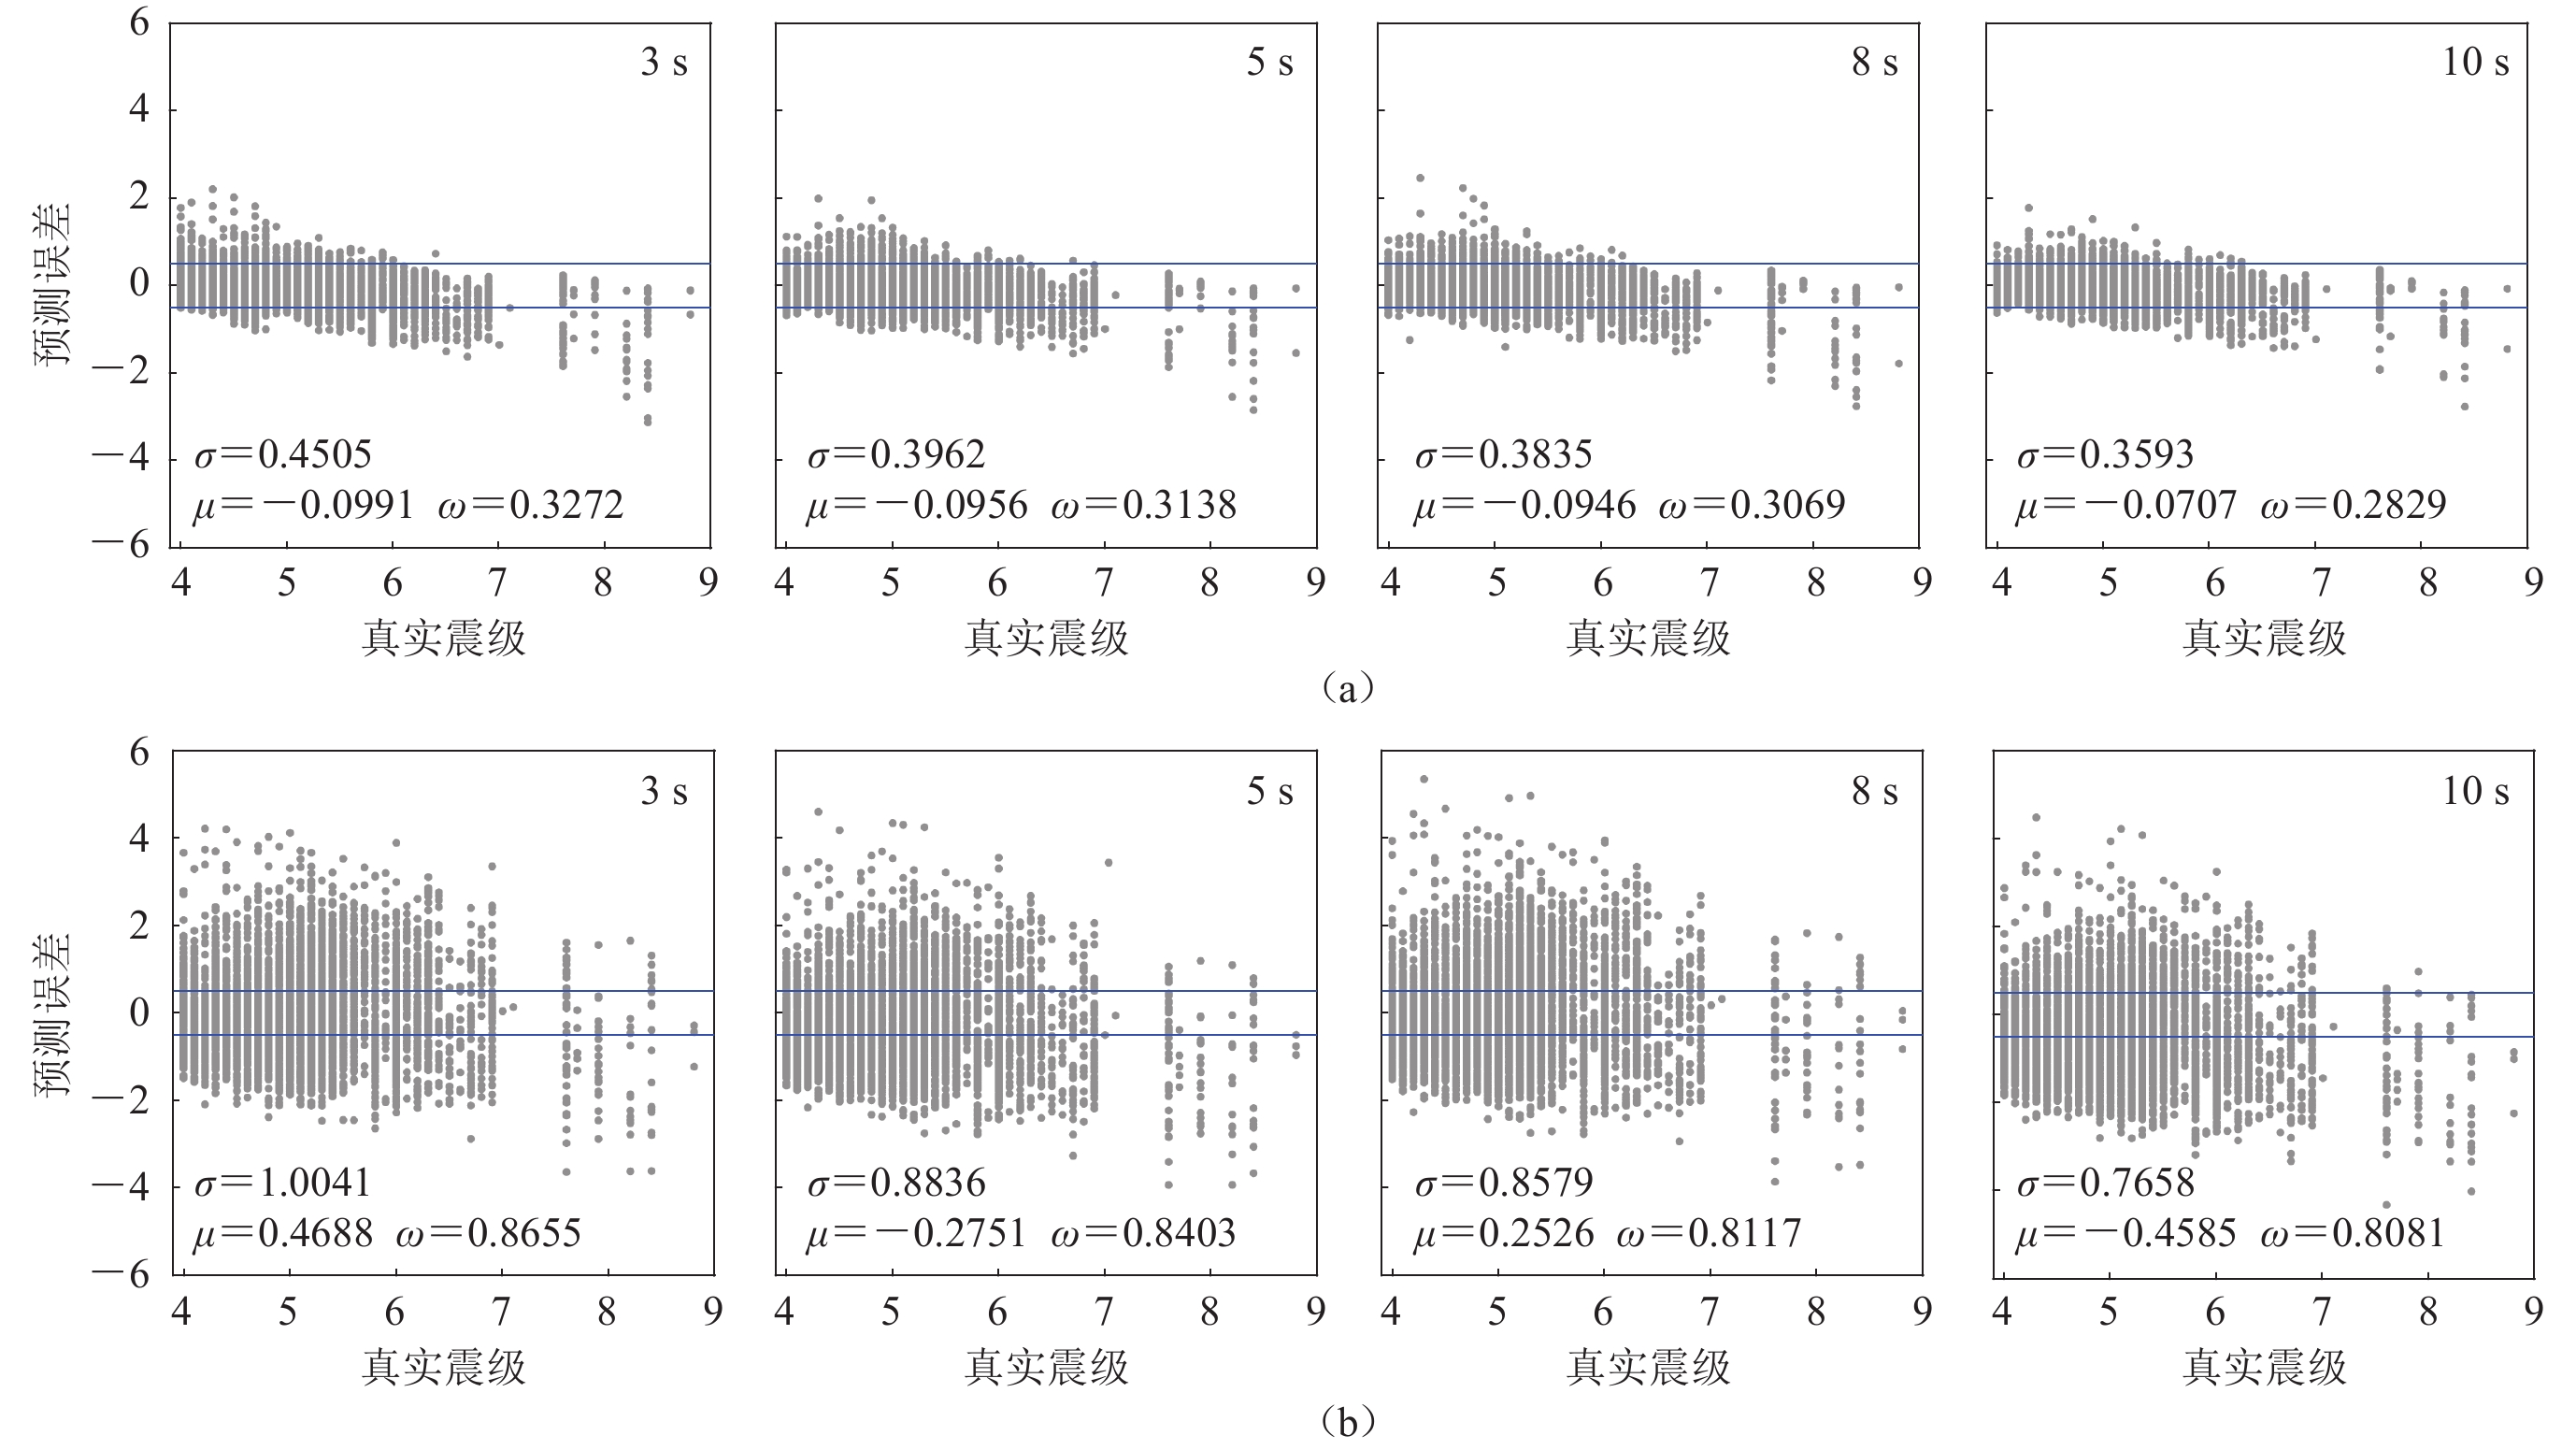
图 3 初至3 s P波时GPR-M (a)和$ {\tau ^{\max }_{\mathrm{p}}}$(b)估算震级的误差分布及其直方图
图中的散点表示每条记录估算震级的误差,蓝色实线和红色虚线表示±0.5,σ为误差标准差,μ为误差均值,ω为误差绝对值均值,准确率定义为误差在$ [ $−0.5, 0.5$ ] $的记录数与记录总数的比值,下同
Figure 3. Distribution of estimated magnitude errors by GPR-M (a) and $ {\tau ^{\max }_{\mathrm{p}}}$ (b) at initial 3 s P-wave
Scatter points show magnitude estimation errors based on per record. Blue solid lines and red dashed lines indicate ±0.5 . σ is error standard deviation,μ is mean error,ω is mean absolute error,accuracy is the ratio of records with errors in $ [ $−0.5,0.5$ ] $ to total records,the same below
![]()
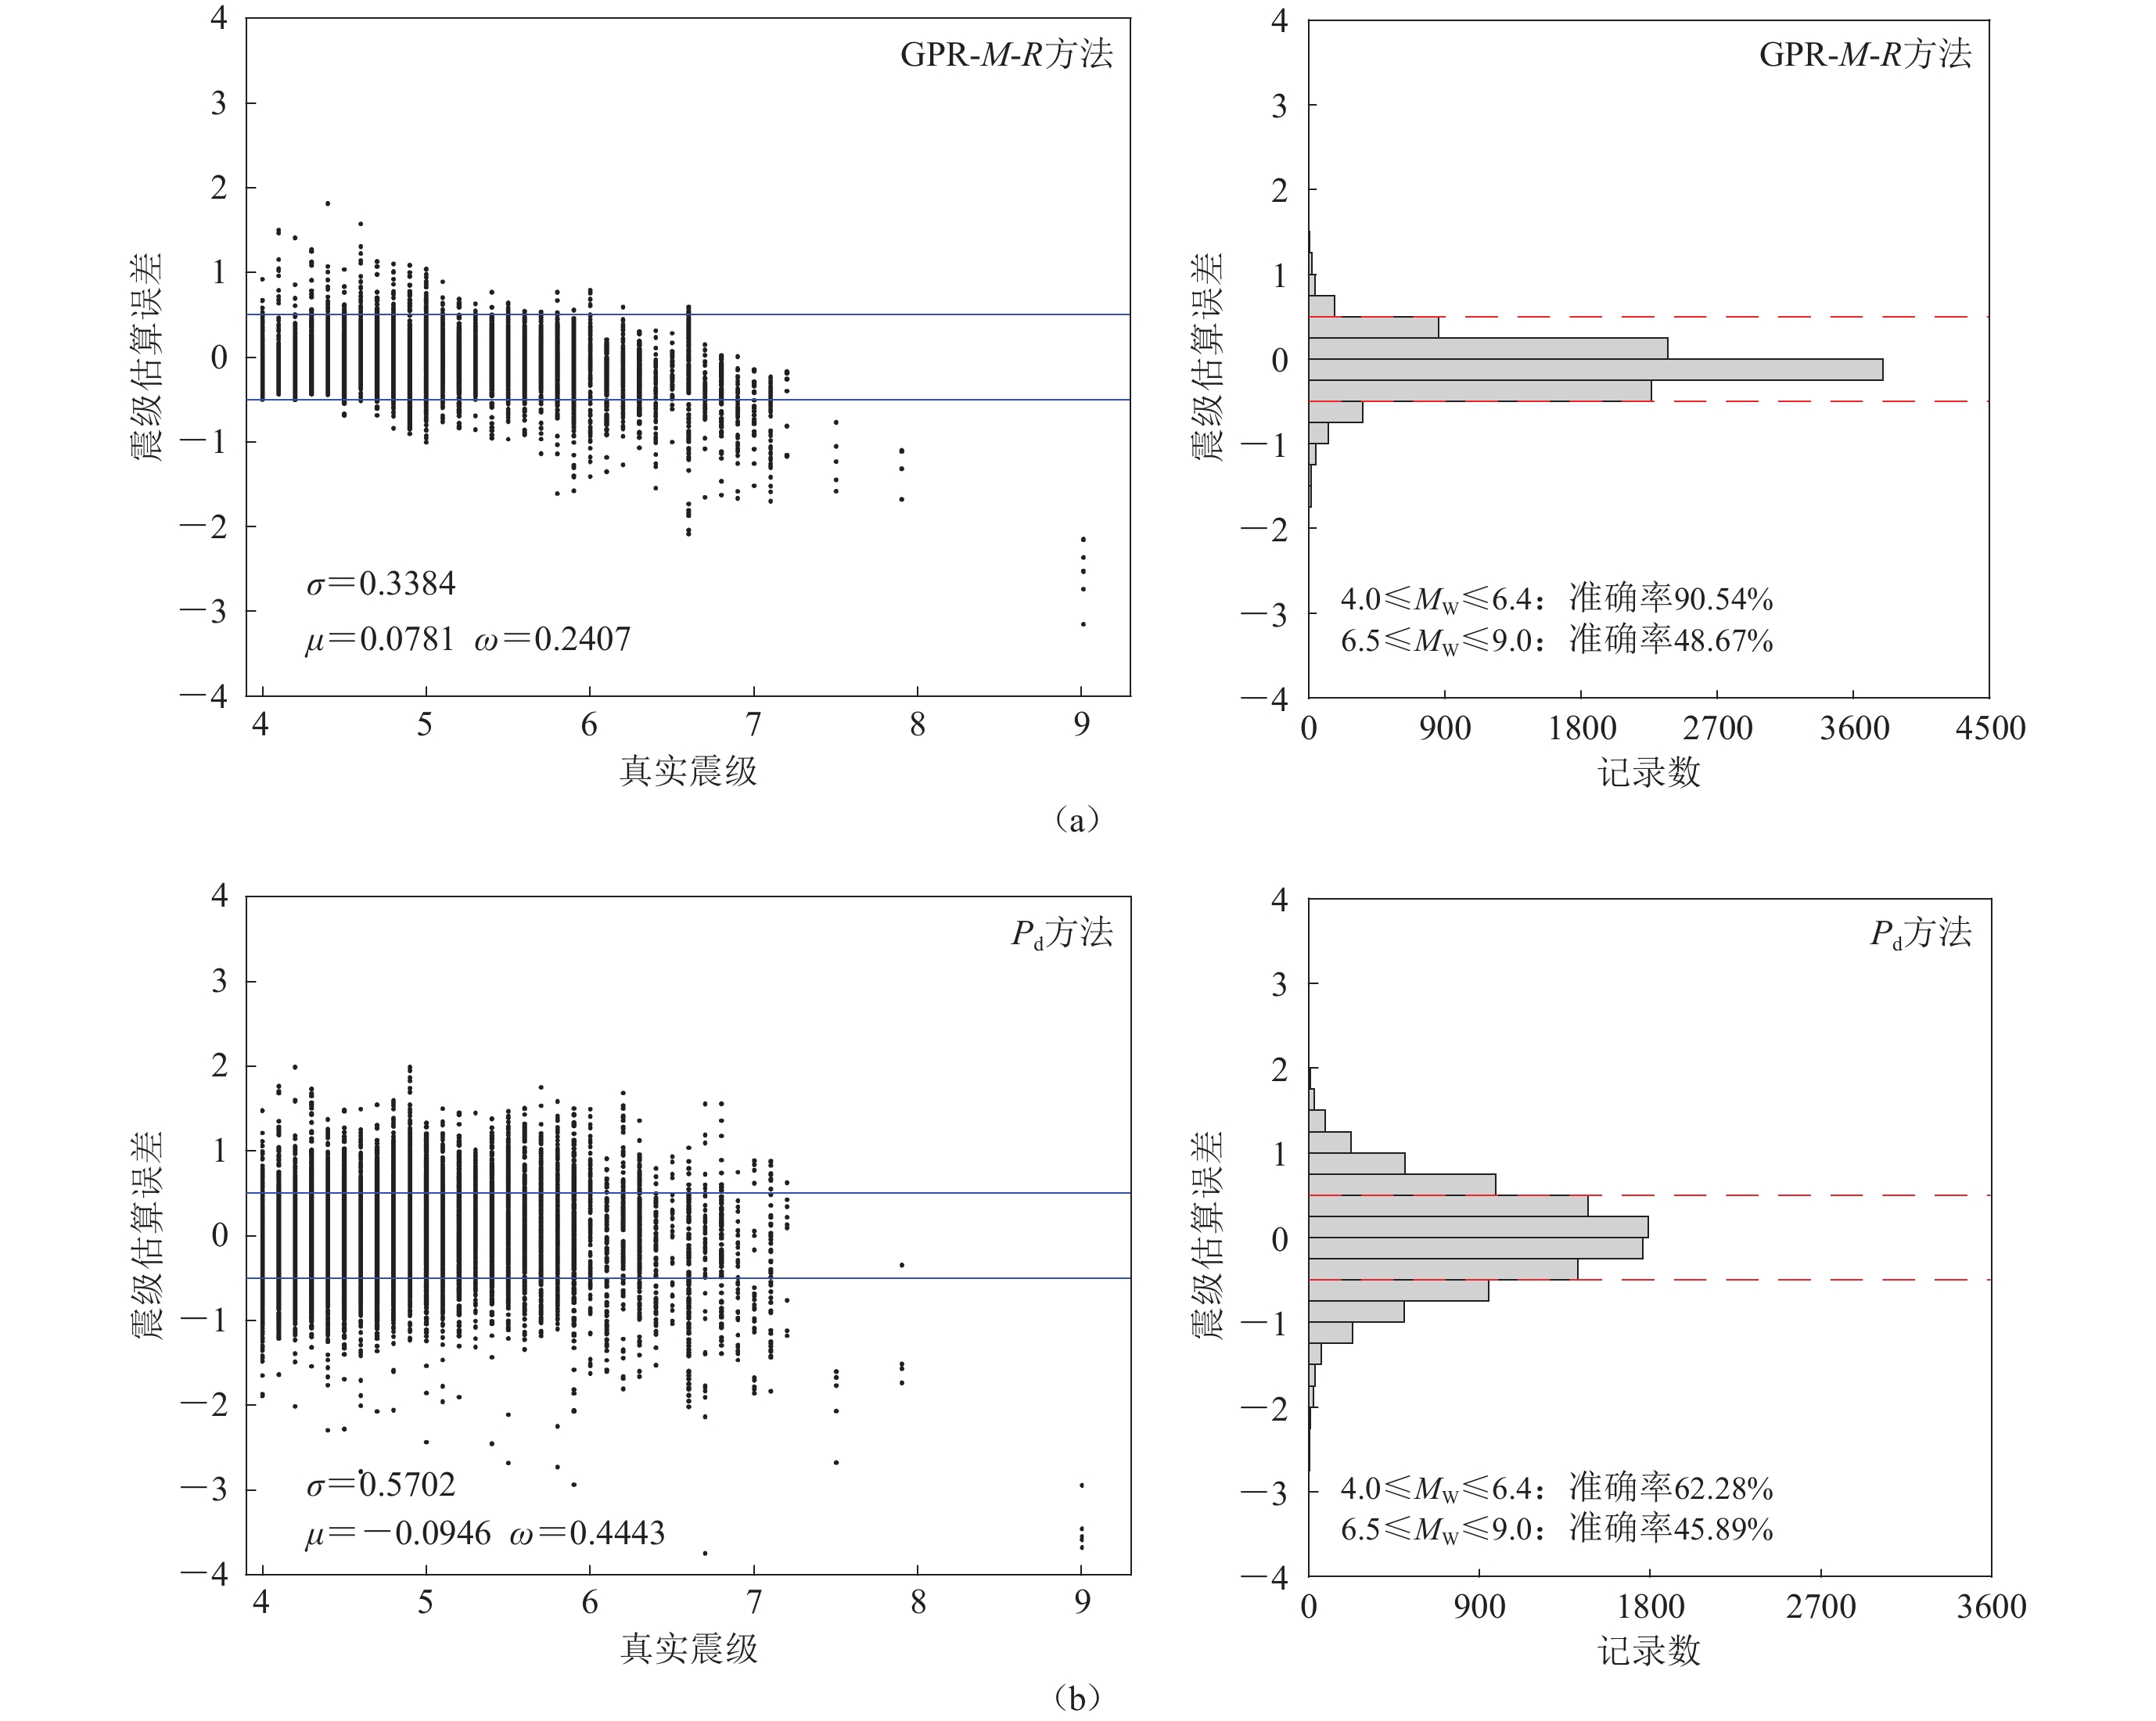
图 4 初至3 s P波GPR-M-R (a)和P d (b)方法估算震级的误差分布
Figure 4. Distributions and histograms of estimated magnitude errors for GPR-M-R (a) and P d (b) for initial 3 s P-wave
![]()
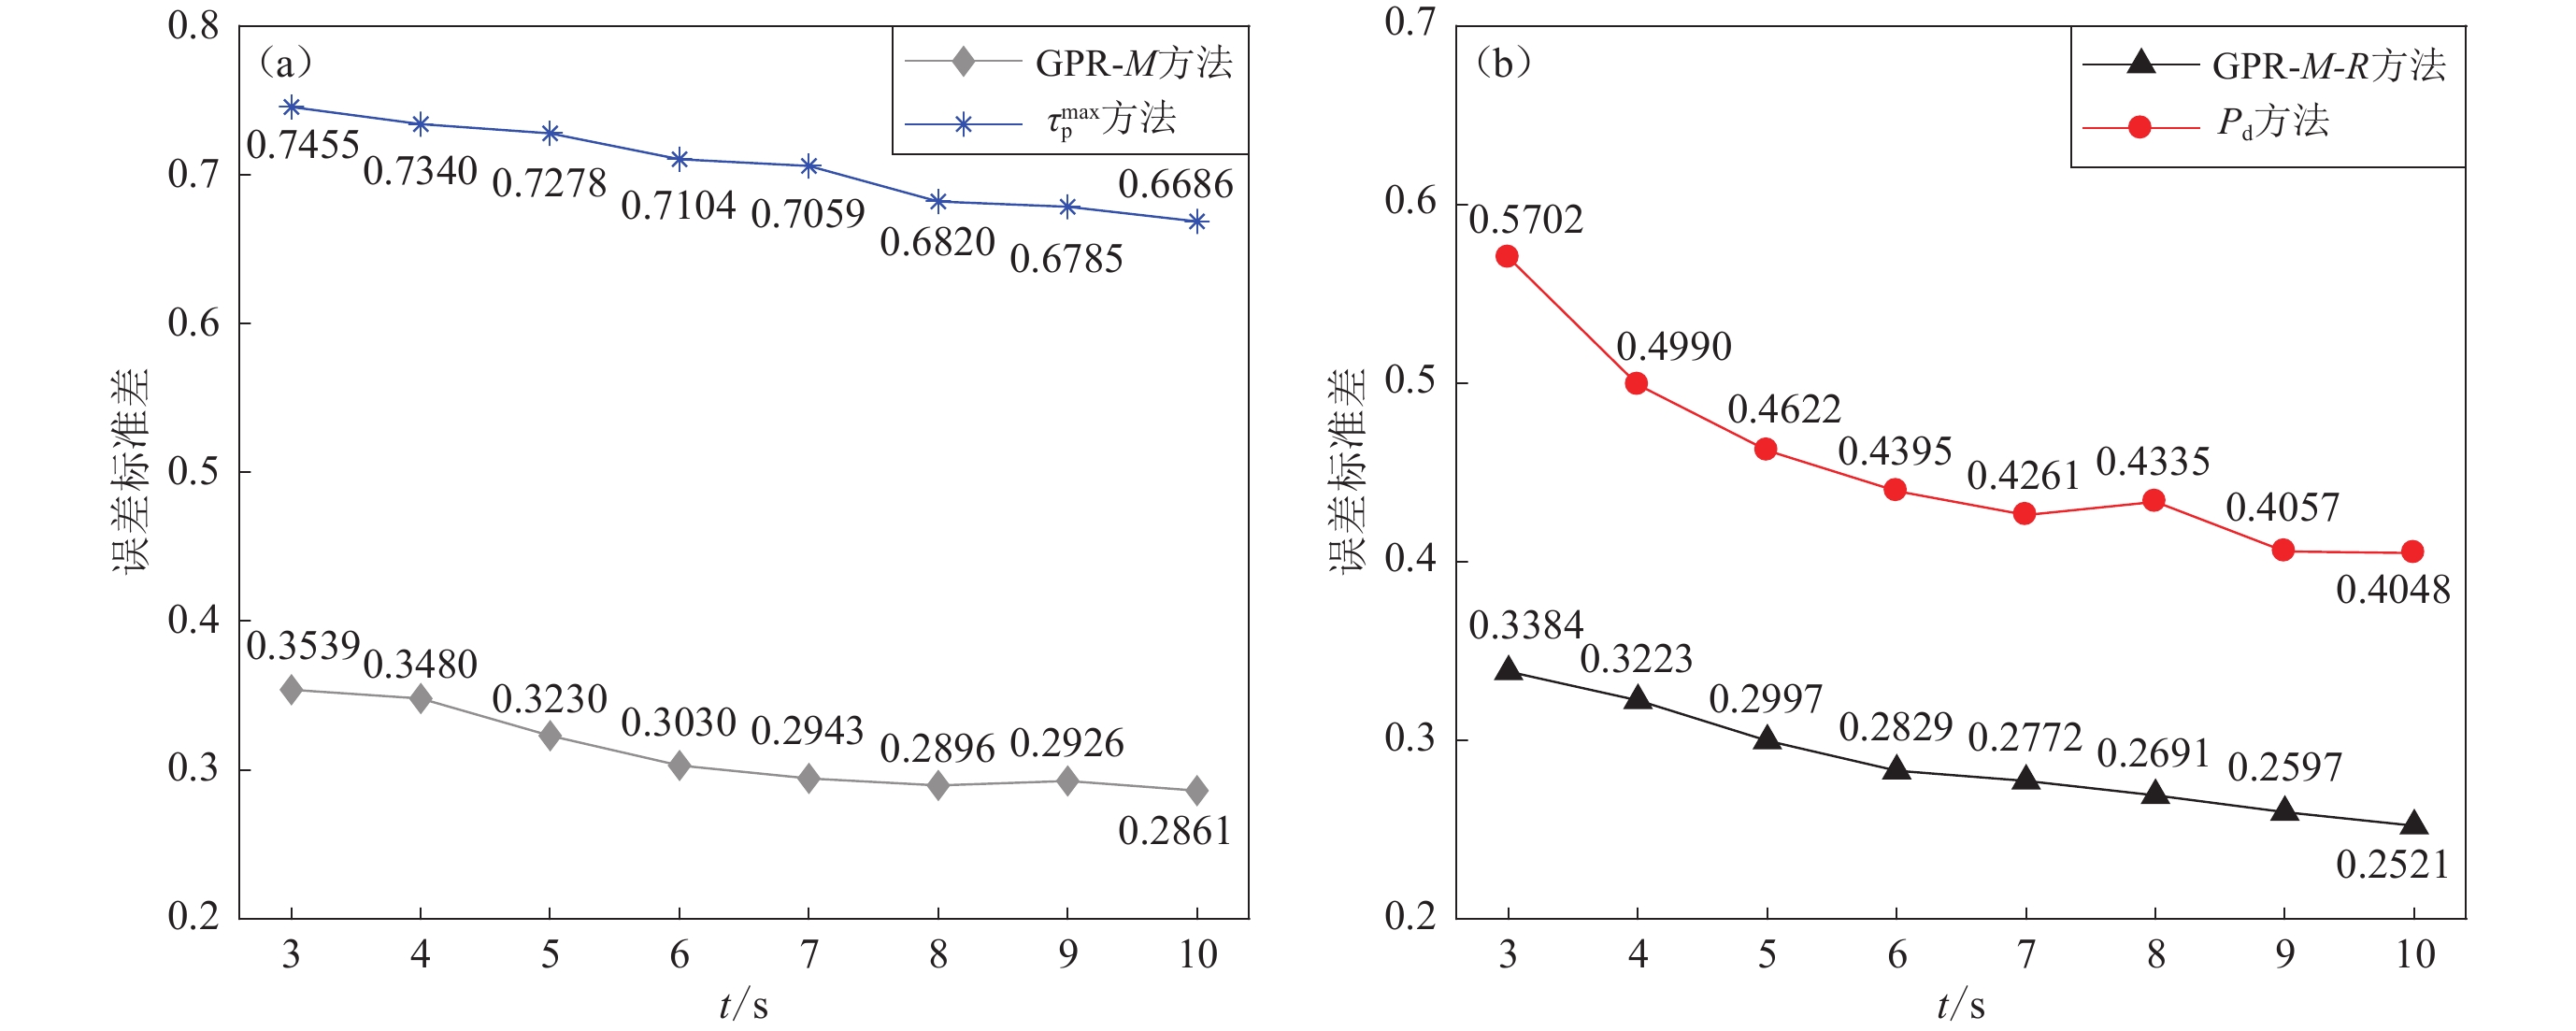
图 5 初至3—10 s地震波的不同方法估算震级的误差标准差对比
(a) GPR-M与$ {\tau ^{\max }_{\mathrm{p}}}$方法对比;(b) GPR-M与P d方法对比
Figure 5. Comparison of the standard deviation of errors in estimating magnitudes for initial 3−10 s seismic waves
(a) Comparison of GPR-M method with $ {\tau ^{\max }_{\mathrm{p}}}$ method ;(b) Comparison of GPR-M method with P d method
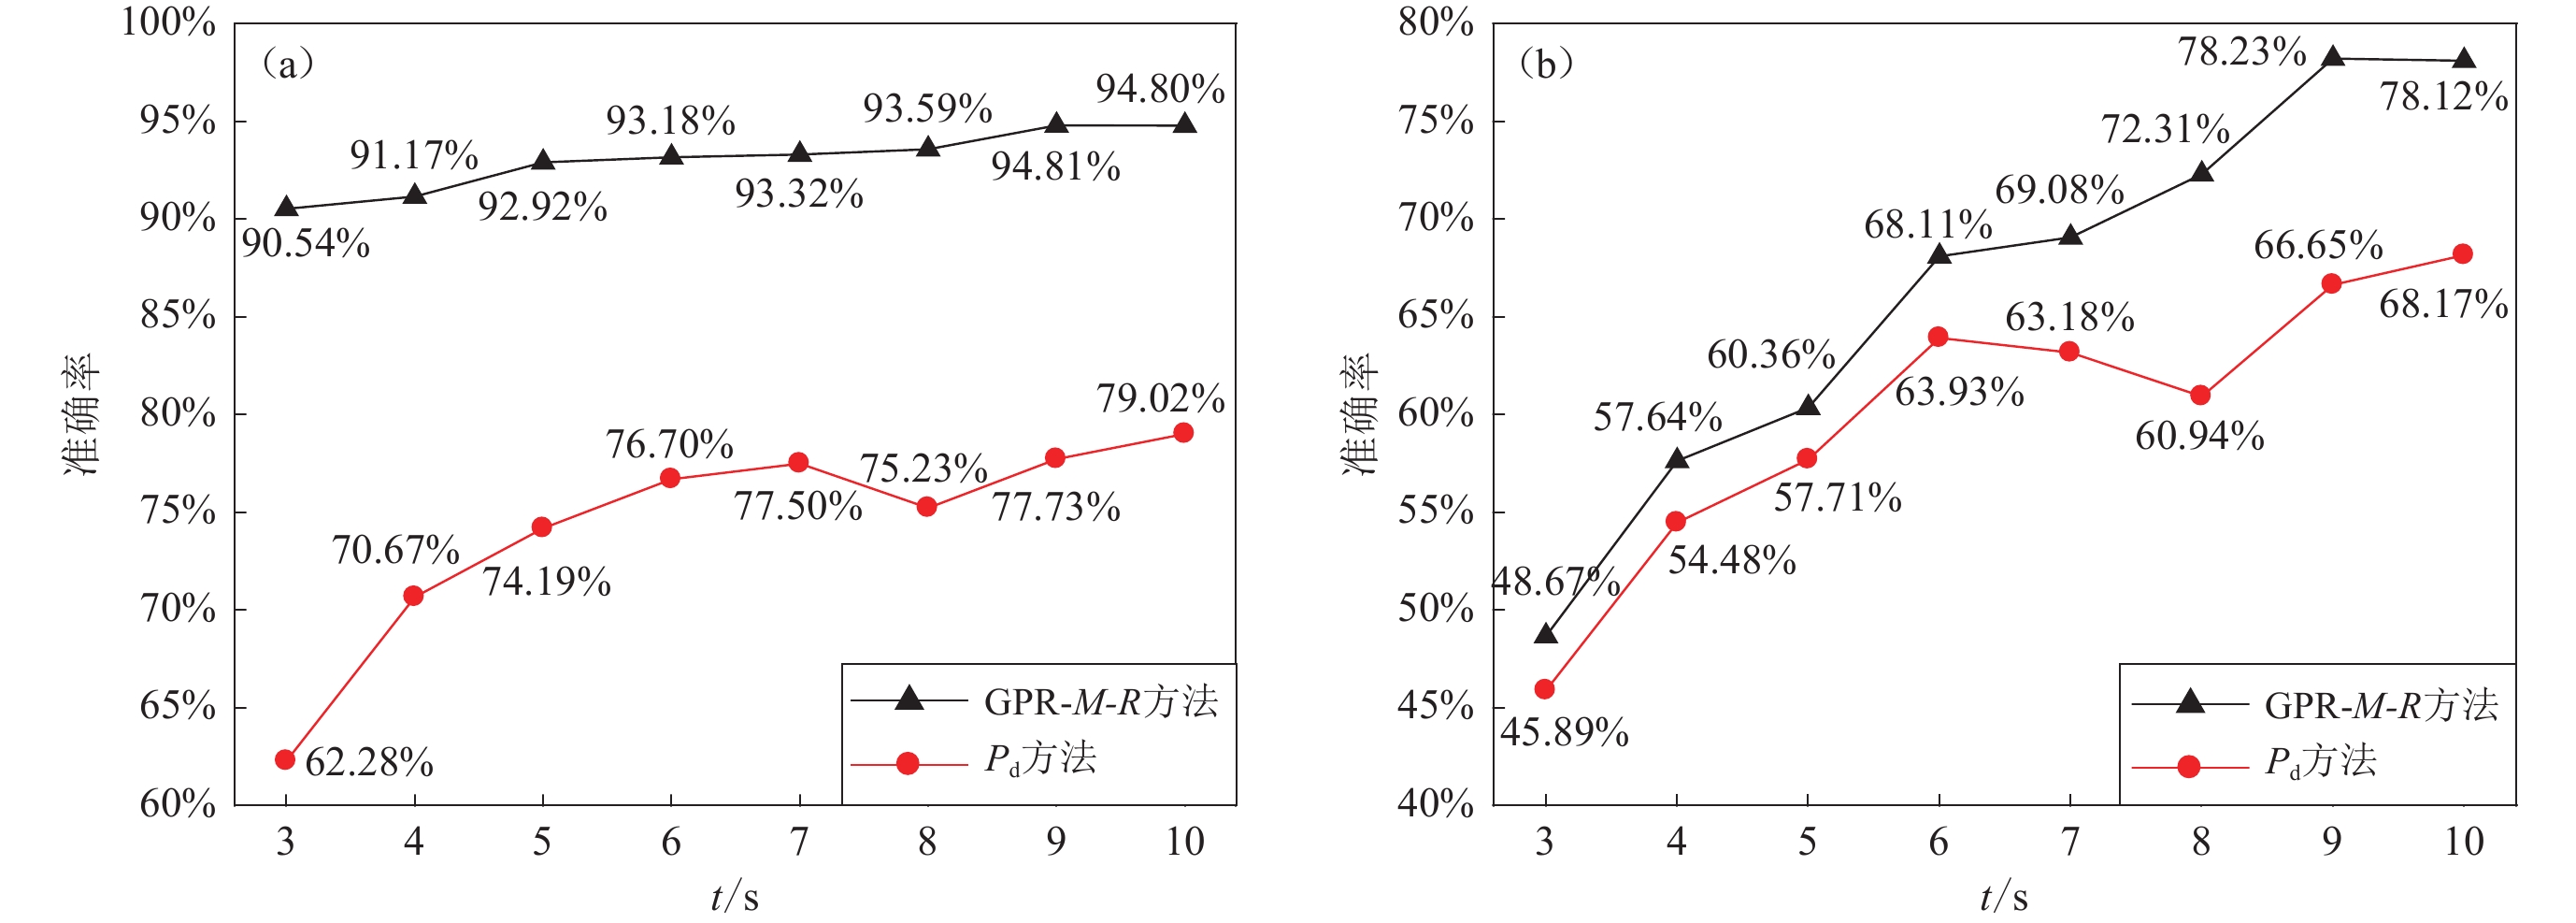
![]()
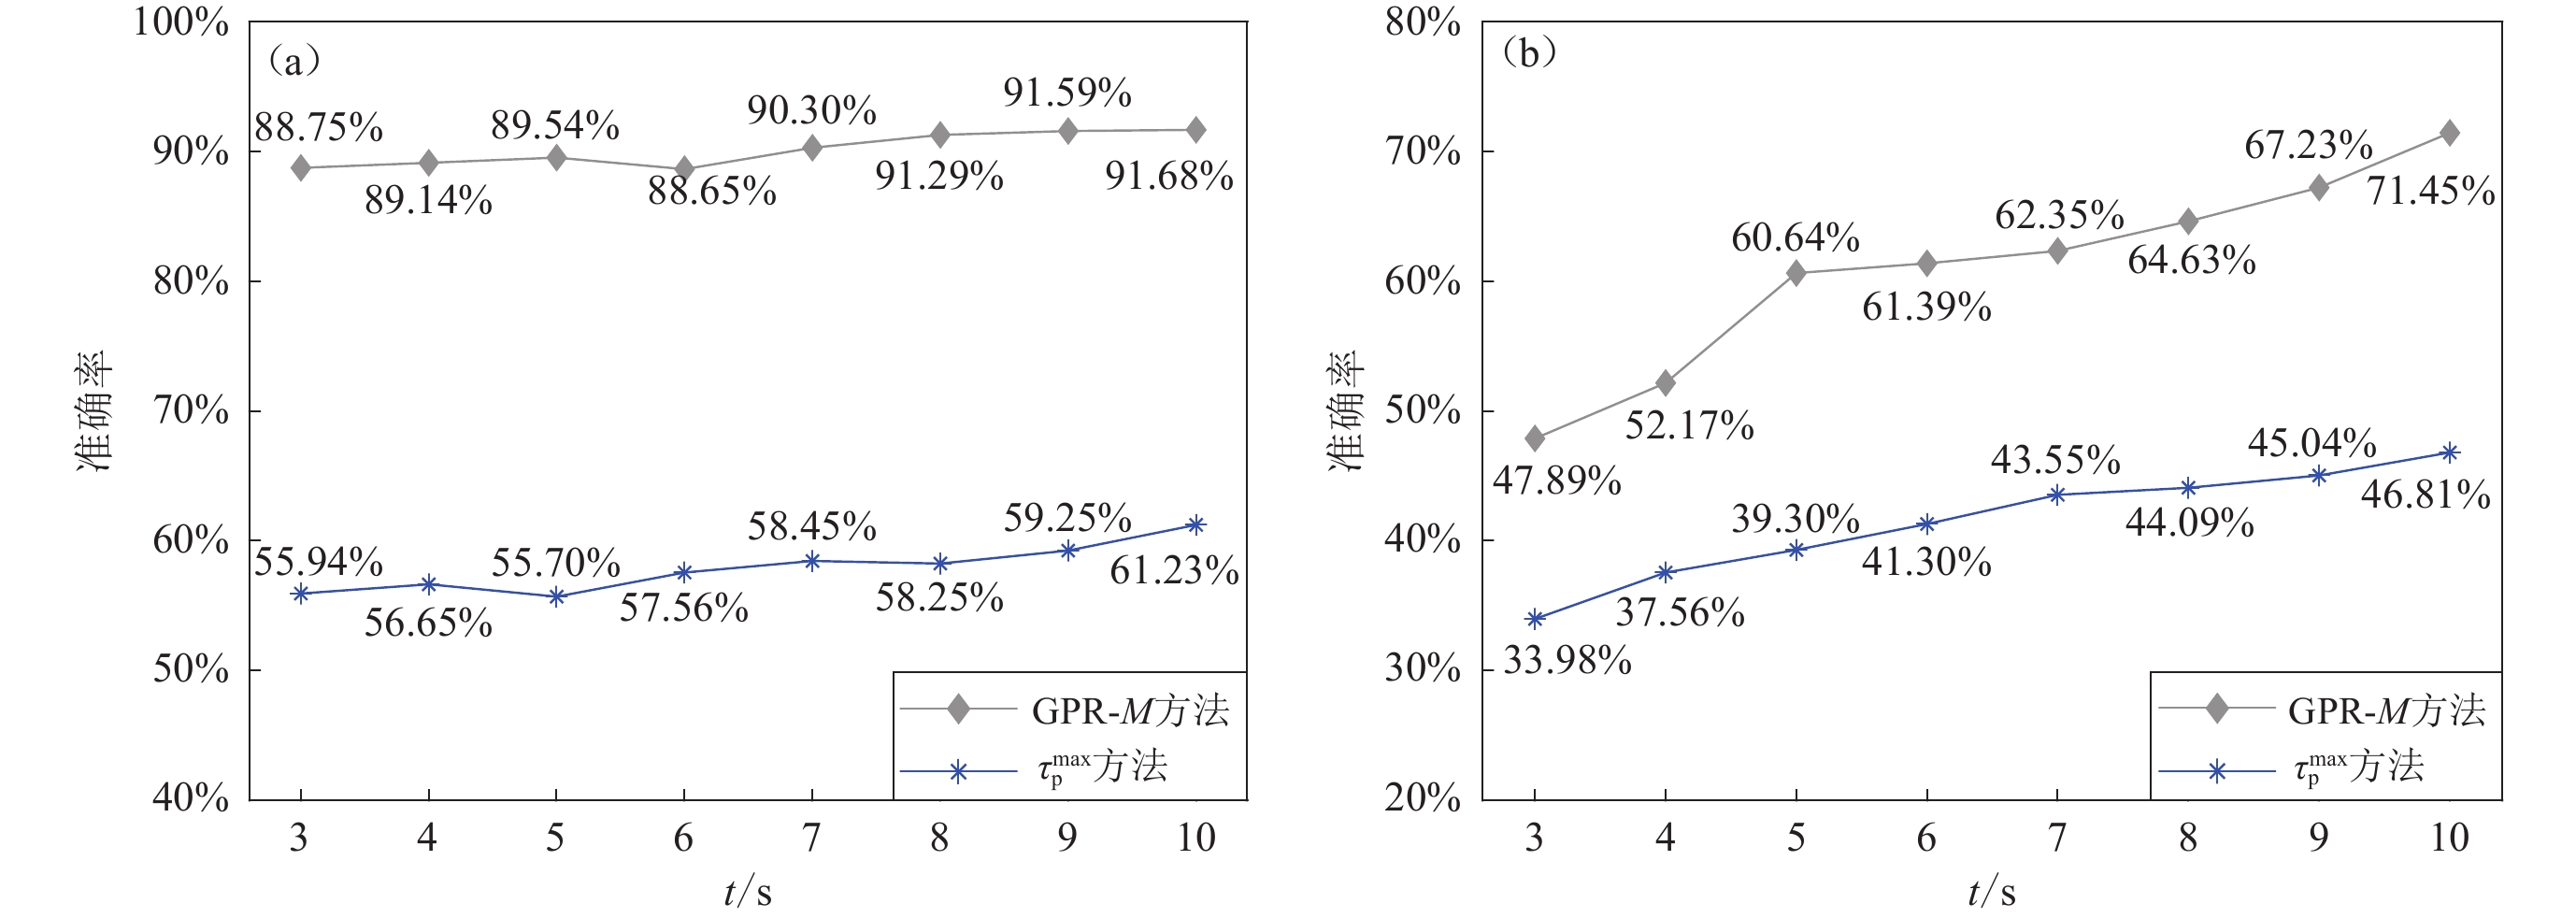
图 6 初至3—10 s地震波的GPR-M方法和$ {\tau ^{\max }_{\mathrm{p}}}$方法估算不同范围震级的准确率随时间变化趋势的对比
Figure 6. Comparison of the trends in estimation accuracy of different magnitude ranges based on the GPR-M and $ {\tau ^{\max }_{\mathrm{p}}}$ methods using initial 3−10 s seismic waves
(a) 4.0≤MW≤6.4;(b) 6.5≤MW≤9.0
![]()
图 7 初至3—10 s地震波的GPR-M-R方法和P d方法估算不同范围震级的准确率随时间变化趋势的对比
Figure 7. Comparison of the trend of magnitude estimation accuracy change over time by the GPR-M-R and P d methods using initial 3−10 s seismic waves
(a) 4.0≤MW≤6.4;(b) 6.5≤MW≤9.0
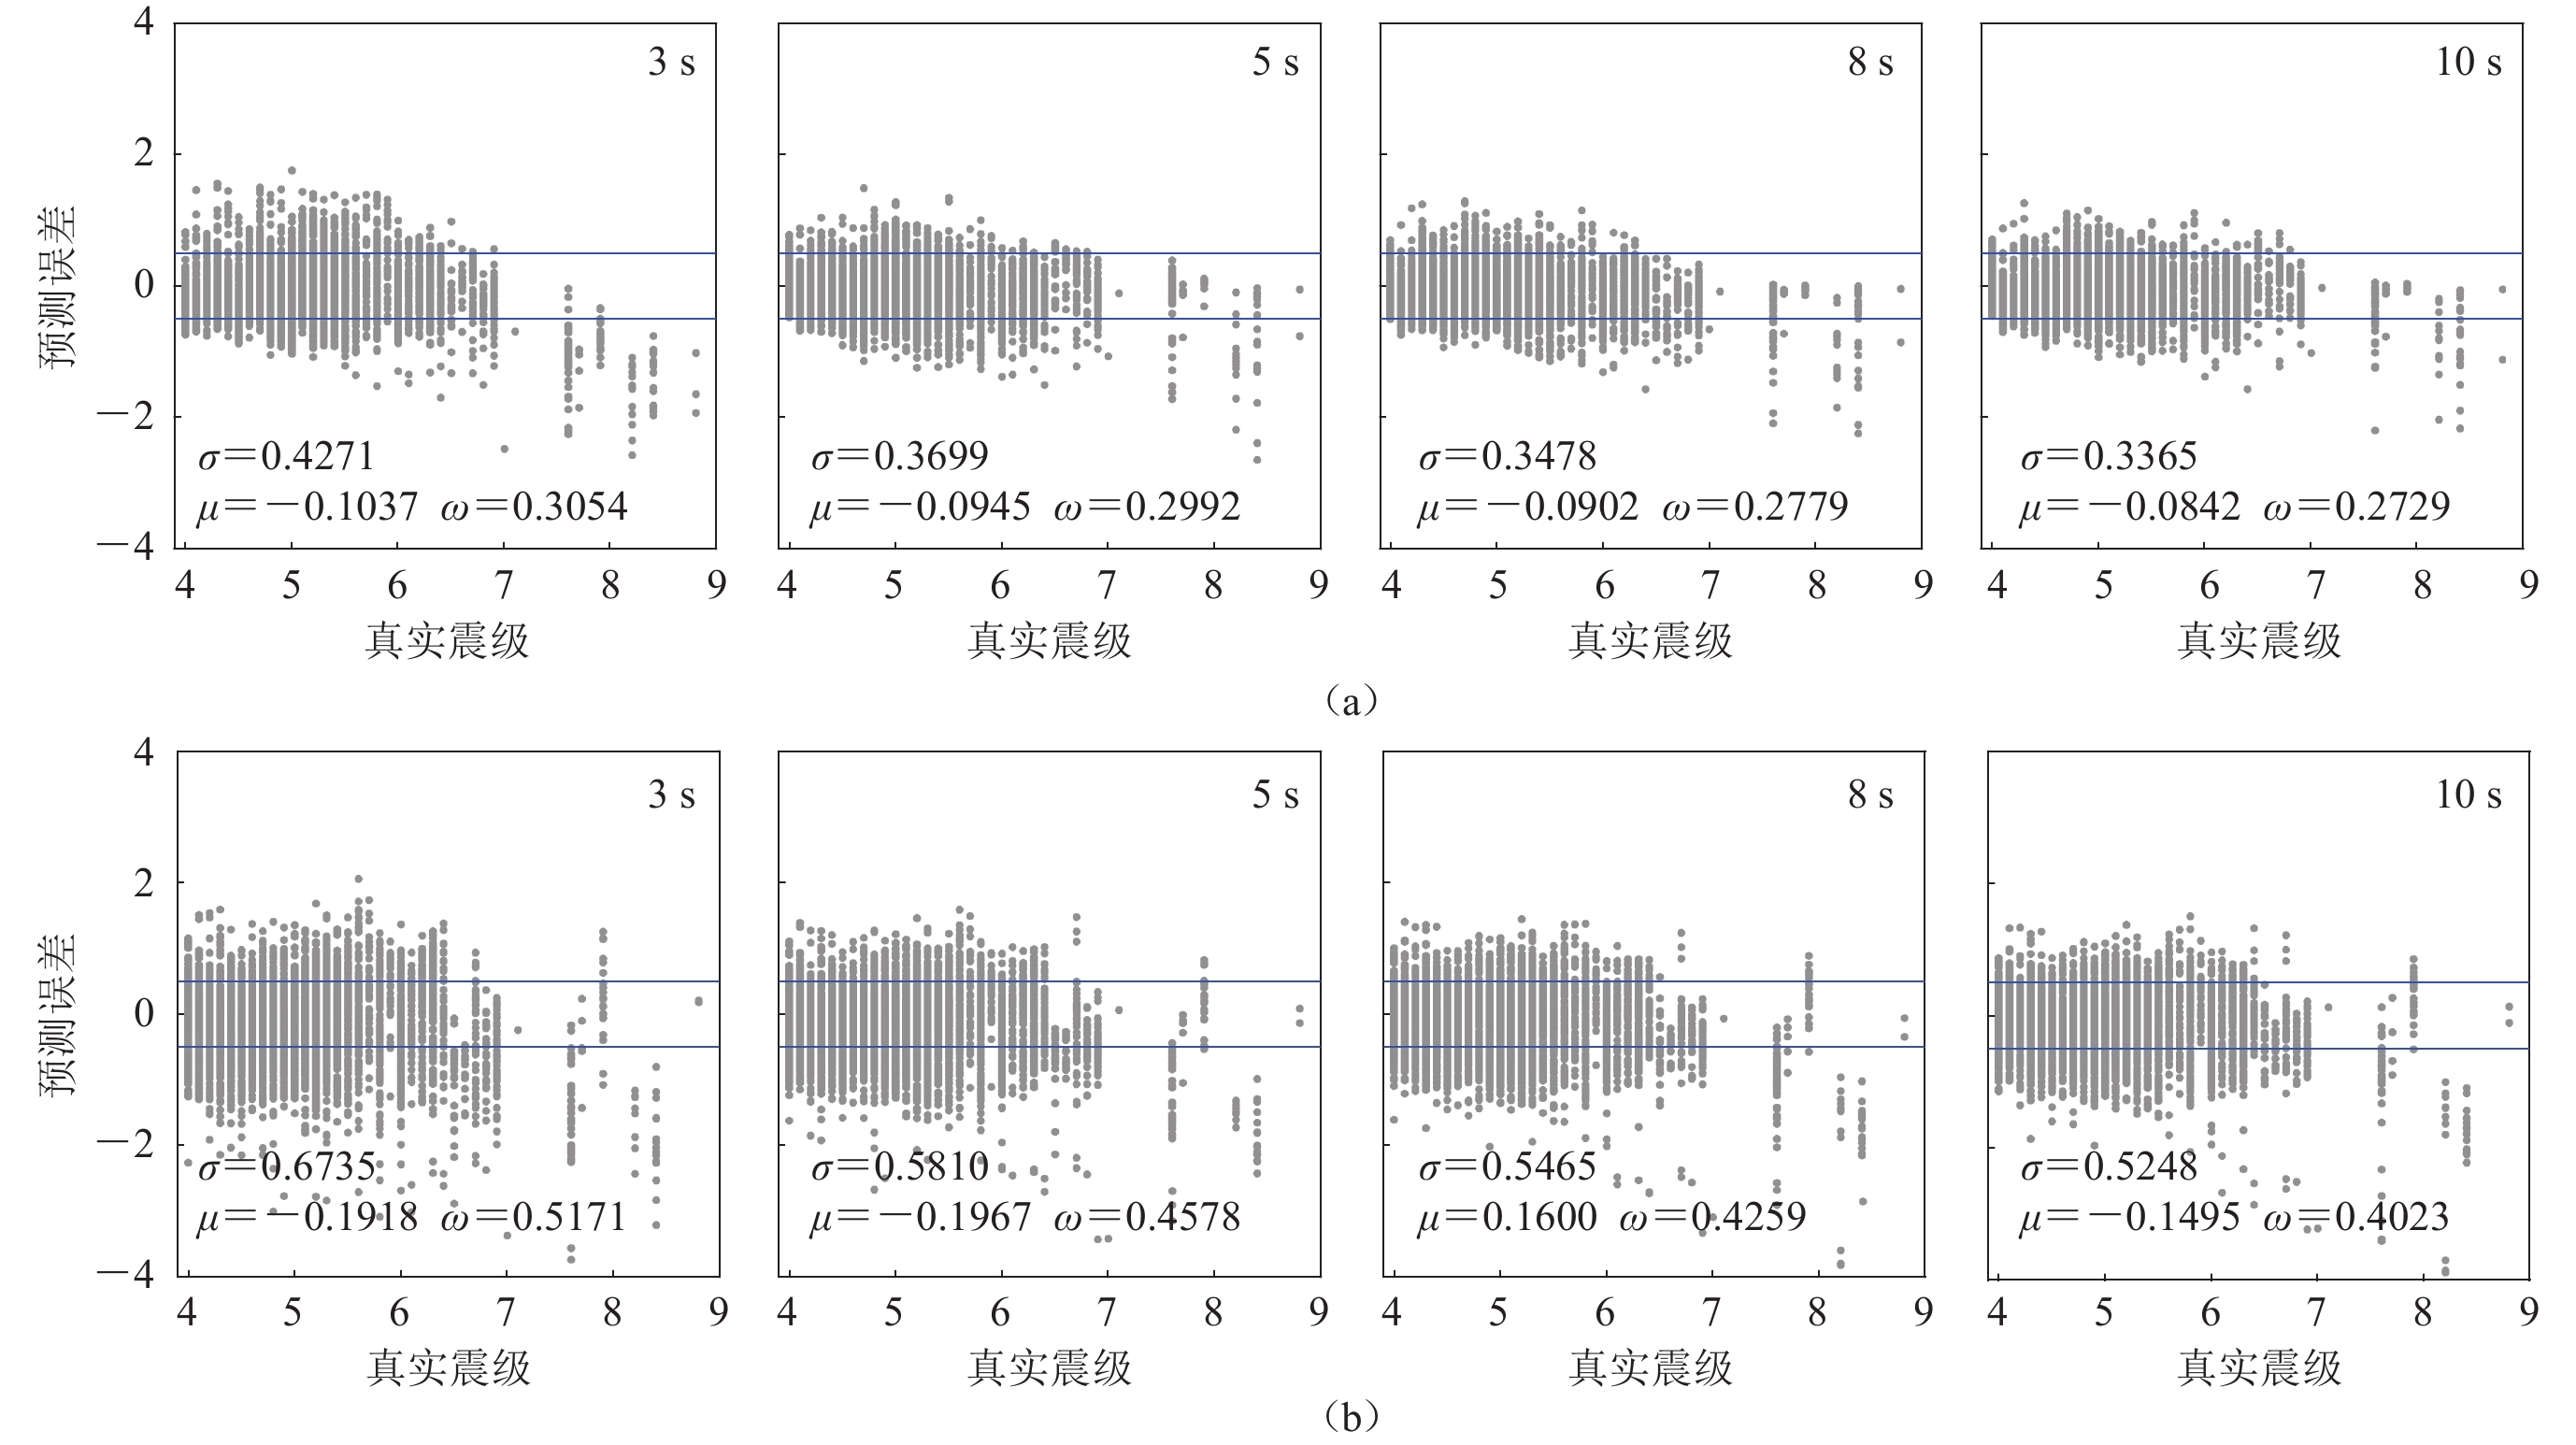
![]()
图 8 P波到达后3 s,5 s,8 s,10 s GPR-M (a)和$ {\tau ^{\max }_{\mathrm{p}}}$ (b)方法估算泛化数据集震级的误差分布
Figure 8. Distributions of estimated magnitude errors in the generalized dataset using the GPR-M (a) and $ {\tau ^{\max }_{\mathrm{p}}}$ (b) at the P-wave first arrival times of 3 s,5 s,8 s,and 10 s
![]()
图 9 P波到达后3 s,5 s,8 s,10 s GPR-M-R (a)和P d (b)估算泛化数据集震级的误差分布
Figure 9. Distributions of estimating magnitude errors in the generalized dataset using the GPR-M (a) and P d (b) at the P-wave arrival times of 3 s,5 s,8 s,and 10 s
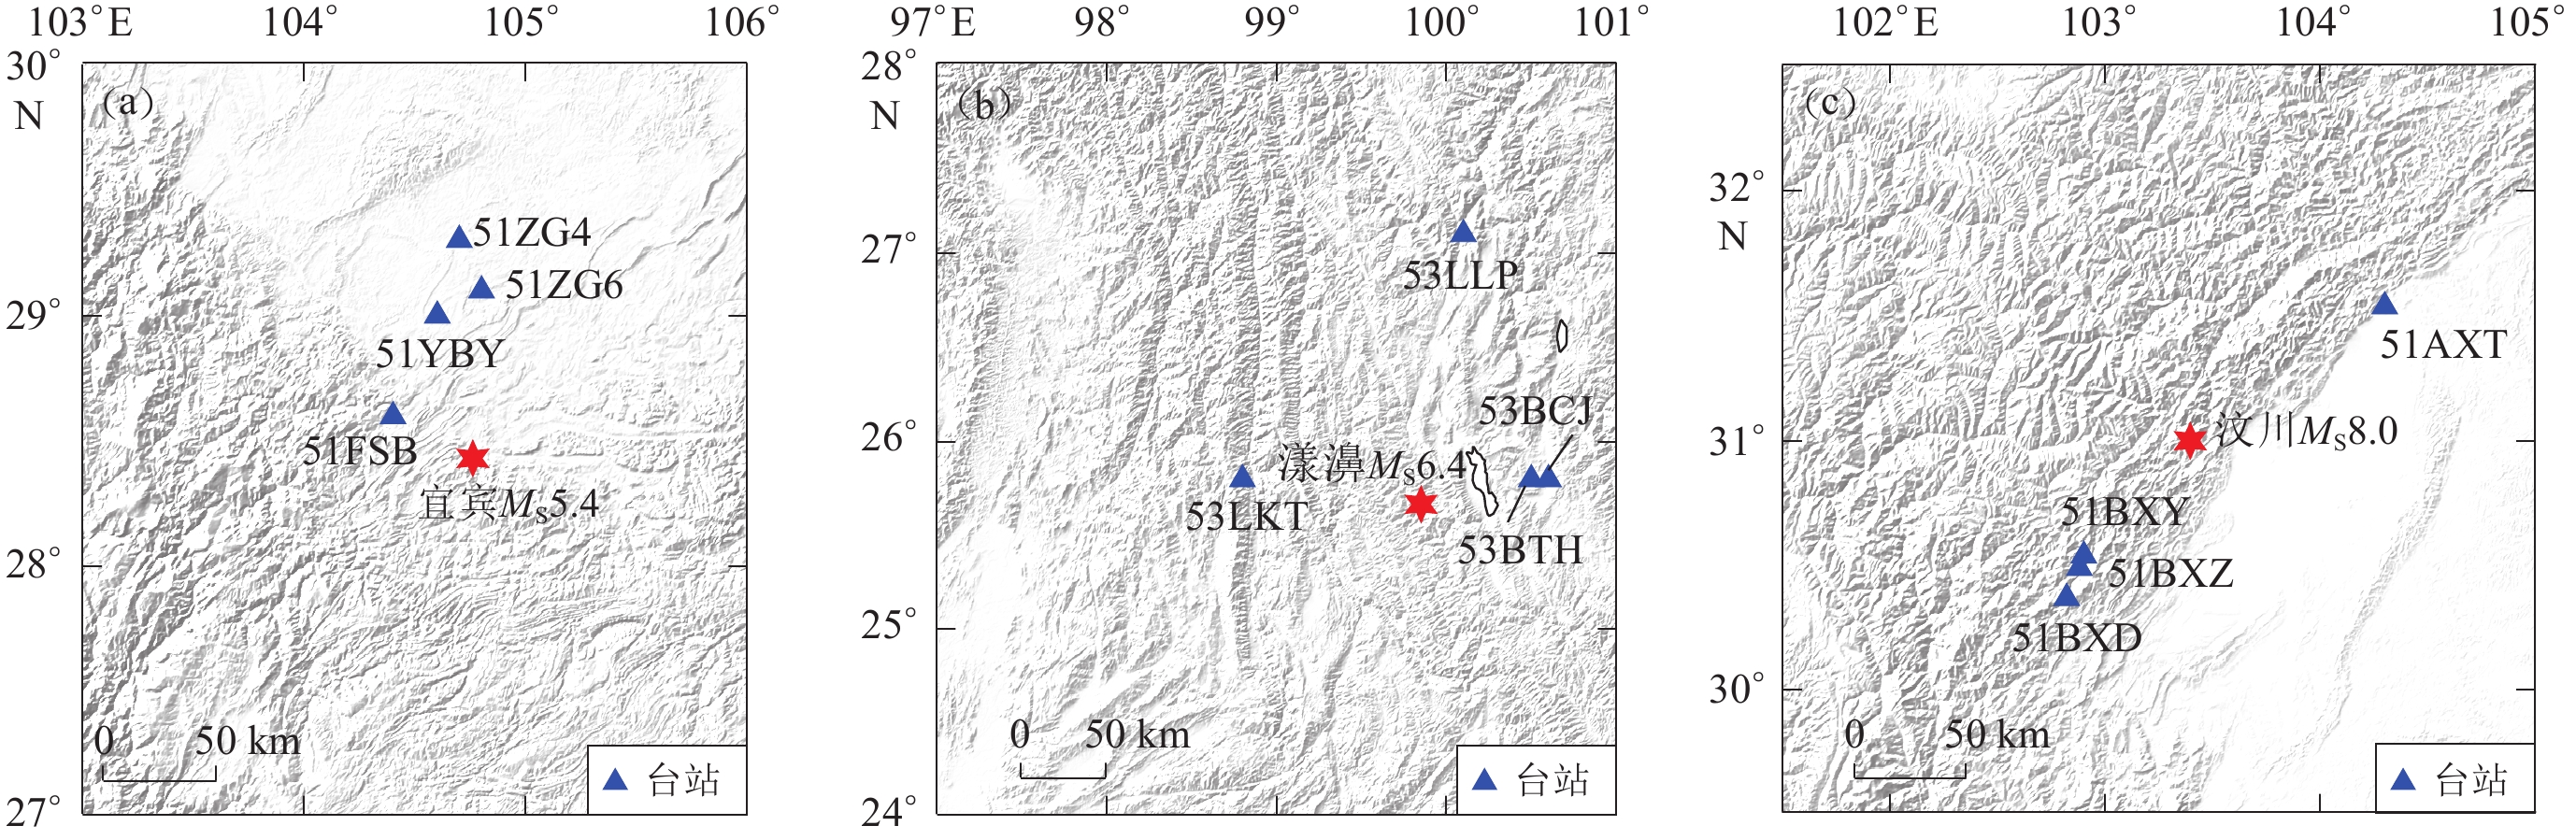
![]()
图 10 用于检验GPR震级估算效果所选取的我国三次地震的震中及所用台站分布
Figure 10. Distribution of epicenters and the stations used for testing the effectiveness of GPR magnitude estimation for three earthquakes in China
![]()
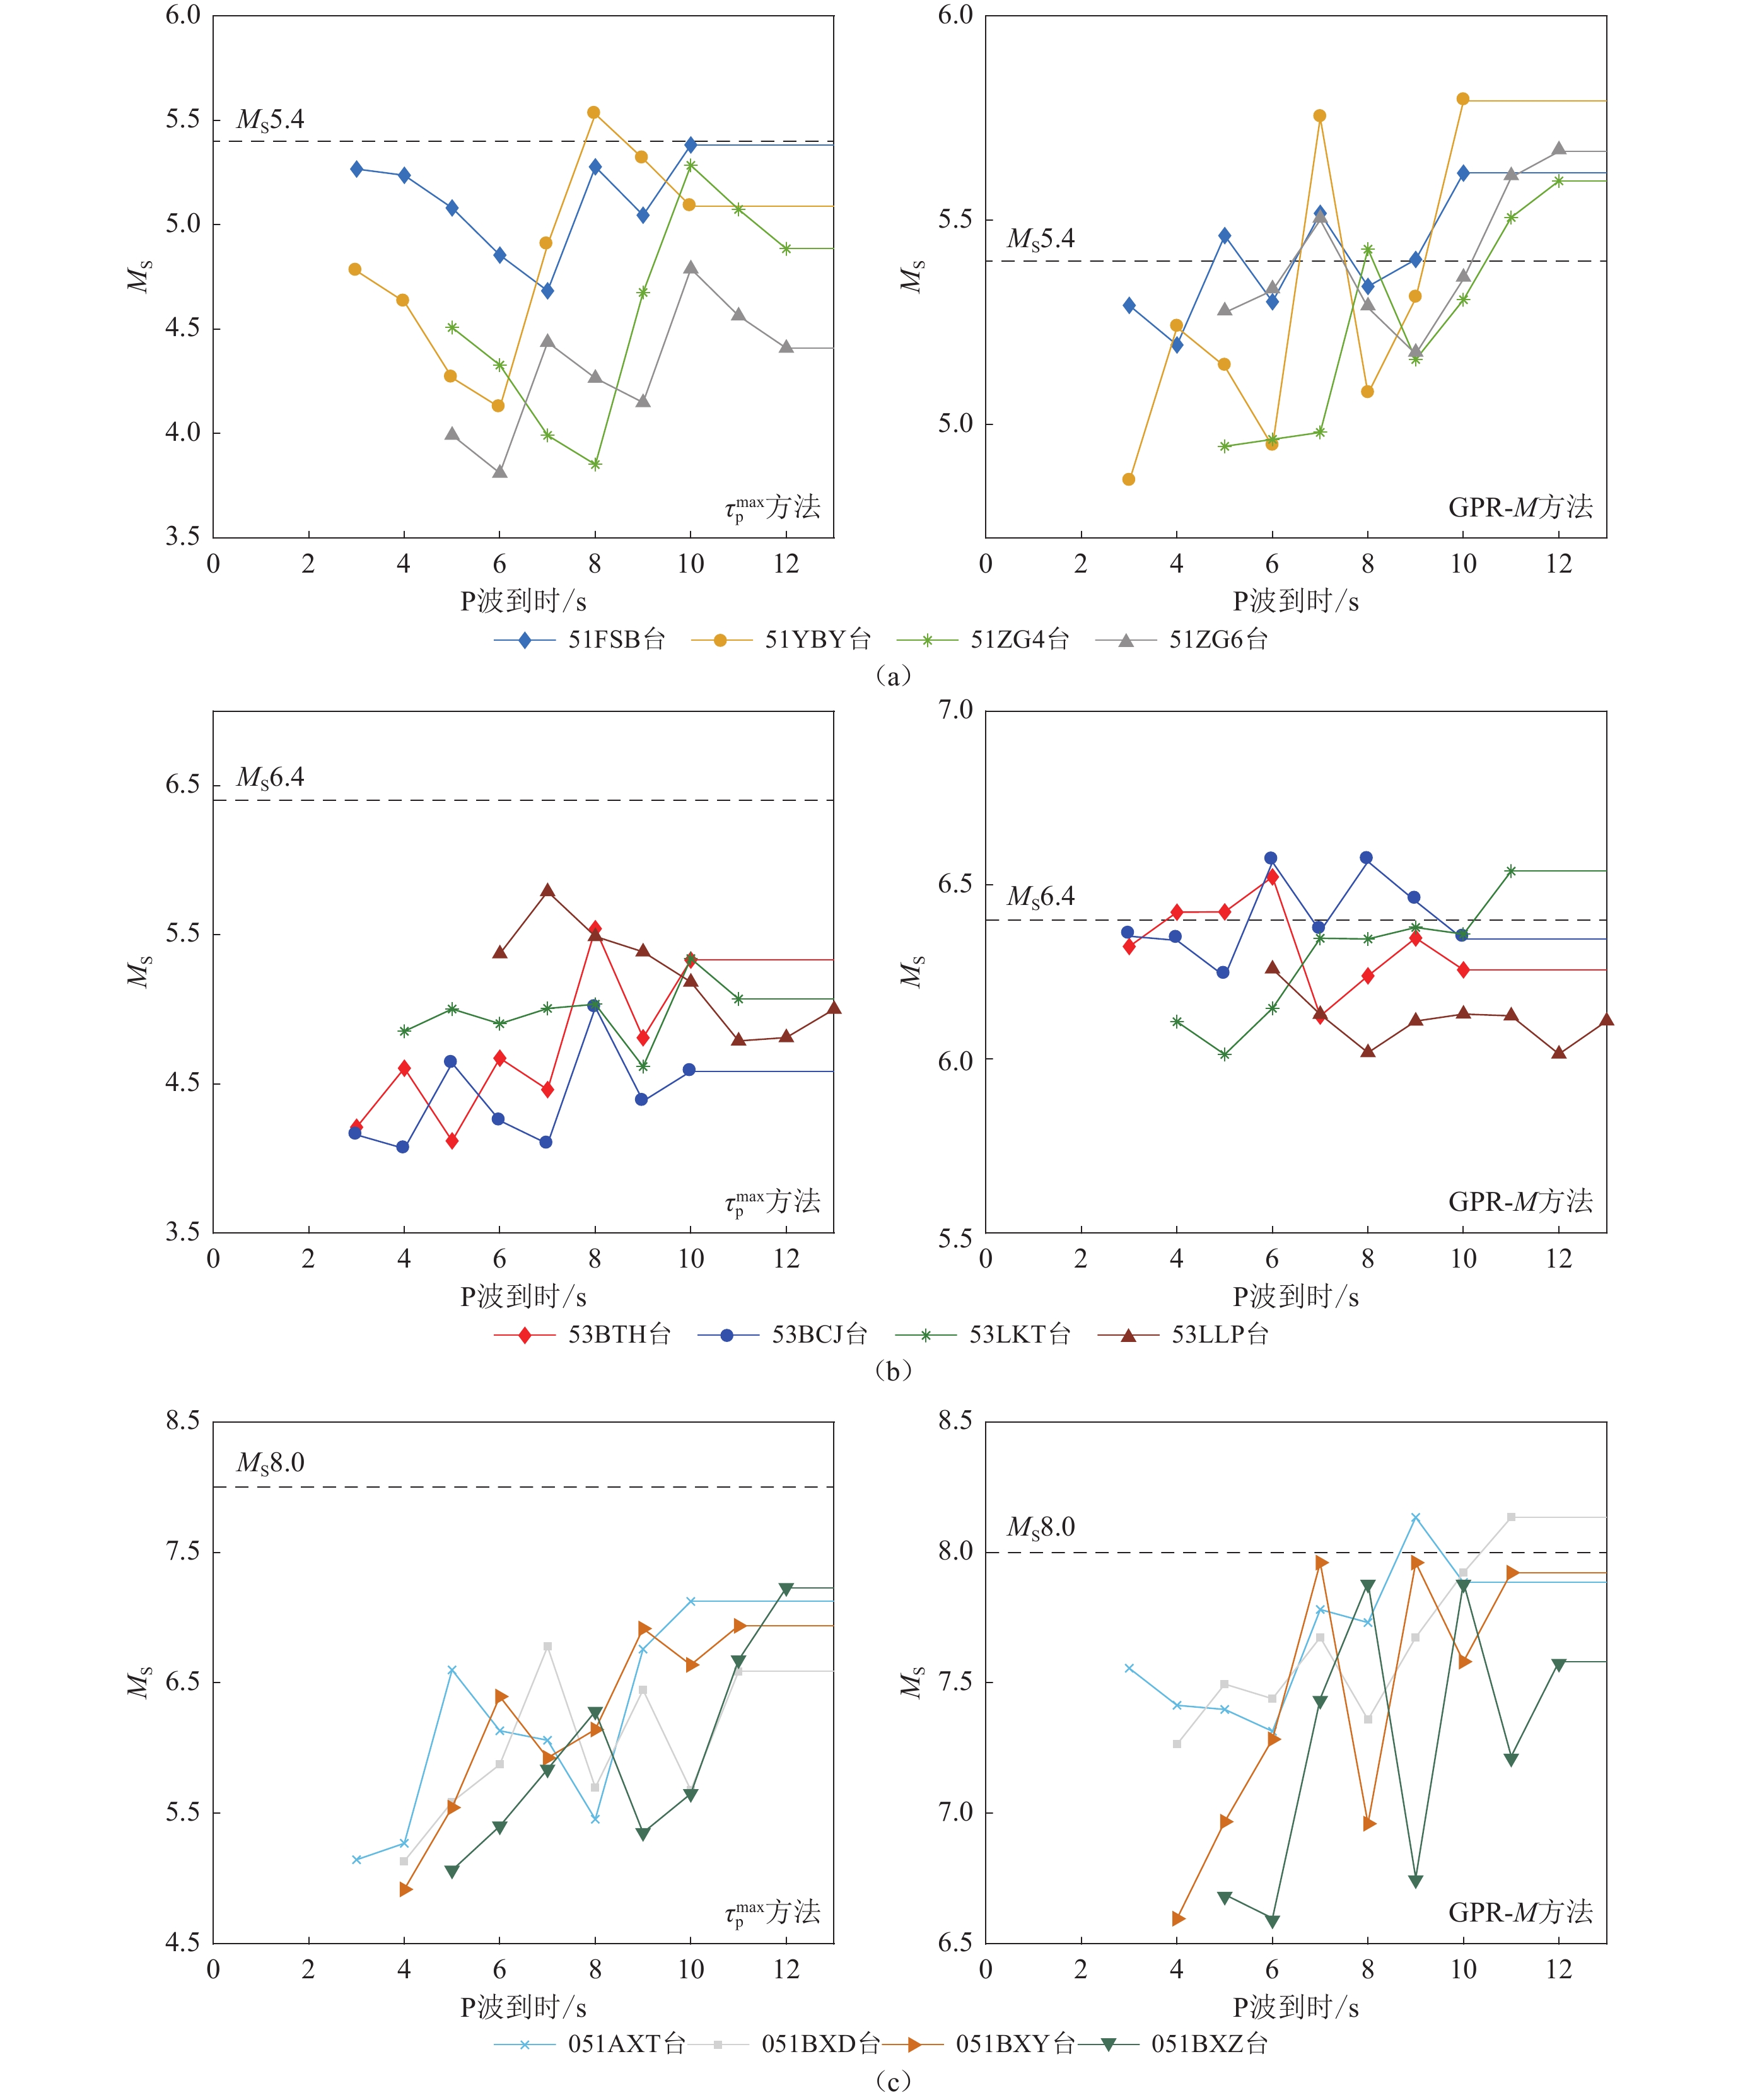
图 11 使用GPR-M方法(左)和$ {\tau ^{\max }_{\mathrm{p}}}$方法(右)持续估算我国2019年宜宾MS5.4 (a)、2021年漾濞MS6.4 (b)和2008年汶川MS8.0 (c)地震震级的结果
Figure 11. Results of continuous magnitude estimation for the 2019 Yibin MS5.4 (a),2021 Yangbi MS6.4 (b),and 2008 Wenchuan MS8.0 (c) earthquakes using the GPR-M-R (left panels) and $ {\tau ^{\max }_{\mathrm{p}}}$ (right panels) methods
![]()
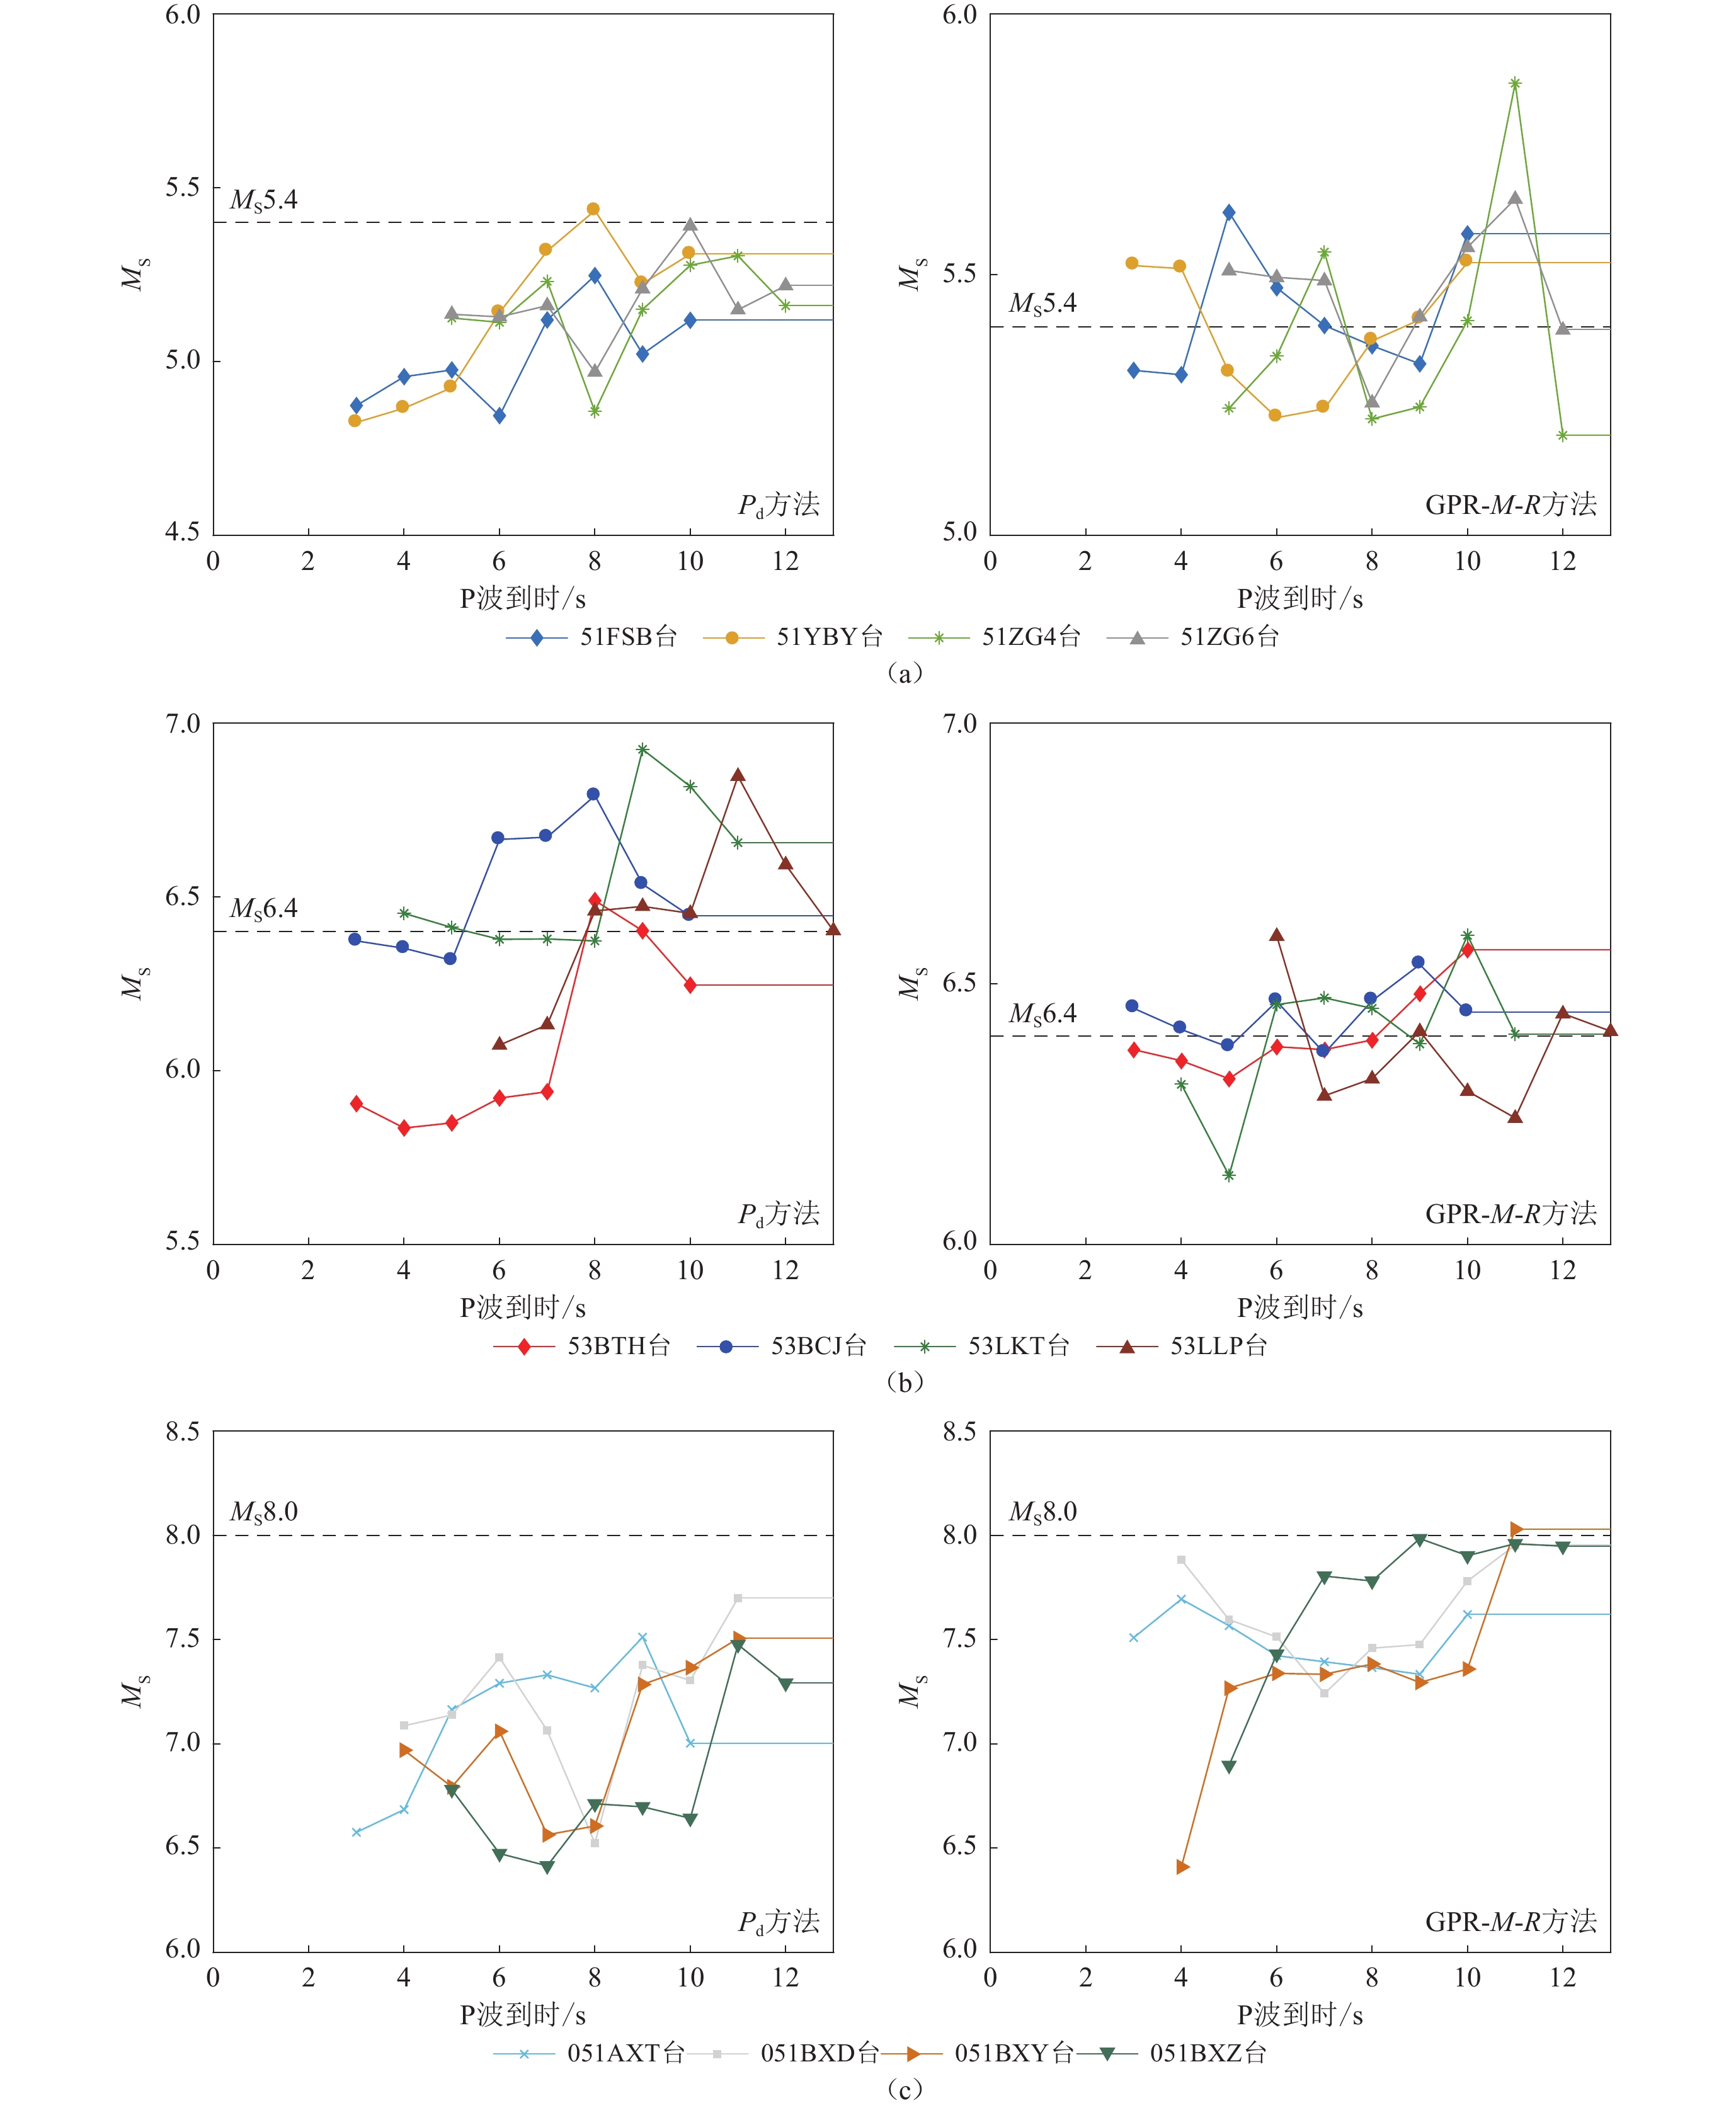
图 12 使用GPR-M-R (左)和P d (右)方法持续估算我国2019年宜宾MS5.4 (a)、2021年漾濞MS6.4 (b)和2008年汶川MS8.0 (c)地震震级的结果
Figure 12. Results of continuous magnitude estimation for the 2019 Yibin MS5.4 (a),2021 Yangbi MS6.4 (b),and 2008 Wenchuan MS8.0 (c) earthquakes using the GPR-M-R (left panels) and P d (right panels) methods
表 1 初至3—10 s地震波的Pd和$ {\tau ^{\max }_{\mathrm{p}}} $方法的拟合系数表
Table 1 Fitting coefficients for the Pd and $ {\tau ^{\max }_{\mathrm{p}}} $ methods based on the first 3−10 s seismic waves
初至地震波
窗长/s$P_{{\mathrm{d}}} $方法 $ {\tau ^{\max }_{\mathrm{p}}}$方法 a b c a b 3 0.639 4 −3.987 2 −0.840 7 0.309 6 −2.049 4 4 0.681 4 −3.910 9 −0.966 4 0.320 6 −2.048 3 5 0.708 0 −3.740 4 −1.104 4 0.329 8 −2.041 8 6 0.723 6 −3.518 2 −1.248 1 0.339 8 −2.016 5 7 0.738 2 −3.292 8 −1.378 0 0.348 6 −1.975 3 8 0.740 9 −3.070 7 −1.478 3 0.352 6 −1.955 5 9 0.737 8 −2.897 5 −1.538 8 0.358 3 −1.911 7 10 0.733 4 −2.791 4 −1.561 7 0.364 7 −1.875 0  下载: 导出CSV
-
郭凯,温瑞智,杨大克,彭克银. 2016. 地震预警系统的效能评估和社会效益分析[J]. 地震学报,38(1):146–154. doi: 10.11939/jass.2016.01.015 Guo K,Wen R Z,Yang D K,Peng K Y. 2016. Effectiveness evaluation and social benefits analyses on earthquake early warning system[J]. Acta Seismologica Sinica,38(1):146–154 (in Chinese).
何志昆,刘光斌,赵曦晶,王明昊. 2013. 高斯过程回归方法综述[J]. 控制与决策,28(8):1121–1129. He Z K,Liu G B,Zhao X J,Wang M H. 2013. Overview of Gaussian process regression[J]. Control and Decision,28(8):1121–1129 (in Chinese).
金星,张红才,李军,韦永祥,马强. 2012. 地震预警震级确定方法研究[J]. 地震学报,34(5):593–610. doi: 10.3969/j.issn.0253-3782.2012.05.002 Jin X,Zhang H C,Li J,Wei Y X,Ma Q. 2012. Research on earthquake early warning magnitude estimate[J]. Acta Seismologica Sinica,34(5):593–610 (in Chinese).
林彬华,金星,康兰池,韦永祥,李军,张燕明,陈惠芳,周施文. 2021. 基于卷积神经网络的地震震级测定研究[J]. 地球物理学报,64(10):3600–3611. doi: 10.6038/cjg2021O0370 Lin B H,Jin X,Kang L C,Wei Y X,Li J,Zhang Y M,Chen H F,Zhou S W. 2021. The research of earthquake magnitude determination based on convolutional neural networks[J]. Chinese Journal of Geophysics,64(10):3600–3611 (in Chinese).
马美帅,王延伟,汪祚赚,赵庆旭,潘代洪. 2022. 基于累积绝对位移值的震级估算方法[J]. 自然灾害学报,31(2):93–101. Ma M S,Wang Y W,Wang Z Z,Zhao Q X,Pan D H. 2022. Magnitude estimation based on the cumulative absolute displacement[J]. Journal of Natural Disasters,31(2):93–101 (in Chinese).
孙斌,姚海涛,刘婷. 2012. 基于高斯过程回归的短期风速预测[J]. 中国电机工程学报,32(29):104–109. Sun B,Yao H T,Liu T. 2012. Short-term wind speed forecasting based on Gaussian process regression model[J]. Proceedings of the CSEE,32(29):104–109 (in Chinese).
王延伟,李小军,曹振中,兰景岩,刘娟. 2020. 基于KiK-net井下基岩强震动记录的持续地震预警震级估算方法[J]. 地震工程与工程振动,40(4):42–52. Wang Y W,Li X J,Cao Z Z,Lan J Y,Liu J. 2020. Continuous estimation magnitude for earthquake early warning based on KiK-net borehole bedrock strong motions[J]. Earthquake Engineering and Engineering Dynamics,40(4):42–52 (in Chinese).
位栋梁,王延伟,王自法,廖吉安,赵登科. 2022. 基于卷积神经网络的地震震级快速估算方法[J]. 地震学报,44(2):316–326. doi: 10.11939/jass.20210198 Wei D L,Wang Y W,Wang Z F,Liao J A,Zhao D K. 2022. A fast estimation method of earthquake magnitude based on convolutional neural networks[J]. Acta Seismologica Sinica,44(2):316–326 (in Chinese).
杨黎薇,林国良,邱志刚,江汶乡,王玉石. 2018. 基于人工神经元网络和多特征参数的预警震级估算[J]. 地震研究,41(2):302–310. doi: 10.3969/j.issn.1000-0666.2018.02.019 Yang L W,Lin G L,Qiu Z G,Jiang W X,Wang Y S. 2018. Study on magnitude estimation of earthquake early warning based on various characteristic parameters and artificial neural networks[J]. Journal of Seismological Research,41(2):302–310 (in Chinese).
朱景宝,宋晋东,李山有. 2021. 基于支持向量机的地震预警震级快速估算研究[J]. 振动与冲击,40(7):126–134. Zhu J B,Song J D,Li S Y. 2021. Rapid magnitude estimation for earthquake early warning based on SVM[J]. Journal of Vibration and Shock,40(7):126–134 (in Chinese).
Alcik H,Ozel O,Apaydin N,Erdik M. 2009. A study on warning algorithms for Istanbul earthquake early warning system[J]. Geophys Res Lett,36(5):L00B05.
Allen R M,Kanamori H. 2003. The potential for earthquake early warning in southern California[J]. Science,300(5620):786–789. doi: 10.1126/science.1080912
Böse M,Heaton T,Hauksson E. 2012. Rapid estimation of earthquake source and ground-motion parameters for earthquake early warning using data from a single three-component broadband or strong-motion sensor[J]. Bull Seismol Soc Am,102(2):738–750. doi: 10.1785/0120110152
Cheng M H,Wu S,Heaton T H,Beck J L. 2014. Earthquake early warning application to buildings[J]. Eng Struct,60:155–164. doi: 10.1016/j.engstruct.2013.12.033
Chung A I,Henson I,Allen R M. 2019. Optimizing earthquake early warning performance:ElarmS-3[J]. Seismol Res Lett,90(2A):727–743. doi: 10.1785/0220180192
Cua G,Fischer M,Heaton T,Wiemer S. 2009. Real-time performance of the virtual seismologist earthquake early warning algorithm in southern California[J]. Seismol Res Lett,80(5):740–747. doi: 10.1785/gssrl.80.5.740
Cuéllar A,Suárez G,Espinosa-Aranda J M. 2018. A fast earthquake early warning algorithm based on the first 3 s of the P-wave coda[J]. Bull Seismol Soc Am,108(4):2068–2079. doi: 10.1785/0120180079
Festa G,Zollo A,Lancieri M. 2008. Earthquake magnitude estimation from early radiated energy[J]. Geophys Res Lett,35(22):L22307.
Hsiao N C,Wu Y M,Shin T C,Zhao L,Teng T L. 2009. Development of earthquake early warning system in Taiwan[J]. Geophys Res Lett,36(5):L00B02.
Hsiao N C,Wu Y M,Zhao L,Chen D Y,Huang W T,Kuo K H,Shin T C,Leu P L. 2011. A new prototype system for earthquake early warning in Taiwan[J]. Soil Dyn Earthq Eng,31(2):201–208. doi: 10.1016/j.soildyn.2010.01.008
Hsu T Y,Huang S K,Chang Y W,Kuo C H,Lin C M,Chang T M,Wen K L,Loh C H. 2013. Rapid on-site peak ground acceleration estimation based on support vector regression and P-wave features in Taiwan[J]. Soil Dyn Earthq Eng,49:210–217. doi: 10.1016/j.soildyn.2013.03.001
Hua T,Li Q Y,Dai K R,Zhang X J,Zhang H. 2023. Image denoisingvia neighborhood-based multidimensional Gaussian process regression[J]. Signal Image Video P, 17 (2):389-397.
Ide S. 2019. Frequent observations of identical onsets of large and small earthquakes[J]. Nature,573(7772):112–116. doi: 10.1038/s41586-019-1508-5
Kamigaichi O,Saito M,Doi K,Matsumori T,Tsukada S,Takeda K,Shimoyama T,Nakamura K,Kiyomoto M,Watanabe Y. 2009. Earthquake early warning in Japan:Warning the general public and future prospects[J]. Seismol Res Lett,80(5):717–726. doi: 10.1785/gssrl.80.5.717
Kanamori H. 2005. Real-time seismology and earthquake damage mitigation[J]. Annu Rev Earth Planet Sci,33(1):195–214. doi: 10.1146/annurev.earth.33.092203.122626
Kohler M D,Smith D E,Andrews J,Chung A I,Hartog R,Henson I,Given D D,De Groot R,Guiwits S. 2020. Earthquake early warning ShakeAlert 2.0:Public rollout[J]. Seismol Res Lett,91(3):1763–1775. doi: 10.1785/0220190245
Leyton F,Ruiz S,Baez J C,Meneses G,Madariaga R. 2018. How fast can we reliably estimate the magnitude of subduction earthquakes?[J]. Geophys Res Lett,45(18):9633–9641. doi: 10.1029/2018GL078991
Li Z F,Meier M A,Hauksson E,Zhan Z W,Andrews J. 2018. Machine learning seismic wave discrimination:Application to earthquake early warning[J]. Geophys Res Lett,45(10):4773–4779. doi: 10.1029/2018GL077870
Mousavi S M,Beroza G C. 2020. A machine-learning approach for earthquake magnitude estimation[J]. Geophys Res Lett,47(1):e2019GL085976. doi: 10.1029/2019GL085976
Nakamura Y. 1988. On the urgent earthquake detection and alarm system (UrEDAS)[C]//Proceedings of 9th World Conference on Earthquake Engineering. Tokyo:International Association for Earthquake Engineering:673−678.
Nazeri S,Shomali Z H,Colombelli S,Elia L,Zollo A. 2017. Magnitude estimation based on integrated amplitude and frequency content of the initial P wave in earthquake early warning applied to Tehran,Iran[J]. Bull Seismol Soc Am,107(3):1432–1438. doi: 10.1785/0120160380
Nguyen-Tuong D,Peters J,Seeger M. 2008. Local Gaussian process regression for real time online model learning and control[C]//Proceedings of the 21st International Conference on Neural Information Processing Systems. Vancouver,Canada:Curran Associates Inc:1193−1200.
Olson E L,Allen R M. 2005. The deterministic nature of earthquake rupture[J]. Nature,438(7065):212–215. doi: 10.1038/nature04214
Park C,Huang J Z,Ding Y. 2011. Domain decomposition approach for fast Gaussian process regression of large spatial data sets[J]. J Mach Learn Res,12:1697–1728.
Peng C Y,Yang J S,Zheng Y,Zhu X Y,Xu Z Q,Chen Y. 2017. New τc regression relationship derived from all P wave time windows for rapid magnitude estimation[J]. Geophys Res Lett,44(4):1724–1731. doi: 10.1002/2016GL071672
Perol T,Gharbi M,Denolle M. 2018. Convolutional neural network for earthquake detection and location[J]. Sci Adv,4(2):e1700578. doi: 10.1126/sciadv.1700578
Rasmussen C E,Williams C K I. 2006. Gaussian Processes for Machine Learning[M]. Cambridge:MIT Press:7−32.
Rohani A,Taki M,Abdollahpour M. 2018. A novel soft computing model (Gaussian process regression with K-fold cross validation) for daily and monthly solar radiation forecasting (Part:I)[J]. Renew Energy,115:411–422. doi: 10.1016/j.renene.2017.08.061
Seeger M. 2004. Gaussian processes for machine learning[J]. Int J Neural Syst,14(2):69–106. doi: 10.1142/S0129065704001899
Shieh J T,Wu Y M,Allen R M. 2008. A comparison of τc and τpmax for magnitude estimation in earthquake early warning[J]. Geophys Res Lett,35(20):L20301.
Wang Y W,Li X J,Wang Z F,Shi J P,Bao E H. 2021. Deep learning for P-wave arrival picking in earthquake early warning[J]. Earthq Eng Eng Vib,20(2):391–402. doi: 10.1007/s11803-021-2027-6
Wang Y W,Li X J,Li L,Wang Z F,Lan J Y. 2022. New magnitude proxy for earthquake early warning based on initial time series and frequency[J]. Seismol Res Lett,93(1):216–225. doi: 10.1785/0220210106
Wang Y W,Li X J,Wang Z F,Liu J. 2023. Deep learning for magnitude prediction in earthquake early warning[J]. Gondwana Res,123:164–173. doi: 10.1016/j.gr.2022.06.009
Wu Y M. 2002. A virtual subnetwork approach to earthquake early warning[J]. Bull Seismol Soc Am,92(5):2008–2018. doi: 10.1785/0120010217
Wu Y M,Kanamori H. 2005. Rapid assessment of damage potential of earthquakes in Taiwan from the beginning of P waves[J]. Bull Seismol Soc Am,95(3):1181–1185. doi: 10.1785/0120040193
Wu Y M,Zhao L. 2006. Magnitude estimation using the first three seconds P-wave amplitude in earthquake early warning[J]. Geophys Res Lett,33(16):L16312.
Zhang H C,Jin X,Wei Y X,Li J,Kang L C,Wang S C,Huang L Z,Yu P Q. 2016. An earthquake early warning system in Fujian,China[J]. Bull Seismol Soc Am,106(2):755–765. doi: 10.1785/0120150143
Ziv A. 2014. New frequency-based real-time magnitude proxy for earthquake early warning[J]. Geophys Res Lett,41(20):7035–7040. doi: 10.1002/2014GL061564
Zollo A,Lancieri M,Nielsen S. 2006. Earthquake magnitude estimation from peak amplitudes of very early seismic signals on strong motion records[J]. Geophys Res Lett,33(23):L23312.
Zollo A,Iannaccone G,Lancieri M,Cantore L,Convertito V,Emolo A,Festa G,lovič F,Vassallo M,Martino C,Satriano C,Gasparini P. 2009. Earthquake early warning system in southern Italy:Methodologies and performance evaluation[J]. Geophys Res Lett,36(5):L00B07.


计量
- 文章访问数: 193
- HTML全文浏览量: 34
- PDF下载量: 66
