

Seismogenic structure of the earthquake surface rupture zone along the Maisu fault
-
摘要:
野外地质调查发现金沙江断裂带北段麦宿断裂附近发育长约50 km的地震地表破裂带,其最大垂直位移为2 m。基于该地震地表破裂带周围架设的密集地震台阵于2020 年 12 月至 2022 年 7 月期间记录到的连续波形数据,采用双差定位方法对(31.55°N—31.85°N,98.31°E—98.98°E) 区域内的578个地震事件进行定位,并利用基于P波初动的HASH方法对定位得到的地震事件进行震源机制解反演,获得了37组震源机制解,最后使用基于震源机制解的阻尼区域应力场反演方法对研究区域的应力环境进行了分析。精定位结果显示:研究区内沿地震地表破裂带分布着一条长约40 km的WNW−ESE向地震密集条带,震源密集分布在3—10 km深度范围内,深度剖面向北陡倾;同时还存在一条长约30 km的NNW−SSE向地震密集条带,震源密集分布在3—11 km深度范围内,深度剖面向西陡倾。震源机制解结果显示,研究区内地震的震源机制解以走滑型为主,占所获震源机制解的51.4%,同时也存在少量逆断型和正断型。震源机制解P轴的优势方位为近 NW−SE 向,与最大主压应力 σ1 方向 323°相近。P 轴、T 轴、最大主压应力σ1 以及最小主压应力σ3 的倾角总体上较小,表明研究区内应力处于近 NW−SE 向的水平挤压状态;应力结构为走滑型,与地震定位和震源机制解结果相同;应力形因子R=0.57,表明最大主压应力σ1、中间主压应力 σ2和最小主压应力σ3的本征值基本呈等差数列排列,其中σ1和σ3均为确定值。WNW−ESE向的地震密集条带具右旋走滑兼有正断和逆断分量,NNW−SSE向的地震密集条带具左旋走滑特征,表现为共轭断层特征。综合认为研究区曾发生过一次M>7.0 地震,近NW−SE向水平挤压的应力状态与北部NW−SE向甘孜—玉树—鲜水河断裂带强烈左旋走滑有关。
Abstract:Field geological survey revealed the presence of an earthquake surface rupture zone 50 km long near the Maisu fault in the northern segment of the Jinshajiang fault zone, with a maximum vertical offset of 2 m. Based on the continuous waveform data of a dense seismic array set up around the rupture zone from December 2020 to July 2022, 578 seismic events in the area of 31.55°N−31.85°N and 98.31°E−98.98°E were located by using the double-difference location method. The obtained seismic events were then analyzed using the HASH method based on P-wave initial motion to invert the focal mechanisms, and 37 focal mechanism solutions were acquired. The stress state of the study area was further analyzed by using the damped region-scale stress inversions method based on the focal mechanism solutions. The precise location results show that within the study area, there is a seismic belt 40 km long oriented WNW−ESE along the earthquake surface rupture zone, with focal depths clustered in the range of 3−10 km, and the depth profile steeply dips to the north. Moreover, there is another belt 30 km long oriented NNW−SSE, with focal depths concentrated at 3−11 km, dipping to the west. The results of focal mechanism solutions indicate that source mechanisms in this area are mostly strike-sip, accounting for 51.4% of the total. In addition, there are also a small number of reverse and normal fault mechanisms. The dominant azimuth of the P-axis of the focal mechanism solution is nearly NW−SE, which is similar to the direction of the maximum principal compressive stress σ1 at 323°. The overall dips of the P-axes, T-axes, maximum compressive stress σ1, and minimum compressive stress σ3 are small, suggesting that it is under an NW-SE oriented horizontal compressive stress regime. The stress structure is strike-slip, consistent with the earthquake location and focal mechanism solution results. The stress factor (R=0.57) indicates that the maximum compressive stress σ1, the intermediate compressive stress σ2 and the minimum compressive stress σ3 are basically in arithmetic progression, where σ1 and σ3 are determined. The WNW−ESE seismic belt exhibits dextral strike-slip with both normal and reverse components, while the NNW−SSE belt shows sinistral strike-slip, displaying conjugate fault features. It is concluded that this area has experienced at least one earthquake with M>7.0. The near NW-SE horizontal compressive stress state is related to the intense sinistral movement of the NW−SE oriented Garze-Yushu-Xianshuihe fault zone.
-
引言
巴布亚新几内亚东南部处于澳大利亚板块和西南太平洋板块的斜向汇聚带内(图1),其南部有欧文—斯坦利(Owen-Stanley)断裂带,北连所罗门(Solomon)微板块,东接活跃的伍德拉克(Woodlark)海底扩张海盆,中部发育了快速扩张的伍德拉克裂谷(Wallace et al,2004),并在当特尔卡斯托群岛(D’Entrecasteaux islands)出露了世界上最年轻的超高压岩石(Baldwin et al,2004;Webb et al,2008;Little et al,2011;Gordon et al,2012;Eilon et al,2015)。澳大利亚板块在晚古新世至早始新世期间北向俯冲,形成了一个低角度的拆离断层(欧文—斯坦利断裂带),其上覆洋壳中产生了大量的岩浆活动并生成了巴布亚超镁铁质带,而其下覆大陆岩石圈经受着持续的变质作用(Davies,Smith,1971;Davies,Jaques,1984;Lus et al,2004)。中新世时期,巴布亚(Papua)半岛持续隆升,并伴随着快速的沉积,覆盖于上盘的洋壳之上(Davies,Smith,1971)。与此同时,北部的所罗门板块在早中新世向南俯冲并诱发特罗布里恩(Trobriand)断层的形成,其俯冲相关构造可能在巴布亚半岛的隆升和岩浆活动中起到作用(van Ufford,Cloos,2005;Fitz,Mann,2013)。晚中新世至早上新世,伍德拉克裂谷持续向西张裂发育,并伴有当特尔卡斯托群岛的隆升和花岗岩的侵入(Davies,Jaques,1984;Hill et al,1992)。伍德拉克裂谷的张裂伸展速率为10—15 mm/a,其动力可能来自于所罗门微板块北向俯冲的板片拖拽(Tregoning et al,1998;Wallace et al,2004;Biemiller et al,2020)。超高压岩石的出露可能与伍德拉克裂谷的张裂作用息息相关(Baldwin et al,1993;Monteleone et al,2007;Webb et al,2008;Little et al,2011;Abers et al,2016)。另外,下地壳浮力诱发的底侵(Martinez et al,2001)和古大陆俯冲残片的底辟作用(Ellis et al,2011)也可能是超高压岩石出露的机制之一。为了揭示伍德拉克裂谷张裂和超高压岩石出露的可能构造动力学机制,此地区前期已开展了多个地震学观测计划并积累了充足的地震波形数据来探究深部壳幔结构。
![]() 图 1 伍德拉克裂谷地区海底地震仪的分布紫色和黑色的圆圈分别表示含有效和无效数据的海底地震仪;红色三角为新生代火山;黑色虚线代表裂谷扩张轴,红色实线为欧文—斯坦利断裂带,绿色实线为地震测线(Fitz,Mann,2013)。右上插图代表了纵波(蓝色圆圈)和瑞雷波偏振分析(红色圆圈)所用的地震事件分布图,其中绿色三角形表示研究区域的中心位置。底部右侧插图中的黄色方框显示了研究区域的具体位置,其中红线为板块边界(Bird,2003)Figure 1. Topographic map of the Woodlark rift showing the locations of the ocean bottom seismographs (OBSs)The purple and black dots represent OBSs with and without valid data,respectively. Red triangles denote Cenozoic volcanos. The black dashed line indicates the rift axis. The red line represents the Owen-Stanley fault zone. The green lines are seismic profiles from previous study (Fitz,Mann,2013). The top-right inset presents the events used for the polarization analysis of Rayleigh wave (red circles) and P-wave (blue circles). The green triangle marks the center of the study area. The bottom right inset displays the location of thestudy area highlighted by the yellow rectangle. The red lines denote the plate boundaries (Bird,2003)
图 1 伍德拉克裂谷地区海底地震仪的分布紫色和黑色的圆圈分别表示含有效和无效数据的海底地震仪;红色三角为新生代火山;黑色虚线代表裂谷扩张轴,红色实线为欧文—斯坦利断裂带,绿色实线为地震测线(Fitz,Mann,2013)。右上插图代表了纵波(蓝色圆圈)和瑞雷波偏振分析(红色圆圈)所用的地震事件分布图,其中绿色三角形表示研究区域的中心位置。底部右侧插图中的黄色方框显示了研究区域的具体位置,其中红线为板块边界(Bird,2003)Figure 1. Topographic map of the Woodlark rift showing the locations of the ocean bottom seismographs (OBSs)The purple and black dots represent OBSs with and without valid data,respectively. Red triangles denote Cenozoic volcanos. The black dashed line indicates the rift axis. The red line represents the Owen-Stanley fault zone. The green lines are seismic profiles from previous study (Fitz,Mann,2013). The top-right inset presents the events used for the polarization analysis of Rayleigh wave (red circles) and P-wave (blue circles). The green triangle marks the center of the study area. The bottom right inset displays the location of thestudy area highlighted by the yellow rectangle. The red lines denote the plate boundaries (Bird,2003)2010年3月到2011年10月CDPAPUA实验计划(Eilon et al,2014)在伍德拉克裂谷及其周边地区均匀布设了宽频带地震台阵,难能可贵的是其中包含了分布于裂谷内的八台海底地震仪(OBS)(图1),为揭示裂谷内的地壳动力学机制提供了数据支撑。目前对于该裂谷地区的地壳结构认识仍然不足,部分原因可能是对已有OBS数据的挖掘程度不够。基于早期WOODSEIS实验计划采集到的数据,接收函数和远震层析反演结果表明当特尔卡斯托群岛处的地壳厚度与周围地区相比减薄约10—15 km,并被低密度的地幔补偿(Abers et al,2002)。近震层析成像研究显示在伍德拉克海盆海底扩张的前端存在镁铁质和长英质地壳组成的明显过渡区,并进而排除了岩浆活动在海底扩张开始前对地壳改造的可能性(Ferris et al,2006)。利用CDPAPUA地震观测数据开展的接收函数和面波联合反演结果显示:地壳最薄的区域不是在裂谷扩张轴地区,而是在当特尔卡斯托群岛(减薄30%—40%),并且超高压岩石的出露可能主要受控于裂谷的张裂作用,但遗憾的是并未对OBS处的地壳结构展开深入的讨论分析(Abers et al,2002)。因此,伍德拉克裂谷内的地壳结构及其动力学机制还是未被很好地约束,而可能的一种解决途径便是开展接收函数研究。远震接收函数方法已被成功运用于不同地区的海底地壳结构研究中,如邻近南海地区(丘学林等,2006;黄海波等,2011;胡昊等,2016;Hung et al,2021)。然而在开展接收函数相关研究前需要对OBS水平分量的方位进行校正,若不校正或校正不当会产生误差较大甚至错误的结果。
通常以自由落体的方式来投放OBS,其北向水平分量的方位往往与实际地理北向方位不一致(图2),这会导致一些基于三分量波形数据的地震学方法如接收函数方法应用困难。对中国地震科学台阵探测项目Ⅰ期(CHINArray- Ⅰ )观测数据的分析表明,当地震计水平分量方位的偏转角度超过20°时,接收函数的h-κ叠加结果会变得不稳定(Zeng et al,2021)。OBS水平分量方位通常是基于已知地震台站和地震事件的位置信息借助面波(Laske,1995;Selby,2001)或体波(Niu,Li,2011)偏振分析来确定。另外,通过环境噪声互相关提取出来的瑞雷波也可以用于确定OBS水平分量的方位(Zha et al,2013)。近期发展起来的波形模拟匹配技术也是确定OBS水平分量方位的可行方法之一(Zhu et al,2020)。
![]() 图 2 (a) OBS水平分量的方位偏转示意图,χ和θ分别为OBS方位偏转角度和相对于北向水平分量的地震后方位角;(b) 地震台站B的瑞雷波偏振分析结果,图中蓝色圆圈为对应单事件最优方位偏转角度,红色虚线为该地震台站最终方位偏转角度115.1°;(c) 地震台站B的纵波偏振分析结果,蓝色虚线表示最佳方位偏转角度108°Figure 2. (a) A schematic map of coordinate system exhibiting the relationship between the geographical North direction,the North component and the back-azimuth (BAZ) of an event. $ \chi $ and θ indicate the sensor orientation and the BAZ of the event relative to the North component,respectively;(b) Example of the Rayleigh-wave polarization analysis from the station B. The blue circles represent the optimal sensor orientations determined from each event based on the maximum correlation coefficient between the vertical and the Hilbert transformed radial components. The red dash line depicts the resulting station orientation 115.1°;(c) The P-wave polarization analysis for determining orientation of station B. The blue dashed line depicts the optimal sensor orientation,which is 108°
图 2 (a) OBS水平分量的方位偏转示意图,χ和θ分别为OBS方位偏转角度和相对于北向水平分量的地震后方位角;(b) 地震台站B的瑞雷波偏振分析结果,图中蓝色圆圈为对应单事件最优方位偏转角度,红色虚线为该地震台站最终方位偏转角度115.1°;(c) 地震台站B的纵波偏振分析结果,蓝色虚线表示最佳方位偏转角度108°Figure 2. (a) A schematic map of coordinate system exhibiting the relationship between the geographical North direction,the North component and the back-azimuth (BAZ) of an event. $ \chi $ and θ indicate the sensor orientation and the BAZ of the event relative to the North component,respectively;(b) Example of the Rayleigh-wave polarization analysis from the station B. The blue circles represent the optimal sensor orientations determined from each event based on the maximum correlation coefficient between the vertical and the Hilbert transformed radial components. The red dash line depicts the resulting station orientation 115.1°;(c) The P-wave polarization analysis for determining orientation of station B. The blue dashed line depicts the optimal sensor orientation,which is 108°为了更加准确地测定OBS水平分量方位,揭示OBS水平方位对接收函数研究的影响,并进而获得台站下方的地壳构造,本研究将充分利用CDPAPUA实验计划布设在古迪纳夫盆地和基里比斯盆地的八台OBS宽频带地震数据(图1),分别引入纵波和瑞雷波偏振分析方法,确定OBS水平分量的实际方位,并基于获得的水平分量方位参数校正OBS三分量波形数据,利用接收函数方法反演伍德拉克裂谷地区的地壳结构,以期为深入认识汇聚构造背景下大陆裂谷的起始张裂机制提供更多深部构造证据。
1. 数据和方法
1.1 瑞雷波偏振分析
瑞雷波偏振分析是基于从美国地震学研究联合会数据管理中心(Incorporated Research Institutions for Seismology Data Management Center,缩写为IRIS DMC)下载的CDPAPUA实验计划的八台OBS宽频带地震波形数据,其数据隶属于ZN台网(http://ds.iris.edu/mda/ZN/)。数据的筛选标准与Stachnik等(2012)所采用的类似:选取的地震事件为MS6.0以上;震中距控制在30°—100°范围内。所有的原始数据按照统一时间窗(瑞雷波理论到时前20 s和后600 s)进行截取,瑞雷波的理论到时根据平均速度4 km/s进行计算;之后将对所截取的面波数据段进行25—50 s的带通滤波,并人工检查筛选出高信噪比的数据。这样,最终获得66个地震事件(图1)的面波数据。
瑞雷波的特点是其质点按照逆时针方向作椭圆运动,理论上只有在垂直分量和径向分量上有观测信号。为了尽可能地避免计算瑞雷波复杂的椭圆特征,通常将希尔伯特变换应用于径向分量,进而建立起径向分量与垂直分量间的线性关系(Baker,Stevens,2004;Stachnik et al,2012)。OBS北向水平分量的方位可表示为
$$ \chi {{ = |{\rm{BAZ}} - }}\theta {{|}} ,$$ (1) 式中,BAZ为地震事件相对于地理北向的后方位角,θ为瑞雷波偏振分析获得的相对于地震计北向水平分量的后方位角(图2a)。本研究中,定义OBS的BH2水平分量为北向水平分量。对于某一地震事件,首先给定一个θ值,θ值的扫描区间为1°—360°,扫描间隔为1°;计算希尔伯特变换后的径向分量与垂向分量之间的互相关系数,其最大值所对应的θ值则为利用该地震事件数据确定的OBS北向水平分量的最佳方位(图2)。为了去除传播效应对结果的影响,我们剔除震源深度大于100 km且互相关系数小于0.4的地震事件。此外,每个地震事件确定的OBS方位角均需落在均值的95%置信区间内,其对应中值则为该OBS北向水平分量的最终方位偏转角度(Stachnik et al,2012)。
1.2 纵波偏振分析
与瑞雷波偏振分析类似,开展纵波偏振分析所用数据也是通过IRIS DMC下载获取,只是选取数据的标准不同:震中距范围为30°—180°;地震事件的最小阈值震级Mc是通过经验公式确定,其具体展开式为:
$$ {M}_{{\rm{c}}}=5.2+\frac{\varDelta -30}{180-30}-\frac{D}{700} {,} $$ (2) 式中:D为震源深度,单位为km;Δ为震中距,单位为度(Liu,Gao,2010)。地震事件波形时间窗为远震纵波理论到时前20 s至后260 s,其中纵波的理论到时通过地球一维速度模型IASP91 (Kennett,Engdahl,1991)计算获得。此外,利用垂直分量人工筛选出高信噪比的纵波信号,最终获得45个有效地震事件用于纵波偏振分析。
远震纵波信号理论上只有在径向分量上可以被观测到,而在切向分量上没有或很少有能量的分布。因此,对含有纵波信号窗口内的所有切向分量数据叠加,当叠加能量最小时(附图1)所对应的扫描方位偏转角度则为该地震台站北向水平分量的最佳方位(Niu,Li,2011)。纵波到时由人工拾取,并定义其前2 s至后2 s为波形叠加窗口。同一地震台站的所有切向分量数据以信噪比为权重进行叠加,具体表达式为(Niu,Li,2011):
$$ {E}_{T} ( \chi ) =\frac{{\displaystyle\sum _{i=1}^{N}}{\omega }_{i}{E}_{T}^{i} ( \chi ) }{{\displaystyle\sum_{i=1} ^{N}}{\omega }_{i}} \text{,} $$ (3) 式中:N为地震事件的数量;$E_T^i ( \chi ) $为第i个地震事件切向分量在纵波时窗内的能量。式(3)中的加权因子ωi进一步展开为(Niu,Li,2011):
$$ {\omega _i} = 0.5 ( {\rm{SN}}{{\rm{R}}_{i, {\rm{BHN}}}} + {\rm{SN}}{{\rm{R}}_{i, {\rm{BHE}}}} ) \text{,} $$ (4) 式中SNR为信噪比值。ET最小值所对应的χ即为所求值。χ的扫描范围为1°—360°,扫描间隔为1°。纵波偏振分析通常会得到两个最佳的结果(χ和χ+180°),通过参照瑞雷波偏振分析所得结果确定最终的方位角(图2c),其误差值利用迭代10次的重采样方法(Bootstrap)计算求得(Efron,Tibshirani,1986)。
1.3 接收函数方法
开展接收函数研究所用数据的初步筛选条件与纵波偏振分析相同。初筛之后,对所获原始地震波形数据进行0.08—0.8 Hz带通滤波,以提高信噪比。接收函数的产生是利用信噪比大于4的原始记录波形垂向分量对水平径向分量进行反褶积运算(Ammon,1991)。利用h-κ叠加方法处理人工筛选出的高信噪比接收函数,获得每台OBS下方的地壳厚度h和纵横波速比值κ (Zhu,Kanamori,2000)。h和κ的扫描区间分别设为10—40 km (间隔为0.1 km)和1.65—2.15 (间隔为0.001)。h-κ图中能量最强点处所对应的h和κ则为此地震台站下方的最终地壳厚度和纵横波速比值(图3)。根据前人的相关研究,地壳的平均纵波速度设为6.1 km/s (Abers et al,2002,2016)。同样,地壳厚度和纵横波速比的误差值也是通过10次迭代的重采样方法(Efron,Tibshirani,1986)计算获得。
![]() 图 3 地震台站B纵波偏振分析方位偏转校正前(a)和后(b)的h-κ叠加结果上图中黑色和红色线分别为每条接收函数和时间域所有接收函数简单叠加后的波形,蓝色线为校正前接收函数的简单叠加波形;下图左侧表示归一化后的h-κ叠加能量图,图中红点为叠加能量最强点,表示最终确定的地壳厚度h和纵横波速比值κ (vP/vS),NRFs为接收函数数量;右下图表示h-κ叠加能量图中不同纵横波速比值所对应的最大能量点连线Figure 3. h-κ stacking results from representative station B before (a) and after (b) misorientation correction from the P-wave polarization analysisThe upper panel shows individual (black trace) receiver functions (RFs) and a simple time-domain stack (red trace) of all RFs,and the blue trace represents the simple stacked RF trace in time domain before misorientation correction. The lower left panel illustrates the h-κ plot in which the maximum stacking amplitude (red dot) determines the optimal pair of crustal thickness h and vP/vS ratio κ. NRFs is number of receiver functions. The lower right panel displays the maximum stacking amplitude for each candidate vP/vS ratio in the h-κ plot
图 3 地震台站B纵波偏振分析方位偏转校正前(a)和后(b)的h-κ叠加结果上图中黑色和红色线分别为每条接收函数和时间域所有接收函数简单叠加后的波形,蓝色线为校正前接收函数的简单叠加波形;下图左侧表示归一化后的h-κ叠加能量图,图中红点为叠加能量最强点,表示最终确定的地壳厚度h和纵横波速比值κ (vP/vS),NRFs为接收函数数量;右下图表示h-κ叠加能量图中不同纵横波速比值所对应的最大能量点连线Figure 3. h-κ stacking results from representative station B before (a) and after (b) misorientation correction from the P-wave polarization analysisThe upper panel shows individual (black trace) receiver functions (RFs) and a simple time-domain stack (red trace) of all RFs,and the blue trace represents the simple stacked RF trace in time domain before misorientation correction. The lower left panel illustrates the h-κ plot in which the maximum stacking amplitude (red dot) determines the optimal pair of crustal thickness h and vP/vS ratio κ. NRFs is number of receiver functions. The lower right panel displays the maximum stacking amplitude for each candidate vP/vS ratio in the h-κ plot2. 结果与讨论
2.1 OBS水平分量方位及其对接收函数研究的影响
通过对伍德拉克裂谷地区八台OBS数据开展纵波和瑞雷波偏振分析,最终确定了其中七台OBS水平分量的方位(图2和附图2—3),台站I由于数据质量较差,无法获得其有效的水平分量方位角。基于纵波和瑞雷波偏振分析分别获得的七台OBS水平分量方位偏转角度相差4°—16.9°,互相关系数高达0.994 6 (图4a),其对应数值变化范围为29°—356°和3°—323° (表1)。Eilon等(2014)利用瑞雷波偏振分析获得了类似的结果(表1)。由图4和表1可见,纵波偏振分析的标准差普遍大于瑞雷波偏振分析的标准差,这可能与计算方法和所用数据集不同有关。理论测试表明地震事件方位的不均匀分布可能使纵波偏振分析产生较大的标准差(Lim et al,2018),为此将每个台站的所有纵波地震事件根据其后方位角分成四组,分别为0°—90°,90°—180°,180°—270°和270°—360°;之后基于每组后方位角内的地震事件数据进行纵波偏振分析,以求取所对应的OBS水平分量的方位偏转角度。虽然大多数地震事件的后方位角区间处于270°—360°,但每组数据计算获得的OBS水平分量方位角相差并不是很大(附表1)。基于纵波和瑞雷波偏振分析获得的结果表明CDPAPUA实验计划的OBS北向水平分量与地理北向有明显偏差,在利用水平分量波形数据开展反演研究时,需要首先对这些OBS水平分量的方位进行校正。
![]() 图 4 瑞雷波和纵波偏振分析得到的OBS方位结果对比图(a)以及本文与Abers等(2016)的地壳厚度结果对比(b)Figure 4. Comparisons of OBS orientations from the Rayleigh-wave and P-wave polarization analyses (a) and crustal thickness from this study and Abers et al (2016) (b),respectively表 1 纵波和瑞雷波偏振分析得到的每台OBS方位偏转角χ及其标准差STDTable 1. The resulting OBS orientations χ from analysis of the Rayleigh-wave and P-wave polarization analyses and their standard error STD for each station
图 4 瑞雷波和纵波偏振分析得到的OBS方位结果对比图(a)以及本文与Abers等(2016)的地壳厚度结果对比(b)Figure 4. Comparisons of OBS orientations from the Rayleigh-wave and P-wave polarization analyses (a) and crustal thickness from this study and Abers et al (2016) (b),respectively表 1 纵波和瑞雷波偏振分析得到的每台OBS方位偏转角χ及其标准差STDTable 1. The resulting OBS orientations χ from analysis of the Rayleigh-wave and P-wave polarization analyses and their standard error STD for each station台站 瑞雷波偏振分析 纵波偏振分析 χ*/° χ/° STD/° χ/° STD/° B 115.1 0.55 108 3.03 116.8 D 3.0 1.48 356 2.68 0.3 E 176.0 1.65 168 3.17 183.1 F 293.1 1.78 310 5.26 301.0 G 44.2 1.92 29 7.68 47.2 H 323.0 1.88 319 1.12 324.5 J 131.8 2.53 144 12.97 143.9 注:χ*为Eilon等(2014)基于瑞雷波偏振分析所得。 为了直观地展示OBS水平分量的方位偏转可能对接收函数研究的影响,我们分别利用原始的和经过纵波与瑞雷波偏振分析校正后的地震波形数据产生接收函数,并通过h-κ叠加方法确定地壳结构信息(附图4—6)。方位校正后的有效接收函数数量明显增多,尤其是对于一些方位偏转角大的地震台站,例如地震台站B,经纵波和瑞雷波偏振分析校正后其接收函数数量分别从原来的11条增加至17条和18条;而基于体波和瑞雷波分析校正后最终分别获得103条和126条接收函数。另外,地震台站方位校正后的有效地震事件的后方位角比校正前分布更均匀(附图4—5)。对于方位偏转角较大的地震台站,校正前、后的地壳厚度和纵横波速比值相差较大(图3),与CHINArray-I数据分析所得结论(Zeng et al,2021)一致。相比之下,方位偏转角较小的地震台站,其方位校正前后的h-κ叠加结果基本一致,如水平分量方位偏转角小于5°的地震台站D (附图4a和5b)。纵波和瑞雷波偏振分析校正后获得的地壳结构基本一致(表2和附表2),但地震台站G和H由瑞雷波偏振分析校正后得到的结果不佳(附图5e和5f)。由于远震纵波通常比面波含有更多的高频成分,并且受岩石圈的强横向非均质性影响较小(Zeng et al,2021),在下面讨论中主要基于纵波偏振分析校正后获得的地壳结构。
表 2 本文和前人获得的地壳厚度h和纵横波速比值κTable 2. Crustal thickness h and vP/vS ratios κ from this and previous studies台站 南纬/° 东经/° h /km h*/km κ B 9.749 150.350 30.4±0.21 27.8±0.53 1.94±0.028 D 9.943 150.707 36.7±0.16 44.9±0.73 1.89±0.005 E 10.080 150.621 34.2±2.69 − 1.82±0.059 F 9.950 150.200 31.7±0.96 36.2±0.61 1.90±0.072 G 9.333 149.667 25.8±0.73 31.5±0.84 2.04±0.039 H 9.000 149.668 16.8±0.71 36.8±0.74 1.94±0.085 J 8.870 149.934 29.8±0.60 39.2±0.38 1.99±0.043 注:h*为Abers等(2016)的结果。 2.2 古迪纳夫盆地和基里比斯盆地的地壳结构
伍德拉克裂谷地区获得的七台OBS下方地壳结构呈现显著的横向变化(图5和表2),其地壳厚度为16.8—36.7 km,平均值为(29.3±6.03) km。本研究获得的地壳厚度与瑞雷波-接收函数联合反演的大多数结果(Abers et al,2016)不太一致,其相关系数仅为0.323 7 (图4b),最大不同点在于基里比斯盆地地壳更薄(表2)。整个研究区域的纵横波速比κ值较大,处于1.82—2.04之间,平均值为1.93±0.66。Holbrook等(1992)的岩石实验研究表明κ值可指示地壳的大致组成,其中长英质岩石的κ值一般小于1.76,中间质岩石的κ值为1.76—1.81,镁铁质岩石的κ值大于1.81。Davies和Smith (1971)发现在东巴布亚半岛存在一厚度为12—18 km,由橄榄岩、辉长岩和玄武岩组成的超镁铁质岩体。因此,研究区域如此一致的高κ值则表明其地壳可能以镁铁质岩石为主。此外,流体和部分熔融体的存在也可使κ值增大(Watanabe,1993),特别在伍德拉克裂谷中心区域存在大量岩浆活动(图1)。古迪纳夫盆地和基里比斯盆地存在异常鲜明的地壳结构(厚度与纵横波波速比值),下面将对这两个区域展开详细讨论。
![]() 图 5 方位校正后地壳的平面(a,b)与剖面(c)结果图(a) 地壳厚度平面分布图;(b) 纵横波速比值κ平面分布图;(c) 地壳厚度(蓝色三角形)和地壳纵横波速比值(红色圆圈)沿图(a)中AA′测线的剖面结果图,其中上图为地形起伏,中图红色波形为时深转换后的叠加接收函数Figure 5. Planar (a,b) and vertical (c) display of the resulting crustal measurements after misorientation corrections(a,b) Crustal thickness and vP/vS ratio in planar view,respectively;(c) Vertical display of crustal thickness (blue triangles) and vertical display of crustal vP/vS ratio (red circles) along the AA′ profile in fig.(a). The upper panel shows the topography,red traces in the middle panel are the stacked receiver function traces after time-depth conversion
图 5 方位校正后地壳的平面(a,b)与剖面(c)结果图(a) 地壳厚度平面分布图;(b) 纵横波速比值κ平面分布图;(c) 地壳厚度(蓝色三角形)和地壳纵横波速比值(红色圆圈)沿图(a)中AA′测线的剖面结果图,其中上图为地形起伏,中图红色波形为时深转换后的叠加接收函数Figure 5. Planar (a,b) and vertical (c) display of the resulting crustal measurements after misorientation corrections(a,b) Crustal thickness and vP/vS ratio in planar view,respectively;(c) Vertical display of crustal thickness (blue triangles) and vertical display of crustal vP/vS ratio (red circles) along the AA′ profile in fig.(a). The upper panel shows the topography,red traces in the middle panel are the stacked receiver function traces after time-depth conversion古迪纳夫盆地布置的四台OBS分布于伍德拉克裂谷扩张轴附近(图1),四台OBS下的地壳厚度由裂谷两侧36.7 km减薄至裂谷扩张轴处30.4 km (图5),扩张轴附近的地壳平均厚度为(33.3±2.42) km。Abers等(2016)也观测到了类似的地壳减薄趋势。因此,裂谷的张裂活动在地壳减薄中可能起到主要作用。前人研究大多集中在当特尔卡斯托群岛及其周边区域(Zelt et al,2001;Abers et al,2002,2016;Ferris et al,2006),其中接收函数相关研究显示:此群岛地区的地壳有明显减薄(大约20 km);当特尔卡斯托群岛和裂谷地区的上地幔呈现出大范围的低速异常(Abers et al,2002;Ferris et al,2006;Eilon et al,2015;Jin et al,2015),然而此群岛的地壳大致由长英质或中间质岩石组成(Ferris et al,2006)。靠近当特尔卡斯托群岛处κ值呈增大的趋势(图5),可能是与古俯冲残片的脱水有关。远震体波层析成像观测到上地幔中存在高速异常的古俯冲残片(Eilon et al,2015;Yu et al,2022),在其沉降过程中会把脱水作用产生的轻物质带到浅层地壳,从而改变地壳组成进而导致其高κ值,并可能激发超高压岩石的出露(Zheng,2009;Little et al,2011;Yu et al,2022)。
由三台OBS计算得到的基里比斯盆地地区的地壳平均厚度为(24.1±5.44) km,相比于古迪纳夫盆地要薄得多,平均κ值为1.99±0.041。虽然地壳厚度观测结果与面波-接收函数联合反演的结果(地壳厚度范围为31.5—39.2km,平均值为35.8km)相差较大(Abers et al,2016),但与此地区早期主动源地震折射研究获得的地壳结构(地壳厚度为22—24 km)一致(Finlayson et al,1976,1977)。同时,瑞雷波层析成像结果显示基里比斯盆地在20 km以下更深处不存在明显的速度不连续界面,在30—60 km的浅层地幔处呈强横波慢速异常(Jin et al,2015),与本文观测到的较薄地壳厚度一致。另外,基于伍德拉克裂谷海域的四条地震测线(图1)开展的构造重建和沉降研究分析显示,测线1181所处的地壳水平伸展了21.72 km,比其余三条测线1168,1190和1193的伸展量都大(对应地壳水平伸展量依次为18.2,18.3和17.0 km)(Fitz,Mann,2013)。前期(Eilon et al,2015)和近期(Yu et al,2022)远震体波层析成像研究表明在基里比斯盆地100 km地幔深度处存在高速异常和地震活动,这可能是由于古俯冲残片脱水熔融导致上覆地壳的减薄并改变地壳的局部组成,从而引起κ值的增大。
3. 结论
本文通过纵波和瑞雷波偏振分析确定了伍德拉克裂谷地区七台OBS水平分量的方位,利用方位校正后的地震波形数据开展接收函数的地壳构造研究,主要得到以下结论:
1) 伍德拉克裂谷大部分OBS存在水平分量的方位偏差,在开展基于三分量波形数据地震学研究时需对其进行校正;
2) 古迪纳夫盆地的地壳厚度由裂谷两侧向裂谷扩张轴处逐渐变薄,而位于裂谷西北部的基里比斯盆地的地壳更薄,可能是古俯冲残片脱水熔融改造的结果;
3) 研究区域整体呈现较大的纵横波速比值,可能是巴布亚超镁铁质体的存在和古俯冲残片脱水熔融共同作用的结果。
本文研究揭示出古俯冲残片在汇聚构造背景下的大陆裂谷起始张裂过程中起到推动作用,后续将进一步开展高精度深部构造研究,揭示其作用机制与过程。
本文附图和附表请参见本刊网站https://www.dzxb.org/cn/article/doi/10.11939/jass.20220091上的资源附件。
-
![]()
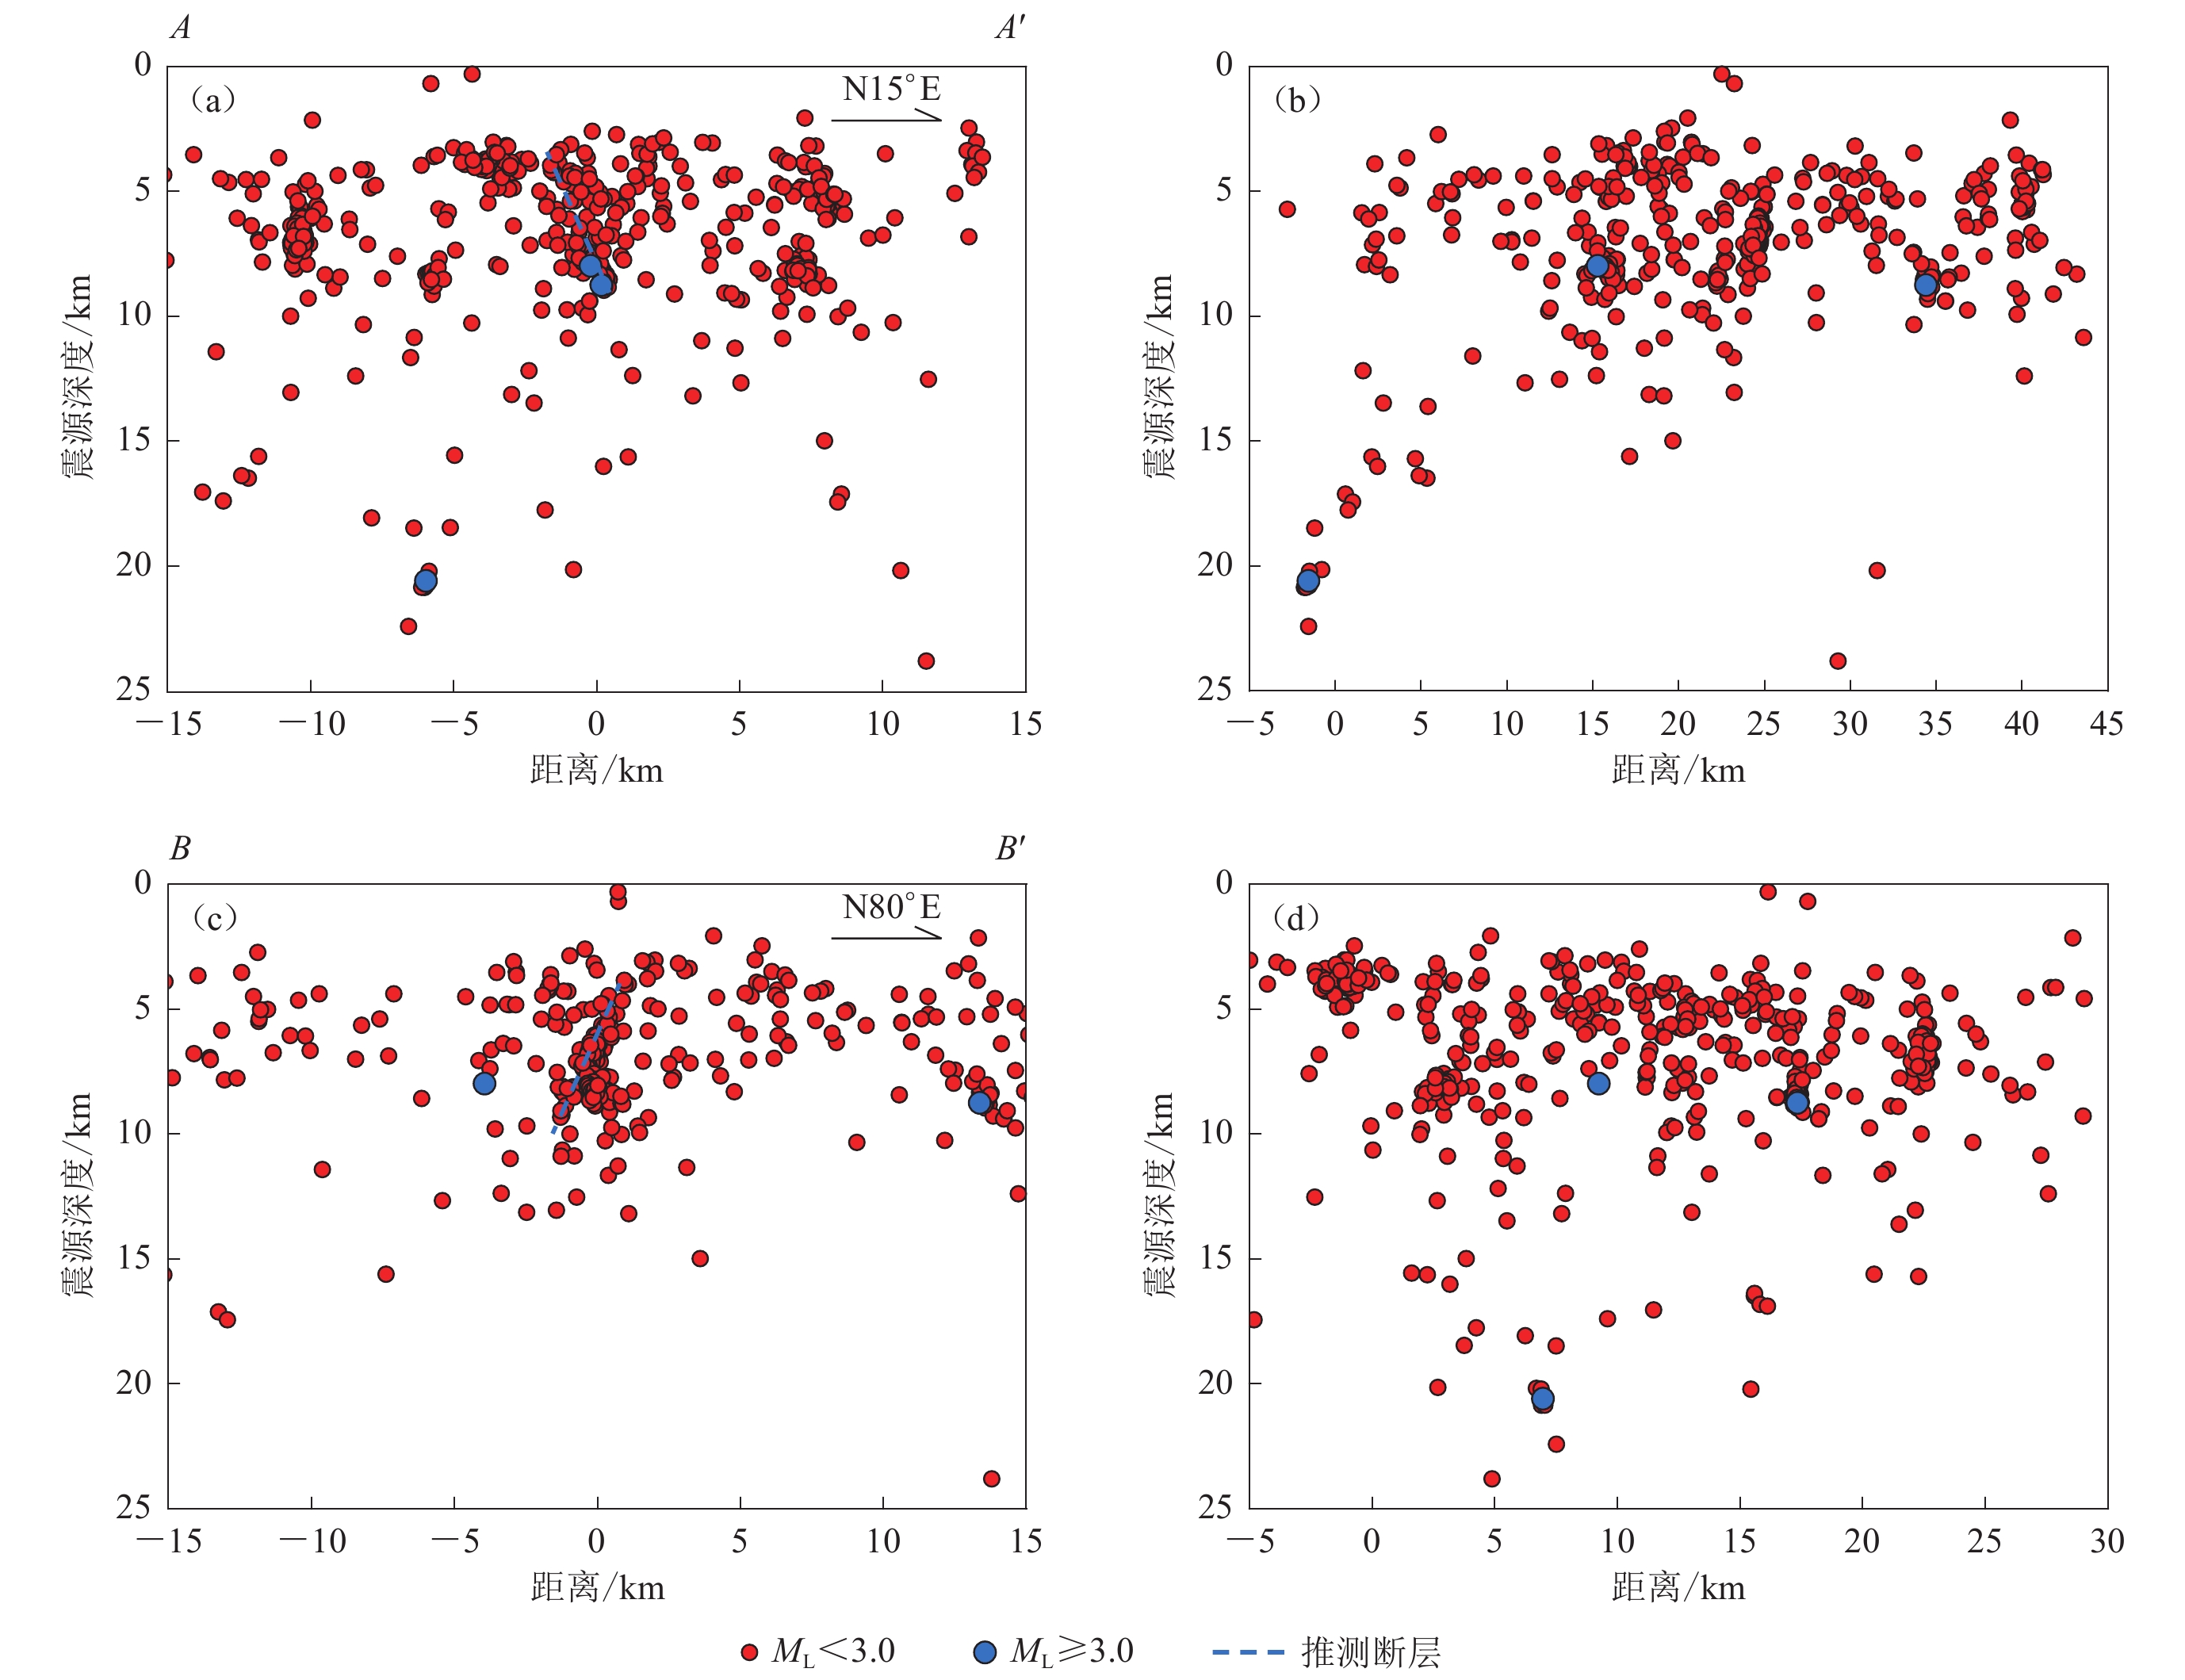
图 7 沿或垂直于地震密集条带AA′ (a)和BB′(b)的地震震源深度分布特征
(a) 震源深度沿AA′方向的分布;(b) 震源深度垂直于AA′方向的分布;(c) 震源深度沿BB′方向的分布;(d) 震源深度垂直于BB′方向的分布
Figure 7. Distribution characteristics of focal depth along/perpendicular to seismic dense zones AA′ and BB′
(a) Distribution of focal depth along the AA′ direction;(b) Distribution of focal depth perpendicular to AA′; (c)Distribution of focal depth along the BB′ direction;(d) Distribution of focal depth perpendicular to BB′
![]()
图 1 区域构造背景(a)和研究区内断裂、台站分布(b)
图(a)中地形起伏数据来源于SRTM15+ (Tözer et al,2019)
Figure 1. Regional tectonic background (a) and distribution of faults and stations in the study area (b)
In Fig. (a),relief data are from SRTM15+ (Tözer et al,2019)
![]()
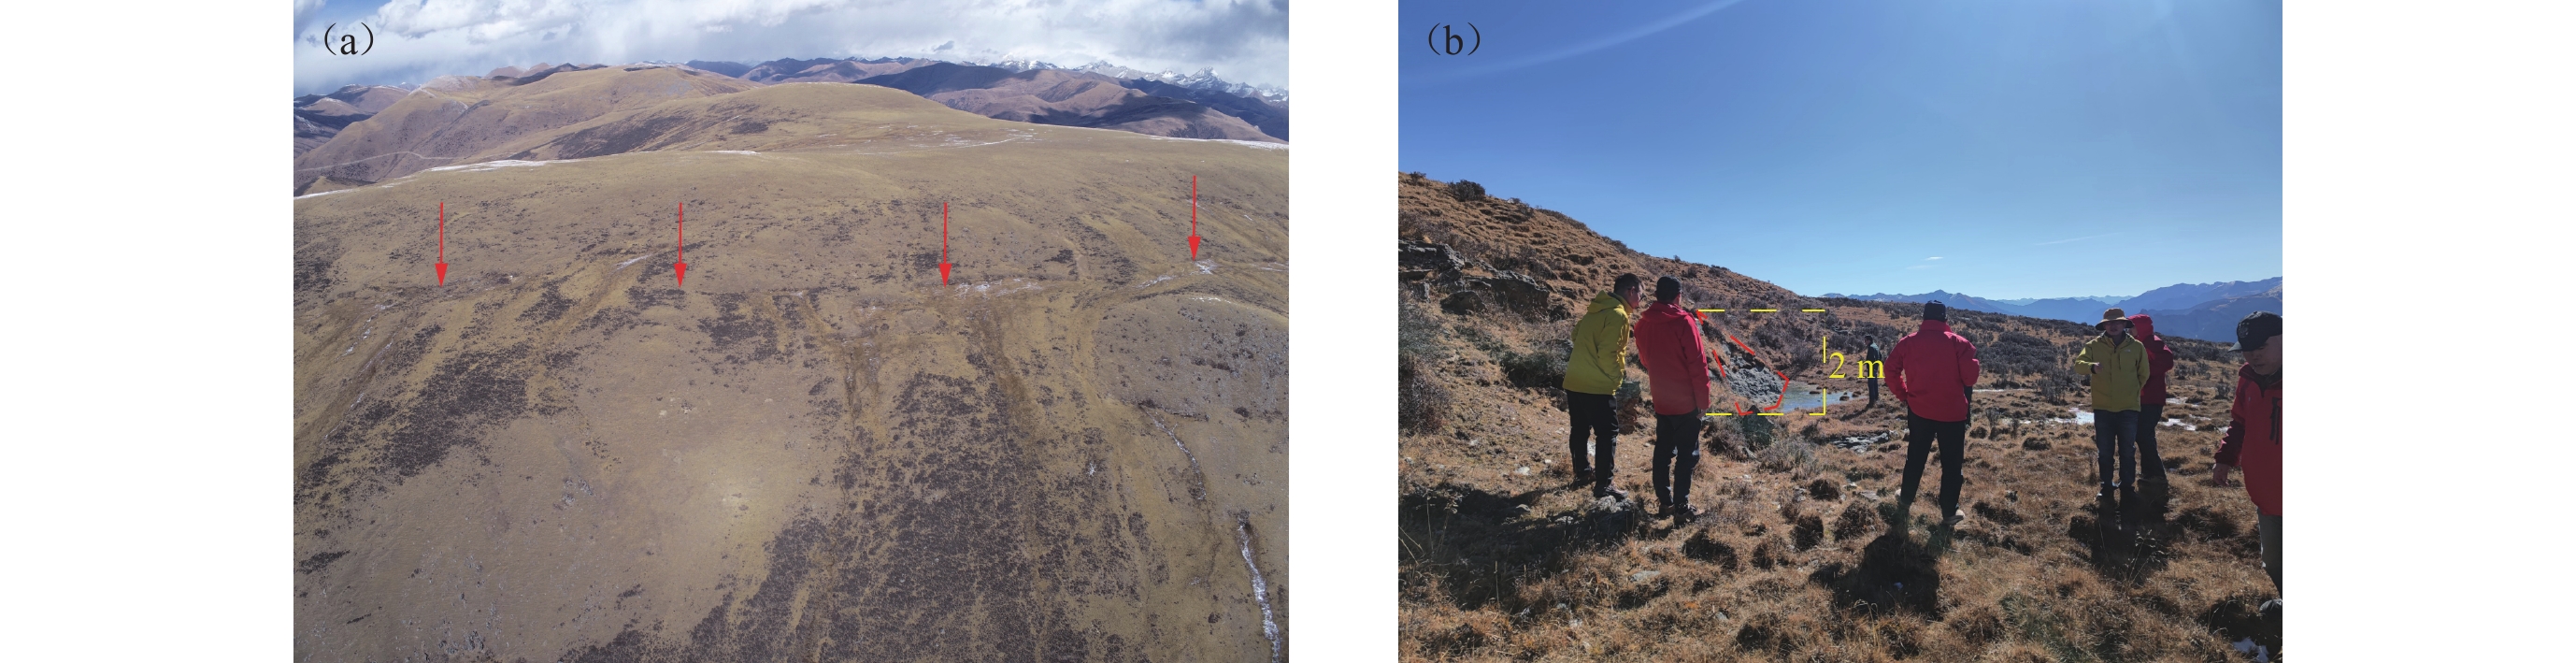
图 2 研究区东部麦宿断裂地震地表破裂带的卫星解译图(a)及其东段放大图(b)(奥维互动地图截图)
红色箭头指向地震地表破裂带位置,下同
Figure 2. Satellite interpretation of earthquake surface rupture zone along the Maisu fault in the eastern study area (a) and zooming of its eastern segment (screenshot of Ovi interactive map)
The red arrow points to the earthquake surface rupture zone,the same below
![]()
图 3 麦宿断裂地震地表破裂带无人机航拍图(镜向北)(a)及其断错地貌特征(镜向西)(b)
Figure 3. Unmanned aerial vehicle photo showing the surface rupture zone of Maisu fault (view to the north) (a) and the faulted landform characteristics (view to the west)(b)
![]()
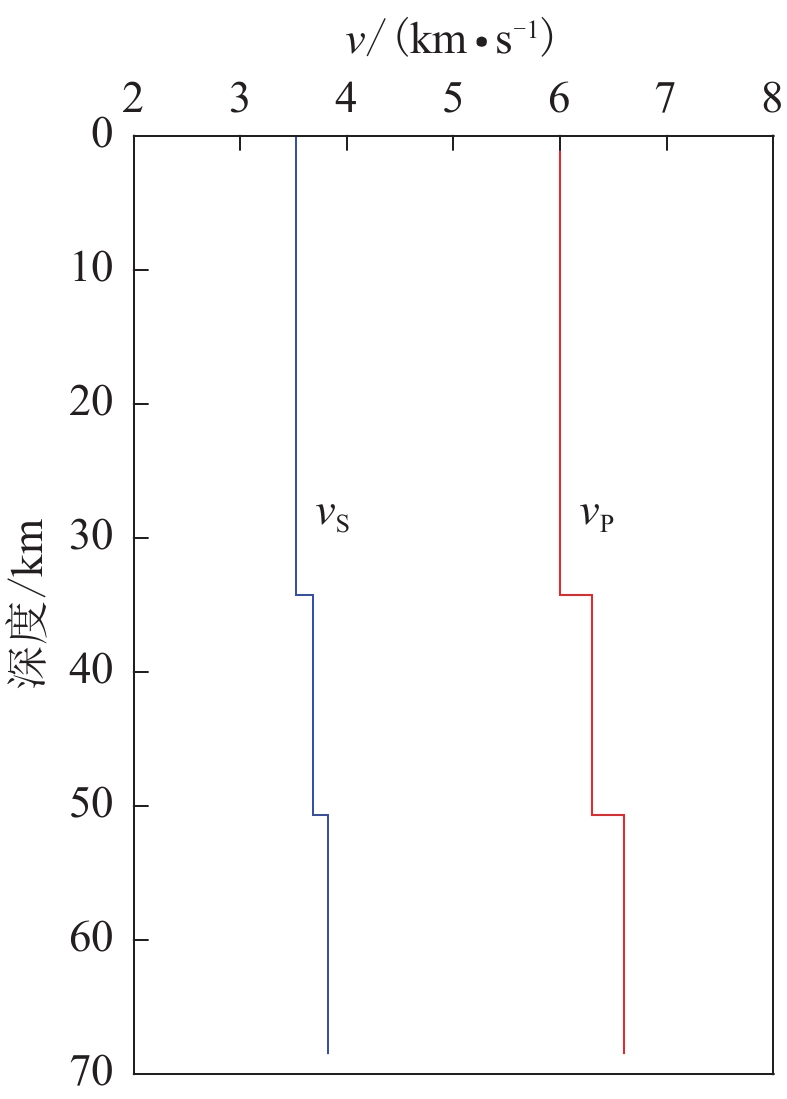
图 4 (98.5° E,31.5° N)处的Crust1.0速度模型
Figure 4. Crust1.0 velocity model at the point (98.5° E,31.5° N)
![]()
图 5 基于不同方法的地震定位结果对比
(a) 基于机器学习的定位结果;(b) 双差定位后的精定位结果
Figure 5. Comparison of earthquake location results by different methods
(a) Location results based on machine learning;(b) Relocation results by double difference location
![]()
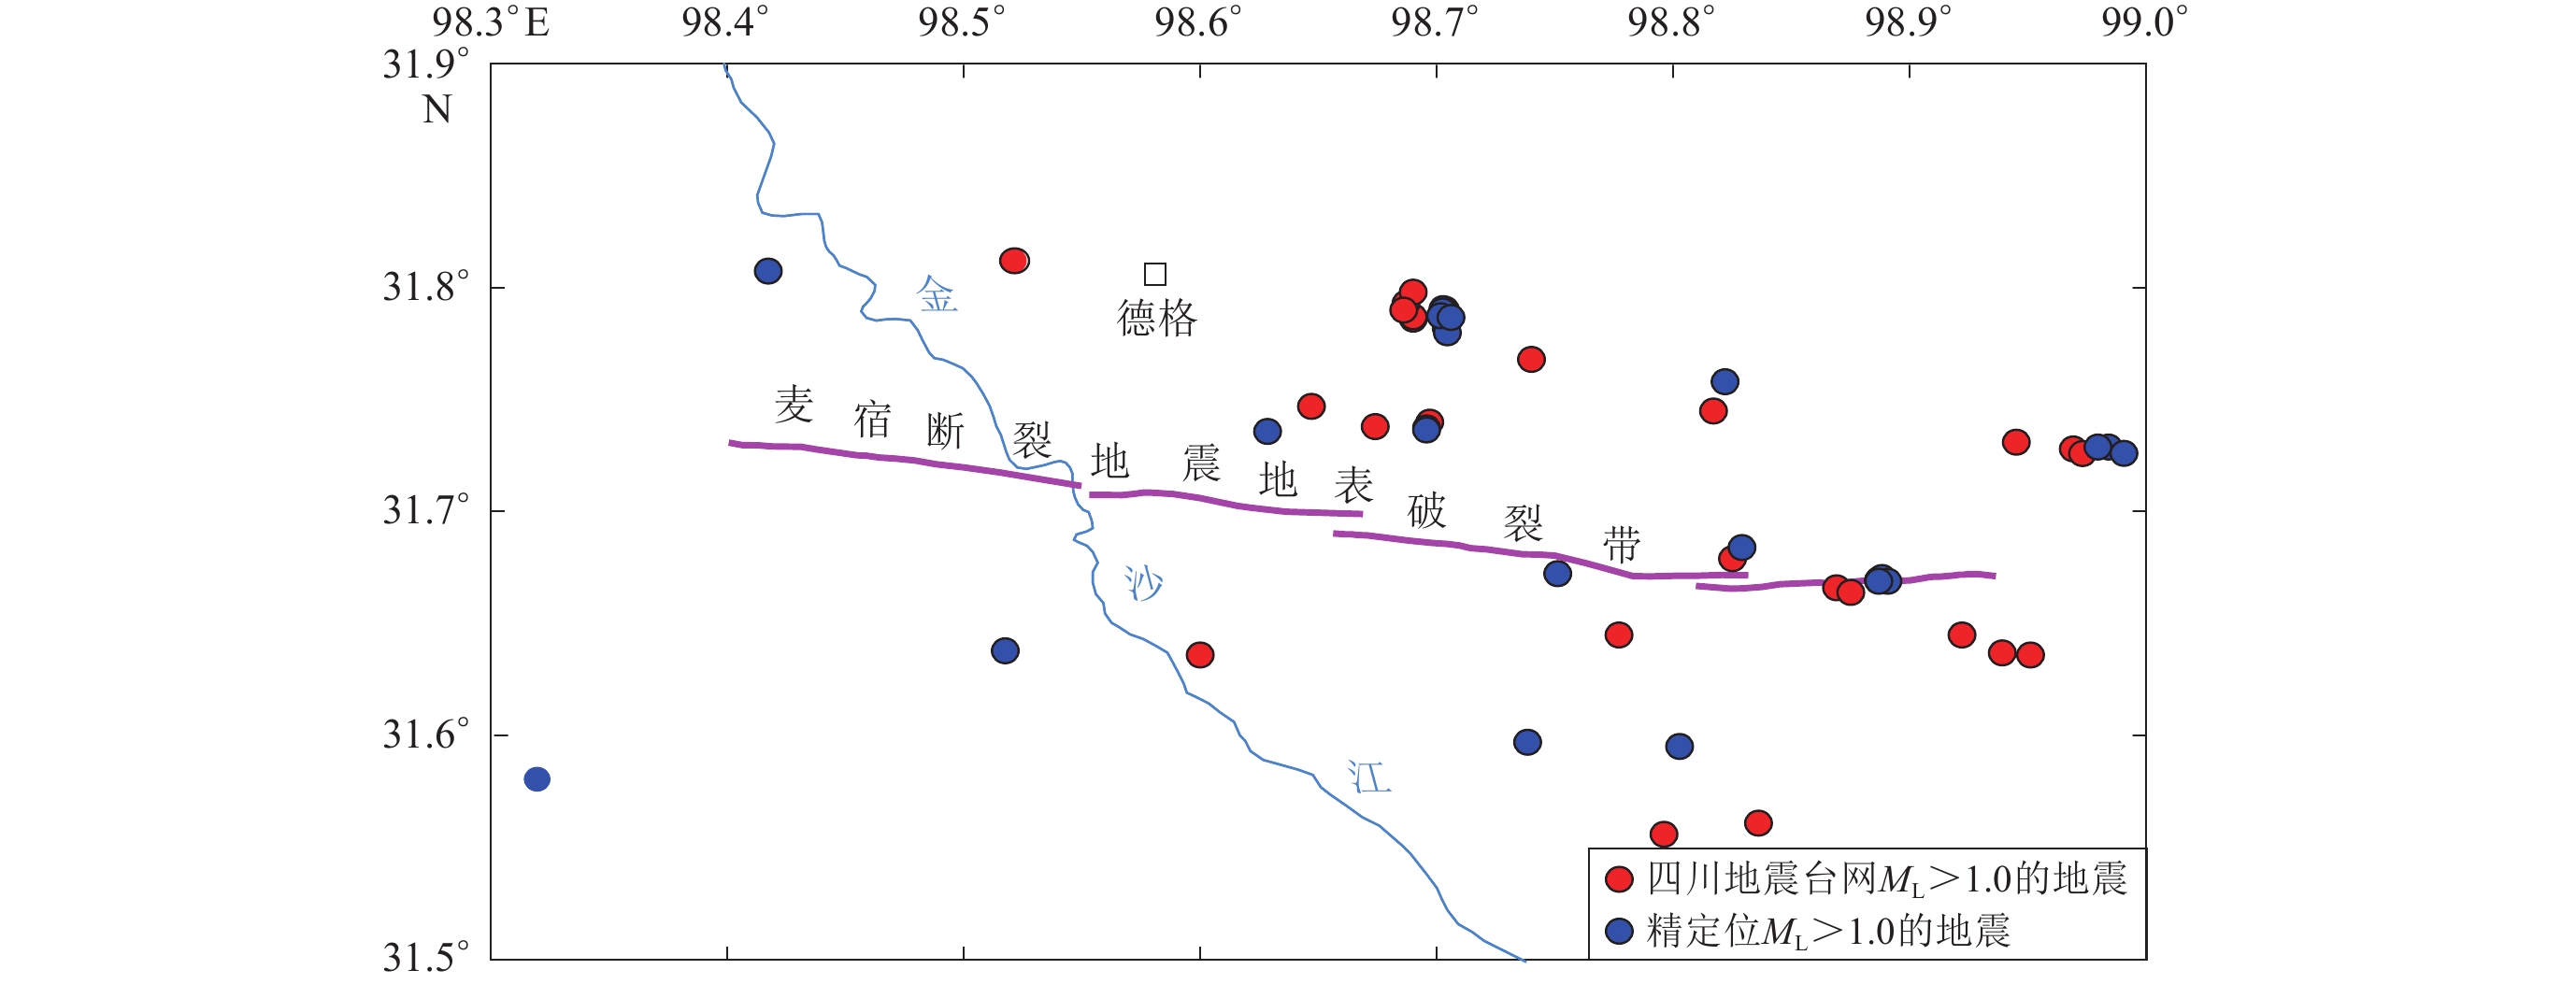
图 6 四川省地震台网记录的ML>1.0地震数据与精定位后的结果对比
Figure 6. Comparison between the seismic data of ML>1.0 earthquakes recorded by Sichuan seismic network with precise location results
![]()
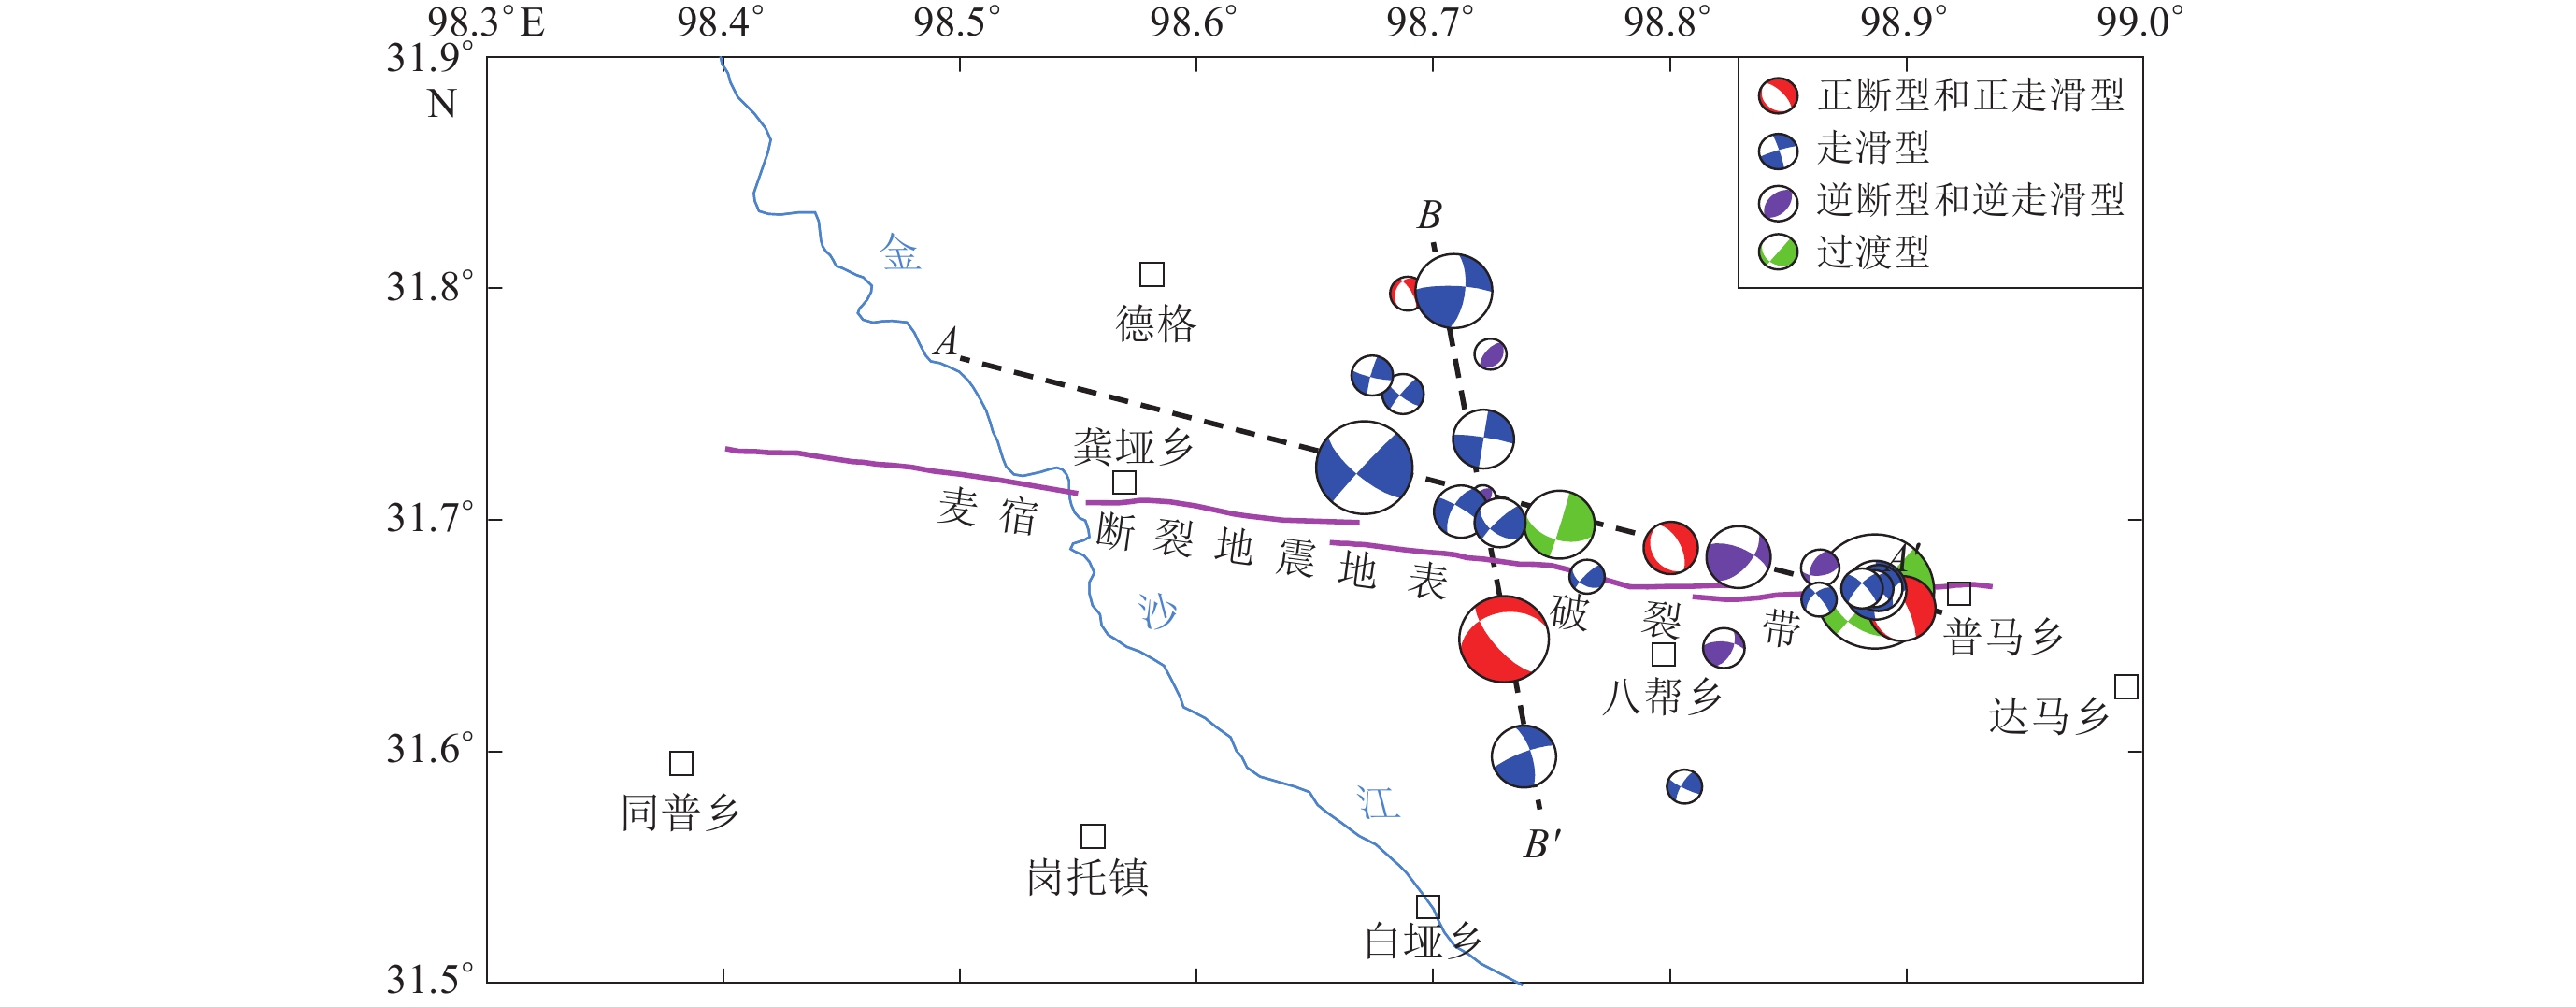
图 8 利用P波初动HASH方法所获得的37组震源机制解的空间分布
Figure 8. Spatial distribution of the 37 focal mechanism solutions acquired using the HASH method based on P wave initial motion
![]()
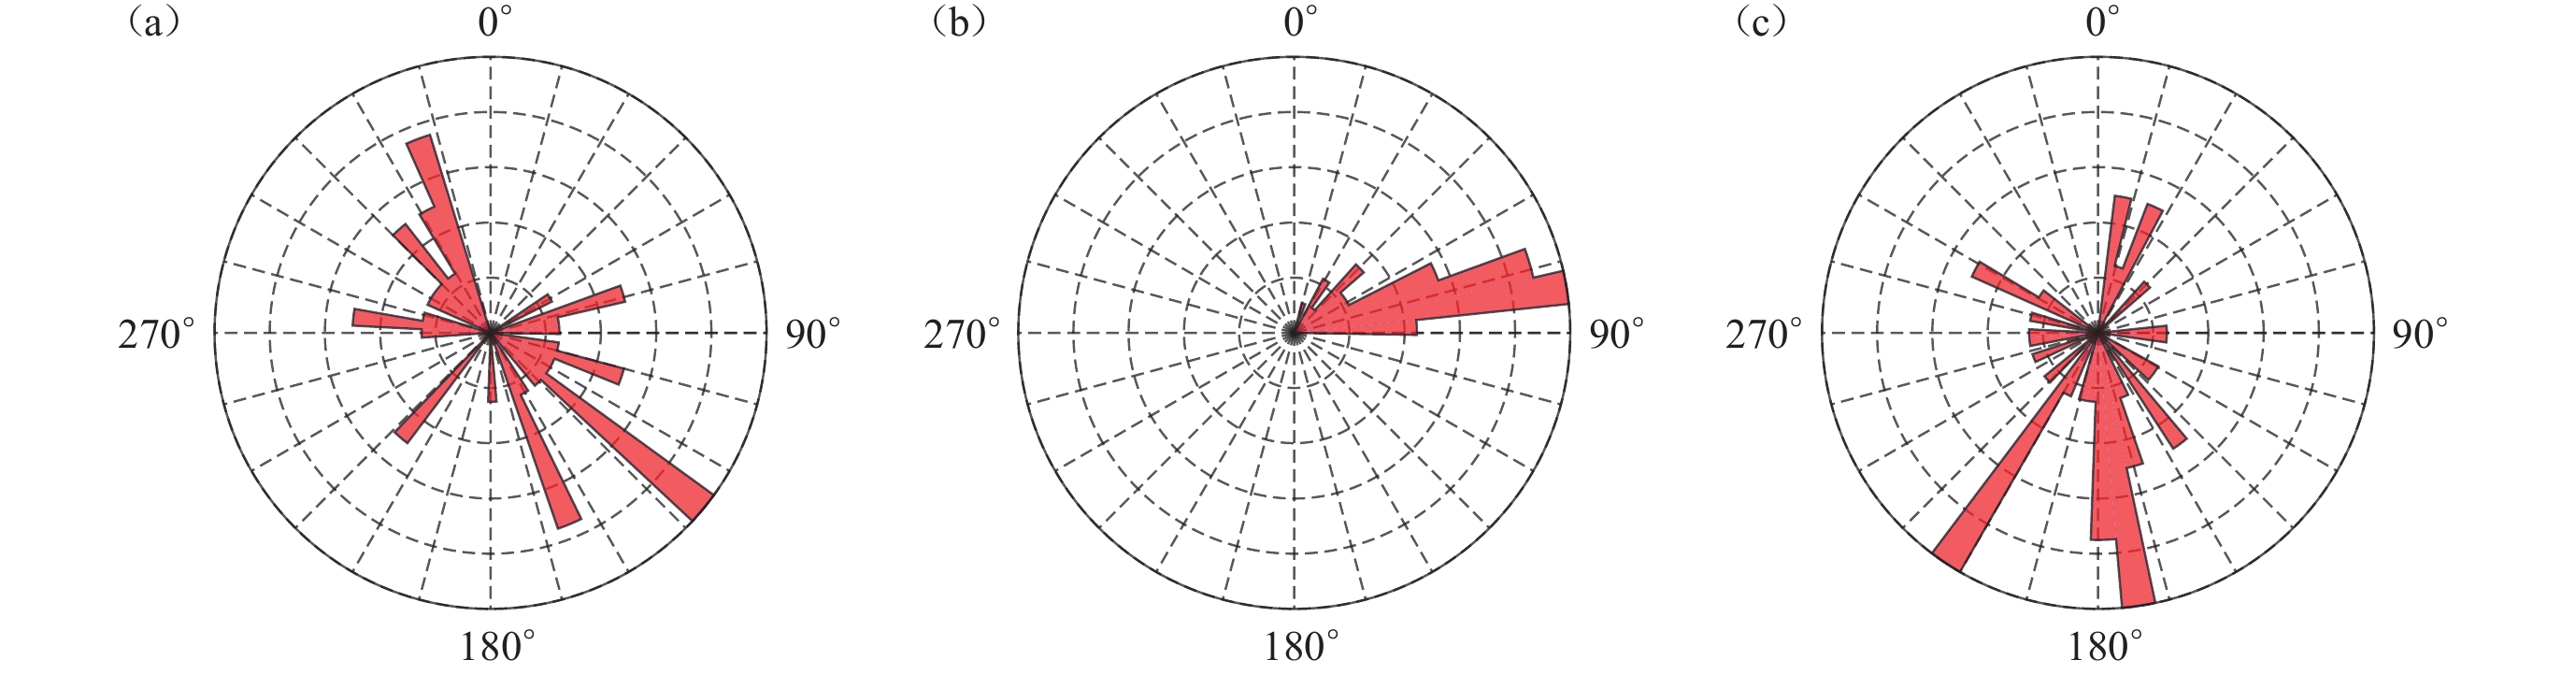
图 9 37组震源机制解走向(a)、倾角(b)、滑动角(c)的玫瑰花状图统计
Figure 9. Rose diagrams showing the distribution of strike (a),dip (b) and slip angle (c) of the 37 focal mechanism solutions
![]()
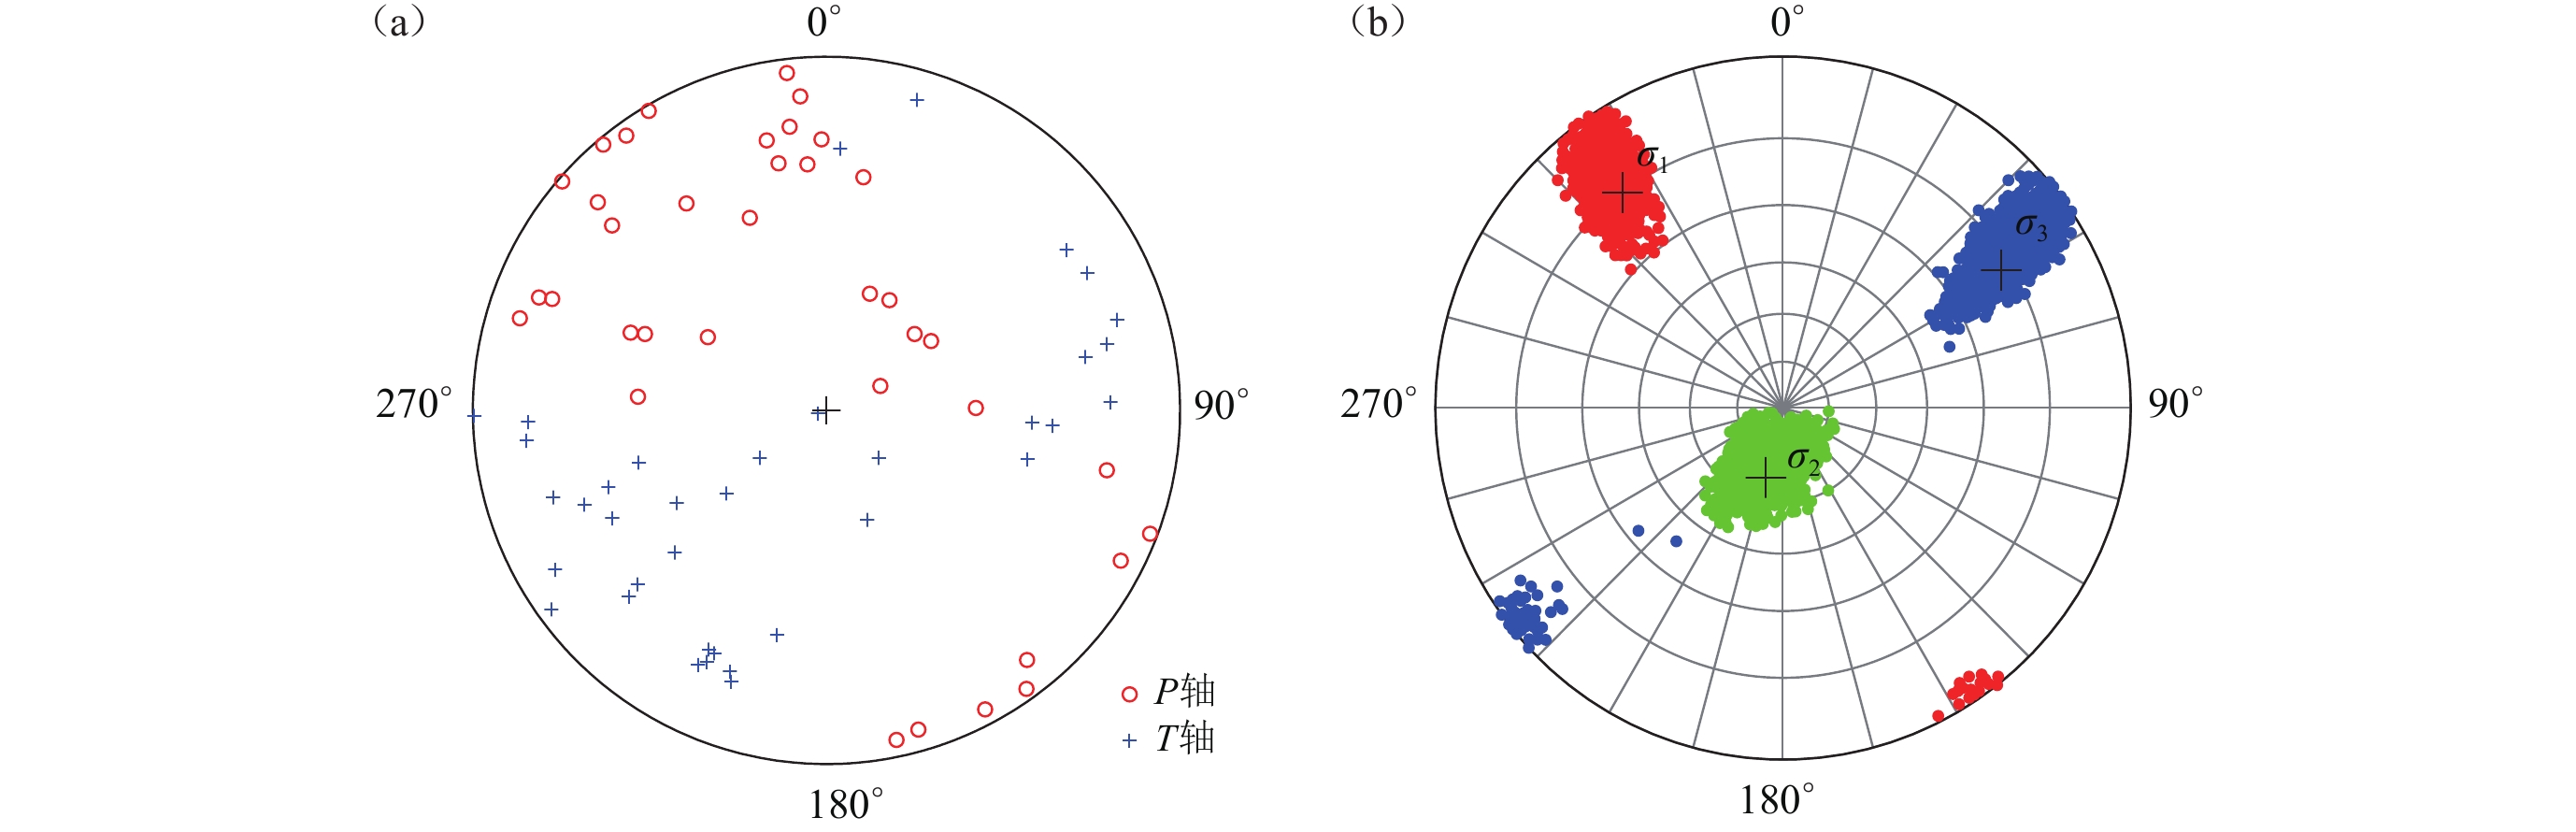
图 10 37组震源机制解的P轴、T轴分布(a)和研究区的应力场反演结果(b)
图(b)中红点、绿点和蓝点分别表示在95%置信度水平下最大(σ1)、中间(σ2)和最小(σ3)主压应力轴的不确定范围,加号为最优解
Figure 10. Distribution of P and T axes of the 37 focal mechanism solutions (a) and stress field inversion results (b)
The red,green and blue dots in Fig. (b) denote the uncertainty ranges of the maximum (σ1),intermediate (σ2) and minimum (σ3) principal compressive stress axes with the 95% confidence level,respectively,while the plus signs mark the optimal solutions
![]()
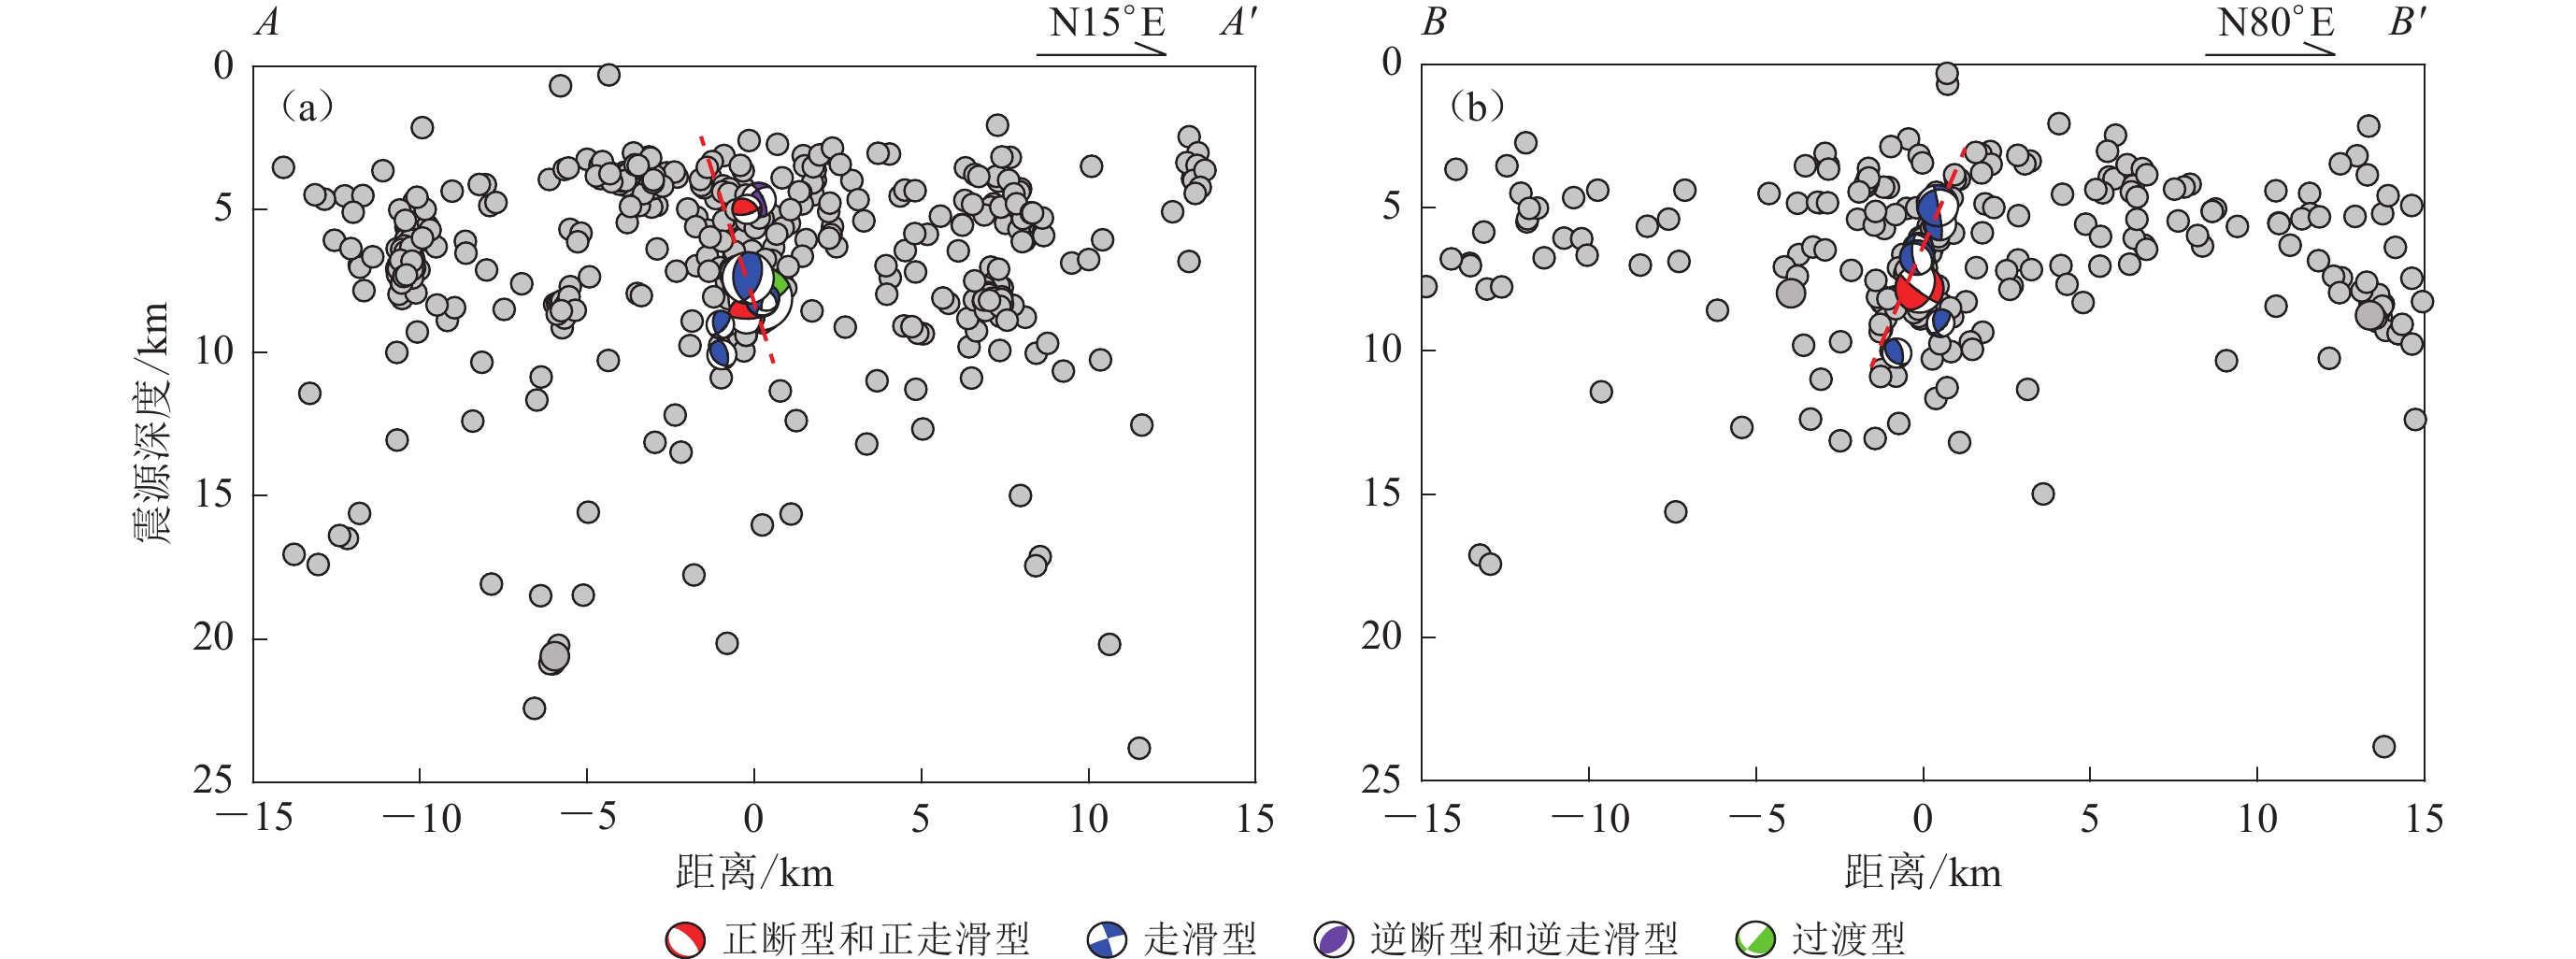
图 11 沿AA′ (a)和BB′ (b)地震密集分布带ML≥1.5地震的震源机制解的深度分布
沿AA′和BB′地震密集带的震源机制解分别有11组和7组。灰色实心圆圈表示地震事件;图(a)中虚线表示麦宿断裂的剖面位置,图(b)中虚线表示NNW−SSE向断层的剖面位置
Figure 11. Depth distribution of focal mechanism solutions of ML≥1.5 earthquakes along the seismic dense zones AA′ (a) and BB′ (b)
There are 11 focal mechanism solutions along the AA′ seismic dense zone and 7 focal mechanism solutions along the BB′ seismic dense zone. Gray dots represent seismic events. The dashed line in Fig. (a) shows the sectional location of the Maisu fault,and the dashed line in Fig. (b) shows the sectional location of the NNW-SSE-striking fault
-
陈立春,王虎,冉勇康,孙鑫喆,苏桂武,王继,谭锡斌,李智敏,张晓清. 2010. 玉树MS7.1 级地震地表破裂与历史大地震[J]. 科学通报,55(13):1200–1205. Chen L C,Wang H,Ran Y K,Sun X Z,Su G W,Wang J,Tan X B,Li Z M,Zhang X Q. 2010. The MS7.1 Yushu earthquake surface rupture and large historical earthquakes on the Garzê-Yushu fault[J]. Chinese Science Bulletin,55(31):3504–3509. doi: 10.1007/s11434-010-4079-2
程佳. 2008. 川西地区现今地壳运动的大地测量观测研究[D]. 北京: 中国地震局地质研究所: 45–55 Cheng J. 2008. Present-Day Crustal Deformation of Western Sichuan Inferred From Geodetic Observations[D]. Beijing: Institute of Geophysics, China Earthquake Administration: 45–55 (in Chinese).
崔效锋,谢富仁,张红艳. 2006. 川滇地区现代构造应力场分区及动力学意义[J]. 地震学报,28(5):451–461. doi: 10.3321/j.issn:0253-3782.2006.05.001 Cui X F,Xie F R,Zhang H Y. 2006. Recent tectonic stress field zoning in Sichuan-Yunnan region and its dynamic interest[J]. Acta Seismologica Sinica,19(5):485–496. doi: 10.1007/s11589-006-0501-x
邓起东,张培震,冉勇康,杨晓平,闵伟,楚全芝. 2002. 中国活动构造基本特征[J]. 中国科学:D 辑,32(12):1020–1030. Deng Q D,Zhang P Z,Ran Y K,Yang X P,Min W,Chu Q Z. 2003. Basic characteristics of active tectonics of China[J]. Science in China:Series D,46(4):356–372.
邓起东,闻学泽. 2008. 活动构造研究:历史、进展与建议[J]. 地震地质,30(1):1–30. doi: 10.3969/j.issn.0253-4967.2008.01.002 Deng Q D,Wen X Z. 2008. A review on the research of active tectonics:History,progess and suggestions[J]. Seismology and Geology,30(1):1–30 (in Chinese).
杜方,龙锋,阮祥,易桂喜,宫悦,赵敏,张致伟,乔慧珍,汪智,吴江. 2013. 四川芦山 7.0 级地震及其与汶川 8.0 级地震的关系[J]. 地球物理学报,56(5):1772–1783. Du F,Long F,Ruan X,Yi G X,Gong Y,Zhao M,Zhang Z W,Qiao H Z,Wang Z,Wu J. 2013. The M7.0 Lushan earthquake and the relationship with the M8.0 Wenchuan earthquake in Sichuan,China[J]. Chinese Journal of Geophysics,56(5):1772–1783 (in Chinese).
郭祥云,陈学忠,王生文,王恒信. 2014. 川滇地区中小地震震源机制解及构造应力场的研究[J]. 地震工程学报,36(3):599–607. Guo X Y,Chen X Z,Wang S W,Wang H X. 2014. Focal mechanism of small and moderate earthquakes and tectonic stress field in Sichuan-Yunnan areas[J]. China Earthquake Engineering Journal,36(3):599–607 (in Chinese).
黄骥超,万永革,盛书中,李祥,高熹微. 2016. 汤加—克马德克俯冲带现今非均匀应力场特征及其动力学意义[J]. 地球物理学报,59(2):578–592. Huang J C,Wan Y G,Sheng S Z,Li X,Gao X W. 2016. Heterogeneity of present-day stress field in the Tonga-Kermadec subduction zone and its geodynamic significance[J]. Chinese Journal of Geophysics,59(2):578–592 (in Chinese).
黄媛,杨建思,张天中. 2006. 2003年新疆巴楚—伽师地震序列的双差法重新定位研究[J]. 地球物理学报,49(1):162–169. Huang Y,Yang J S,Zhang T Z. 2006. Relocation of the Bachu-Jiashi,Xinjiang earthquake sequence in 2003 using the double-difference location algorithm[J]. Chinese Journal of Geophysics,49(1):162–169 (in Chinese). doi: 10.1002/cjg2.822
蒋海昆,郑建常,吴琼,曲延军,李永莉,代磊. 2007. 中国大陆中强以上地震余震分布尺度的统计特征[J]. 地震学报,29(2):151–164. Jiang H K,Zhen J C,Wu Q,Qu Y J,Li Y L,Dai L. 2007. Statistical features of aftershock distribution size for mode-rate and large earthquakes in Chinese mainland[J]. Acta Seismologica Sinica,29(2):151–164 (in Chinese).
阚荣举,张四昌,晏凤桐,俞林胜. 1977. 我国西南地区现代构造应力场与现代构造活动特征的探讨[J]. 地球物理学报,20(2):96–109. Kan R J,Zhang S C,Yan F T,Yu L S. 1977. Present tectonic stress field and its relation to the characteristics of recent tectonic activity in southwestern China[J]. Acta Geophysica Sinica,20(2):96–109 (in Chinese).
李晗,常旭. 2021. 微地震震源机制研究进展[J]. 中国科学:地球科学,51(3):325–338. Li H,Chang X. 2021. A review of the microseismic focal mechanism research[J]. Science China Earth Sciences,64(3):351–363. doi: 10.1007/s11430-020-9658-7
鲁人齐,房立华,郭志,张金玉,王伟,苏鹏,陶玮,孙晓,刘冠伸,单新建,何宏林. 2022. 2022年6月1日四川芦山MS6.1强震构造精细特征[J]. 地球物理学报,65(11):4299–4310. Lu R Q,Fang L H,Guo Z,Zhang J Y,Wang W,Su P,Tao W,Sun X,Liu G S,Shan X J,He H L. 2022. Detailed structural characteristics of the 1 June 2022 MS6.1 Sichuan Lushan strong earthquake[J]. Chinese Journal of Geophysics,65(11):4299–4310 (in Chinese).
孟文,郭祥云,李永华,韩立波,张重远. 2022. 青藏高原东北缘构造应力场及动力学特征[J]. 地球物理学报,65(9):3229–3251. Meng W,Guo X Y,Li Y H,Han L B,Zhang C Y. 2022. Tectonic stress field and dynamic characteristics in the northeastern margin of the Tibetan Plateau[J]. Chinese Journal of Geophysics,65(9):3229–3251 (in Chinese).
沈军,陈建波,王翠,吴传勇,宋正娜. 2006. 2003 年 2 月 24 日新疆巴楚—伽师 6.8 级地震发震构造[J]. 地震地质,28(2):205–212. Shen J,Chen J B,Wang C,Wu C Y,Song Z N. 2006. The seismogenic tectonics of the MS6.8 Bachu-Jiashi,Xinjiang earthquake in Feb. 24,2003[J]. Seismology and Geology,28(2):205–212 (in Chinese).
孙银涛,徐国栋,龙海云,许立红. 2016. 震级与破裂长度统计关系研究[J]. 地震学报,38(5):803–806. Sun Y T,Xu G D,Long H Y,Xu L H. 2016. Relationship between magnitude and rupture length[J]. Acta Seismologica Sinica,38(5):803–806 (in Chinese).
王阎昭,王恩宁,沈正康,王敏,甘卫军,乔学军,孟国杰,李铁明,陶玮,杨永林,程佳,李鹏. 2008. 基于GPS资料约束反演川滇地区主要断裂现今活动速率[J]. 中国科学:D 辑,38(5):582–597. Wang Y Z,Wang E N,Shen Z K,Wang M,Gan W J,Qiao X J,Meng G J,Li T M,Tao W,Yang Y L,Cheng J,Li P. 2008. GPS-constrained inversion of present-day slip rates along major faults of the Sichuan-Yunnan region,China[J]. Science in China:Series D,51(9):1267–1287. doi: 10.1007/s11430-008-0106-4
闻学泽,徐锡伟,郑荣章,谢英情,万创. 2003. 甘孜—玉树断裂的平均滑动速率与近代大地震破裂[J]. 中国科学:D 辑,33(B04):199–208. Wen X Z,Xu X W,Zheng R Z,Xie Y Q,Wang C. 2003. Average slip-rate and recent large earthquake ruptures along the Ganzi-Yushu fault[J]. Science in China:Series D,33(B04):199–208 (in Chinese).
谢富仁,祝景忠,粱海庆,刘光勋. 1993. 中国西南地区现代构造应力场基本特征[J]. 地震学报,15(4):407–417. Xie F Z,Zhu J Z,Liang H Q,Liu G X. 1993. Basic characteristics of modern tectonic stress field in southwest China[J]. Acta Seismologica Sinica,15(4):407–417 (in Chinese).
徐锡伟,闻学泽,郑荣章,马文涛,宋方敏,于贵华. 2003. 川滇地区活动块体最新构造变动样式及其动力来源[J]. 中国科学:D辑,33(增刊):151–151. Xu X W,Wen X Z,Zheng R Z,Ma W T,Song F M,Yu G H. 2003. Pattern of latest tectonic motion and its dynamics for active blocks in Sichuan-Yunnan region,China[J]. Science in China:Series D,46(2):210–226.
徐锡伟,张培震,闻学泽,秦尊丽,陈桂华,朱艾斓. 2005a. 川西及其邻近地区活动构造基本特征与强震复发模型[J]. 地震地质,27(3):446–461. Xu X W,Zhang P Z,Wen X Z,Qin Z L,Chen G H,Zhu A L. 2005a. Features of active tectonics and recurrence behaviors of strong earthquakes in the western Sichuan Province and its adjacent regions[J]. Seismology and Geology,27(3):446–461 (in Chinese).
徐锡伟,闻学泽,于贵华,郑荣章,罗海原,郑斌. 2005b. 川西理塘断裂带平均滑动速率、地震破裂分段与复发特征[J]. 中国科学:D 辑,35(6):540–551. Xu X W,Wen X Z,Yu G H,Zheng R Z,Luo H Y,Zheng B. 2005b. Average slip rate,earthquake rupturing segmentation and recurrence behavior on the Litang fault zone,western Sichuan Province,China[J]. Science in China:Series D,35(6):540–551 (in Chinese).
徐锡伟, 韩竹军, 杨晓平, 张世民, 于贵华, 周本刚, 李峰, 马保起, 陈桂华, 冉勇康. 2015. 中国大陆及邻近地区地震构造图[M]. 北京: 地震出版社: 1−64. Xu X W, Han Z J, Yang X P, Zhang S M, Yu G H, Zhou B G, Li F, Ma B Q, Chen G H, Ran Y K. 2015. Seismic Structure Map of Mainland China and Adjacent Areas[M]. Beijing: Seismological Press: 1−64.
许忠淮,汪素云,黄雨蕊,高阿甲,金小锋,常向东. 1987. 由多个小震推断的青甘和川滇地区地壳应力场的方向特征[J]. 地球物理学报,30(5):476–486. doi: 10.3321/j.issn:0001-5733.1987.05.005 Xu Z H,Wang S Y,Huang Y R,Gao A J,Jin X F,Chang X D. 1987. Directions of mean stress axes in southwestern China deduced from microearthquake data[J]. Acta Geophysica Sinica,30(5):476–486 (in Chinese).
张广伟,雷建设,梁姗姗,孙长青. 2014. 2014 年 8 月 3 日云南鲁甸MS6.5 级地震序列重定位与震源机制研究[J]. 地球物理学报,57(9):3018–3027. Zhang G W,Lei J S,Liang S S,Sun C Q. 2014. Relocation and focal mechanism solutions of the 3 August 2014 Ludian,Yunnan MS6.5 earthquake sequence[J]. Chinese Journal of Geophysics,57(9):3018–3027 (in Chinese).
张家涛,张庆云. 1994. 石渠 5.1 级地震与德格 5.0 级地震灾害对比[J]. 高原地震,(3):63–69. Zhang J T,Zhang Q Y. 1994. Disaster contrast of M5.1 Shiqu and M5.0 Dege earthquakes[J]. Earthquake Research in Plateau,(3):63–69 (in Chinese).
张培震,邓起东,张国民,马瑾,甘卫军,闵伟,毛凤英,王琪. 2003. 中国大陆的强震活动与活动地块[J]. 中国科学:D 辑,33(增刊1):12–20. Zhang P Z,Deng Q D,Zhang G M,Ma J,Gan W J,Min W,Mao F Y,Wang Q. 2003. Active tectonic blocks and strong earthquakes in the continent of China[J]. Science in China:Series D,46(S1):13–24.
张勇,陈运泰,许力生,魏星,金明培,张森. 2015. 2014 年云南鲁甸 MW6.1 地震:一次共轭破裂地震[J]. 地球物理学报,58(1):153–162. doi: 10.6038/cjg20150113 Zhang Y,Chen Y T,Xu L S,Wei X,Jin M P,Zhang S. 2015. The 2014 MW6.1 Ludian,Yunnan,earthquake:A complex conjugated ruptured earthquake[J]. Chinese Journal of Geophysics,58(1):153–162 (in Chinese).
郑钰,杨建思. 2008. 双差算法的剖析及参数对定位的影响[J]. 地震地磁观测与研究,29(3):85–93. doi: 10.3969/j.issn.1003-3246.2008.03.016 Zheng Y,Yang J S. 2008. Analysis of double-difference algorithm and the affect of its parameter in location[J]. Seismological and Geomagnetic Observation and Research,29(3):85–93 (in Chinese).
朱艾斓,徐锡伟,周永胜,尹京苑,甘卫军,陈桂华. 2005. 川西地区小震重新定位及其活动构造意义[J]. 地球物理学报,48(3):629–636. doi: 10.3321/j.issn:0001-5733.2005.03.021 Zhu A L,Xu X W,Zhou Y S,Yi J Y,Gan W J,Chen G H. 2005. Relocation of small earthquakes in western Sichuan,China and its implications for active tectonics[J]. Chinese Journal of Geophysics,48(3):629–636 (in Chinese).
Angelier J. 1984. Tectonic analysis of fault slip data sets[J]. J Geophys Res:Solid Earth,89(B7):5835–5848. doi: 10.1029/JB089iB07p05835
Atkinson G M,Greig D W,Yenier E. 2014. Estimation of moment magnitude (M) for small events (M<4) on local networks[J]. Seismol Res Lett,85(5):1116–1124. doi: 10.1785/0220130180
Butcher A,Luckett R,Verdon J P,Verdon J P,Kendall J M,Baptie B,Wookey J. 2017. Local magnitude discrepancies for near‐event receivers:Implications for the UK traffic‐light scheme[J]. Bull Seismol Soc Am,107(2):532–541. doi: 10.1785/0120160225
Fukuyama E,Ellsworth W L,Waldhauser F,Kubo A. 2003. Detailed fault structure of the 2000 western Tottori,Japan,earthquake sequence[J]. Bull Seismol Soc Am,93(4):1468–1478. doi: 10.1785/0120020123
Hardebeck J L,Shearer P M. 2002. A new method for determining first-motion focal mechanisms[J]. Bull Seismol Soc Am,92(6):2264–2276. doi: 10.1785/0120010200
Heck S L,Young C J,Brogan R. 2022. Comparing traditional and deep learning signal features for event detection in the Utah region[J]. Bull Seismol Soc Am,112(5):2344–2363. doi: 10.1785/0120210275
Ji Y Q,Su S R,Liu Z H,Huang Q B. 2021. Assessment of tectonic activity based on the geomorphic indices in the middle reaches of the upstream of Jinsha River,China[J]. Geol J,56(8):3974–3991. doi: 10.1002/gj.4148
Laske G, Masters G, Ma Z T, Pasyanos M. 2013. Update on CRUST1.0: A 1-degree global model of Earth’s crust[C]. Geophys Res Abstr, 15(15): 2658.
Lei J S,Zhang G W,Xie F R,Li Y,Su Y J,Liu L F,Ma H H,Zhang J W. 2012. Relocation of the 10 March 2011 Yingjiang,China,earthquake sequence and its tectonic implications[J]. Earthq Sci,25(1):103–110. doi: 10.1007/s11589-012-0836-4
Liu M,Zhang M,Zhu W Q,Ellsworth W L,Li H. 2020. Rapid characterization of the July 2019 Ridgecrest,California,earthquake sequence from raw seismic data using machine‐learning phase picker[J]. Geophys Res Lett,47(4):e2019GL086189.
Luckett R,Ottemöller L,Butcher A,Baptie B. 2019. Extending local magnitude ML to short distances[J]. Geophys J Int,216(2):1145–1156. doi: 10.1093/gji/ggy484
Martínez‐Garzón P,Kwiatek G,Ickrath M,Bohnhoff M. 2014. MSATSI:A MATLAB package for stress inversion combining solid classic methodology,a new simplified user‐handling,and a visualization tool[J]. Seismol Res Lett,85(4):896–904. doi: 10.1785/0220130189
Park Y,Mousavi S M,Zhu W Q,Ellsworth W L,Beroza G C. 2020. Machine‐learning‐based analysis of the Guy‐Greenbrier,Arkansas earthquakes:A tale of two sequences[J]. Geophys Res Lett,47(6):e2020GL087032.
Ross Z E,Hauksson E,Ben-Zion Y. 2017. Abundant off-fault seismicity and orthogonal structures in the San Jacinto fault zone[J]. Sci Adv,3(3):e1601946. doi: 10.1126/sciadv.1601946
Rubin A M. 2002. Aftershocks of microearthquakes as probes of the mechanics of rupture[J]. J Geophys Res: Sol Ea, 107(B7): ESE 3-1−ESE 3-16.
Shen Z K,Lü J,Wang M,Bürgmann R. 2005. Contemporary crustal deformation around the southeast borderland of the Tibetan Plateau[J]. J Geophys Res:Solid Earth,110(B11):B11409.
Tözer B,Sandwell D T,Smith W H F,Olson C,Beale J R,Wessel P. 2019. Global bathymetry and topography at 15 arc sec:SRTM15+[J]. Earth Space Sci,6(10):1847–1864. doi: 10.1029/2019EA000658
Uchide T,Shiina T,Imanishi K. 2022. Stress map of Japan:Detailed nationwide crustal stress field inferred from focal mechanism solutions of numerous microearthquakes[J]. J Geophys Res:Solid Earth,127(6):e2022JB024036.
Waldhauser F. 2001. hypoDD: A Program to Compute Double-Difference Hypocenter Locations: US Geologic Survey Open File Report 01−113[R/OL]. [2022-10-20]. https://pubs.usgs.gov/of/2001/0113/.
Wang M,Shen Z K. 2020. Present‐day crustal deformation of continental China derived from GPS and its tectonic implications[J]. J Geophys Res:Solid Earth,125(2):e2019JB018774.
Ye T,Chen X,Huang Q H,Zhao L,Zhang Y,Uyeshima M. 2020. Bifurcated crustal channel flow and seismogenic structures of intraplate earthquakes in western Yunnan,China as revealed by three-dimensional magnetotelluric imaging[J]. J Geophys Res:Solid Earth,125(9):e2019JB018991.
Zhang M,Liu M,Feng T,Wang R J,Zhu W Q. 2022. LOC‐FLOW:An end‐to‐end machine learning‐based high‐precision earthquake location workflow[J]. Seismol Res Lett,93(5):2426–2438. doi: 10.1785/0220220019
Zhang X,Zhang M,Tian X. 2021. Real‐time earthquake early warning with deep learning:Application to the 2016 M6.0 Central Apennines,Italy earthquake[J]. Geophys Res Lett,48(5):2020GL089394.
Zhou Y J,Yue H,Fang L H,Zhou S Y,Zhao L,Ghosh A. 2022. An earthquake detection and location architecture for continuous seismograms:Phase picking,association,location,and matched filter (PALM)[J]. Seismol Res Lett,93(1):413–425.
Zhu W Q,Beroza G C. 2019. PhaseNet:A deep-neural-network-based seismic arrival-time picking method[J]. Geophys J Int,216(1):261–273.
Zoback M L. 1992. First- and second-order patterns of stress in the lithosphere:The World Stress Map Project[J]. J Geophys Res:Solid Earth,97(B8):11703–11728.

 下载:
下载:


计量
- 文章访问数: 339
- HTML全文浏览量: 127
- PDF下载量: 162
