

Regular deviations of response spectral accelerations based on strong-motion records from KiK-net
-
摘要:
地震动特性受到地震震源、地震波传播介质和局部场地条件等因素的综合影响,虽然地震动反应谱虽然具有统计意义上的共性,但其具体形状又各不相同,特别是部分加速度反应谱与统计平均值之间存在显著的规律性偏差。为了进一步探究加速度反应谱与统计平均值之间的规律性偏差,本文基于日本KiK-net台网获取的8万余条强震动记录,建立了考虑地震震级和震中距影响的地面峰值加速度归一化加速度反应谱,并以预测值+0.5倍方差为界将加速度反应谱分为有、无反应谱规律性偏差的两组。通过有反应谱规律性偏差的反应谱(观测值)与无反应谱规律性偏差的反应谱预测值之间的差值,析出了反应谱的规律性偏差,验证了反应谱规律性偏差的形状与高斯曲线高度吻合,并可用加速度反应谱规律性偏差曲线的中心周期、相对高度和相对宽度等参数进行表征。基于2万余条有反应谱规律性偏差记录的统计分析显示,加速度反应谱规律性偏差主要受控于剪切波速、覆盖层厚度等局部场地条件表征参数,受地震震级、震中距$ \mathrm{、} $地震动强度等参数的影响相对较小。基于此,利用多元线性回归建立了加速度反应谱规律性偏差表征参数的经验统计关系,并提出了有加速度反应谱规律性偏差的场地相关加速度反应谱的确定方法。虽有待改进,但本文提出的反应谱规律性偏差概念将有助于改进场地相关地震动反应谱的确定方法。
Abstract:The main factors that affect ground motion include the earthquake source, the medium and path of seismic wave propagation and the local site condition. Although the spectral accelerations of ground motion have common characteristics in statistical sense, the specific shape of each spectral acceleration is unique, and some spectral accelerations have significant regular deviations from the statistical mean values. These deviations often appear in the form of a single-peak superimposed on the average spectral accelerations, which might be related to the earthquake parameters, such as earthquake magnitude and epicenter distance, and the site parameters, such as shear wave velocity and overburden thickness, and strong motion intensity.
In this paper, based on 85 976 strong earthquake records obtained by Japanese KiK-net network, the statistical relationship of the spectral accelerations normalized by peak ground acceleration (PGA) with magnitude and epicenter distance was obtained. Using predicted value plus 0.5 time of variances as the separatrix, the acceleration records were divided into two categories, that is, the records with or without regular deviations of spectral accelerations. By calculating the differences between the spectral accelerations of records with regular deviations and the predicted spectral accelerations without regular deviations, the regular deviations of the spectral accelerations were separated out, and the shapes of the regular deviations were verified to be highly consistent with the Gaussian curve. The regular deviations of spectral accelerations could be characterized by the central period, the relative height and the relative width of the fitted Gaussian curves.
Based on the statistical analyses of 25 229 acceleration records with regular deviations of spectral accelerations obtained by Japanese KiK-net network, the correlations between the characteristic parameters of regular deviations and earthquake parameters, local site conditions, and ground motion intensity were discussed. The results indicated that:
1) The central periods of regular deviations in logarithmic coordinates slightly increased with earthquake magnitudes in linear coordinates, slightly increased with epicenter distances in logarithmic coordinates, significantly increased with overburden thickness with shear wave velocity up to 1 km/s, and significantly decreased with 30 m average shear wave velocity vS30, while their trend with strong motion intensity (i.e. PGA) was not obvious. It could be concluded that the central periods of regular deviations were mainly controlled by the local site conditions, and also affected by earthquake magnitudes and epicenter distances.
2) The relative heights of regular deviations in logarithmic coordinates significantly increased with vS30, and slightly increased with overburden thickness with shear wave velocity up to 1 km/s, while their trend with earthquake magnitude, epicenter distances or PGA was not obvious. It could be concluded that the relative heights of regular deviations were mainly determined by the local site conditions, while the influences of earthquake magnitude, epicenter distance, and strong motion intensity were not significant.
3) The relative widths of regular deviations in logarithmic coordinate significantly increased with vS30, and decreased with earthquake magnitude, epicenter distance, and overburden thickness with shear wave velocity up to 1 km/s, while the influences of strong motion intensity were not significant. It could be concluded that the relative widths of regular deviations were mainly influenced by the local site conditions and earthquake parameters.
Selecting average shear wave velocity, overburden thickness, earthquake magnitude, and epicenter distance as independent variables, empirical statistical relationships to predict the parameters of the regular deviations of spectral accelerations, including the central period, the relative height and the relative width, were given by the multiple linear regression methods, which could lead to the following prediction procedure of spectral accelerations considering regular deviations:
1) Considering the influence of earthquake magnitudes, epicenter distances and local site conditions, determine the site related spectral accelerations without regular deviations by the attenuation relationships (ground motion prediction equations) for spectral acceleration.
2) Considering the influence of average shear wave velocity, overburden thickness, earthquake magnitude, and epicenter distance, determine the central period, the relative height and the relative width of regular deviations by the empirical statistical relationships given in this paper.
3) Determine the regular deviation curve of spectral accelerations by the Gaussian function using independent variables including the central period, the relative height and the relative width.
4) Superimpose the regular deviation curves of spectral accelerations on the site-related spectral accelerations without regular deviations, and then obtain the site-related spectral accelerations with regular deviations.
The comparison between the observed spectral accelerations and their predicted values of typical acceleration records with regular deviations showed that the proposed procedure gave a more accurate prediction of spectral accelerations, which could reflect the unique single-peak regular deviations from the statistical mean values of spectral accelerations. Even though, further research was needed on how to determine the criteria for discriminating the strong motion records with/without regular deviations of spectral accelerations based on the parameters of earthquake, local site condition and strong motion field.
-
Keywords:
- ground motion /
- spectral acceleration /
- local site condition /
- strong-motion record /
- KiK-net
-
引言
地震动特性研究主要有两类方法:基于强震动记录统计的直接方法和基于数值模拟的间接方法。基于波动理论的数值模拟方法已经被广泛地运用于强震动观测数据缺乏的地区,为工程抗震设计地震动参数的确定提供了强有力的支撑。但由于地震波传播介质的复杂性,数值分析方法给出的场地相关的地震动参数与强震动观测数据之间还存在较大差异。近年来,随着大量的高质量强震动观测数据的积累,基于强震动记录统计的地震动特性研究得到了快速发展。
基于区域或全球强震动记录,科研人员开展了地震动加速度反应谱特性及其影响因素的统计研究,所采用的表征参数包括加速度反应谱的谱型(Chopra,Choudhury,2011;李英成,张艳娟,2018)、放大系数(周雍年,1984;薄景山等,2004;王玉石等,2020a,b)、最大值(耿淑伟,2005;耿淑伟,席远,2010;郭峰等,2011)、平台值(李小军,彭青,2001;周正华等,2002;李平,2010;郭晓云等,2012;赵万松,耿淑伟,2016)、特征周期(薄景山等,2003;马宁等,2008;荣棉水等,2009;郭明珠等,2016)等,并取得了一些对工程实践有指导意义的研究成果。但相关工作主要关注的是地震动特性表征参数的平均值,并未进行详细的规律性偏差统计分析。
强震动记录分析结果显示,相当数量记录的加速度反应谱谱型与反应谱平均谱型之间存在显著的偏差(冀昆等,2014;宋晋东等,2017;王维欢等,2021),这些偏差多以单峰的形式出现,但其高度、宽度及其出现的位置(对应的周期值)不尽相同。
鉴于此,本文拟基于日本KiK-net台网获得的强震动记录统计分析加速度反应谱的平均谱型,分别析出每条加速度反应谱的规律性偏差,并探讨此规律性偏差与震级、震中距、地震动强度、剪切波速、覆盖层厚度等影响因素之间的相关性,以期在工程抗震设计中予以考虑,得到更加合理的场地相关地震动输入。
1. 强震动记录选取
日本KiK-net强震动观测台网共697个测点(位置见图1),每个测点均为竖向台阵观测,包含一组分别布设在地表和钻孔底部的三分量高精度加速度传感器。自1996年6月以来,KiK-net台网积累了大量的高质量强震动观测数据。本文统计选用地震震级MW≥3.0且地面峰值加速度(peak ground acceleration,缩写为PGA)≥5 cm/s2的水平向加速度记录,共计 8万5 976条,其震级、震中距及PGA的分布情况见图2。可以看出,不同震级区段均有较为丰富的记录,震中距50—300 km范围内的记录相对较多,PGA>300 cm/s2的记录仍然较少。
![]() 图 1 所选取记录对应观测台阵的空间分布Figure 1. The spatial distribution of the observation array corresponding to selected records
图 1 所选取记录对应观测台阵的空间分布Figure 1. The spatial distribution of the observation array corresponding to selected records![]() 图 2 所选取记录的峰值加速度PGA随震级M、震中距的分布Figure 2. Distribution of the PGAs with earthquake magnitude M and epicentral distance for the selected records
图 2 所选取记录的峰值加速度PGA随震级M、震中距的分布Figure 2. Distribution of the PGAs with earthquake magnitude M and epicentral distance for the selected records2. 反应谱规律性偏差记录的识别
为了研究反应谱规律性偏差,采用以下步骤,将收集到的8万5 976条水平向加速度记录分选为两组:具有反应谱规律性偏差的记录和不具有反应谱规律性偏差的记录。
首先计算各条水平向加速度记录的加速度反应谱Sa (阻尼比为5%,下文同),而后对每一个加速度反应谱值除以峰值加速度PGA,得到PGA归一化加速度反应谱。考虑地震震级和震中距两个因素的影响,利用二元线性回归得到所有记录的PGA归一化加速度反应谱经验统计关系:
$$ \mathrm{l}\mathrm{g}\frac{S_{ \mathrm{a}}}{{\mathrm{PGA}}}={a}_{0} + {a}_{1}{M}_{{\mathrm{W}}} + {a}_{2}\mathrm{l}\mathrm{g}R+ \sigma , $$ (1) 式中:MW为矩震级;R为震中距,单位为km;a0,a1和a2为回归系数;σ为标准差。统计得到PGA和周期0.02—10 s内104个周期点反应谱的回归系数值,其中77个代表性周期点的数值详见表1。
表 1 所有记录的PGA归一化加速度反应谱(阻尼比5%)的回归系数Table 1. Regression coefficients of PGA normalized spectral acceleration (damping ratio is 0.05) for all recordsT/s a0 a1 a2 σ T/s a0 a1 a2 σ PGA 0.008 1 0 −0.000 2 0.002 6 0.240 −0.784 9 0.155 5 0.048 3 0.313 2 0.020 0.022 4 0 −0.005 3 0.011 2 0.250 −0.850 3 0.166 0 0.041 2 0.316 8 0.022 0.039 7 −0.001 3 −0.007 9 0.014 3 0.260 −0.911 1 0.175 6 0.033 8 0.319 1 0.025 0.072 8 −0.003 6 −0.013 9 0.023 8 0.280 −1.028 5 0.193 9 0.020 7 0.323 0 0.029 0.142 0 −0.008 1 −0.028 1 0.047 3 0.290 −1.083 3 0.202 0 0.015 5 0.325 4 0.030 0.163 2 −0.009 4 −0.032 3 0.054 3 0.300 −1.135 3 0.210 0 0.009 1 0.328 3 0.032 0.205 6 −0.011 9 −0.040 9 0.067 3 0.320 −1.237 4 0.226 5 −0.005 7 0.332 6 0.035 0.266 8 −0.016 0 −0.051 5 0.083 2 0.340 −1.341 6 0.242 7 −0.018 4 0.335 6 0.036 0.285 5 −0.017 4 −0.054 1 0.087 2 0.350 −1.391 0 0.250 0 −0.023 6 0.337 4 0.040 0.350 8 −0.022 8 −0.060 7 0.100 1 0.360 −1.438 7 0.256 7 −0.027 8 0.339 1 0.042 0.378 7 −0.025 2 −0.062 1 0.105 7 0.380 −1.530 5 0.269 5 −0.035 6 0.341 6 0.044 0.405 3 −0.027 5 −0.062 9 0.111 2 0.400 −1.619 9 0.282 0 −0.043 7 0.342 4 0.045 0.418 1 −0.028 7 −0.062 9 0.113 9 0.420 −1.707 0 0.294 0 −0.051 0 0.341 7 0.046 0.430 3 −0.029 8 −0.062 7 0.116 8 0.440 −1.787 2 0.305 2 −0.058 8 0.340 9 0.048 0.454 5 −0.032 0 −0.062 4 0.122 8 0.450 −1.824 9 0.310 6 −0.063 0 0.340 7 0.050 0.478 7 −0.034 2 −0.061 9 0.129 0 0.460 −1.861 6 0.315 9 −0.067 5 0.340 6 0.055 0.537 1 −0.039 6 −0.058 7 0.144 7 0.480 −1.931 4 0.326 0 −0.076 2 0.340 5 0.060 0.586 9 −0.044 0 −0.052 2 0.160 0 0.500 −1.998 4 0.335 4 −0.083 9 0.340 6 0.065 0.617 4 −0.046 1 −0.043 5 0.170 0 0.550 −2.153 9 0.355 4 −0.097 4 0.340 1 0.067 0.623 9 −0.046 5 −0.038 6 0.171 9 0.600 −2.294 5 0.373 0 −0.108 6 0.341 9 0.070 0.631 3 −0.047 3 −0.030 6 0.172 4 0.650 −2.417 6 0.388 8 −0.120 1 0.345 3 0.075 0.633 9 −0.048 0 −0.016 0 0.170 1 0.667 −2.456 4 0.393 6 −0.123 5 0.346 3 0.080 0.624 5 −0.045 6 −0.006 9 0.165 6 0.700 −2.530 9 0.402 6 −0.129 1 0.347 8 0.085 0.600 8 −0.040 2 −0.002 2 0.161 0 0.750 −2.640 2 0.415 2 −0.135 2 0.349 1 0.090 0.566 3 −0.033 9 0.003 1 0.160 8 0.800 −2.740 6 0.426 7 −0.141 3 0.350 8 0.095 0.526 5 −0.027 3 0.008 7 0.162 6 0.850 −2.832 7 0.437 4 −0.147 8 0.351 6 0.100 0.480 7 −0.020 9 0.016 4 0.164 7 0.900 −2.920 0 0.446 7 −0.152 2 0.351 5 0.110 0.382 4 −0.008 0 0.032 1 0.172 7 0.950 −3.001 9 0.455 1 −0.155 7 0.350 8 0.120 0.275 0 0.005 5 0.047 9 0.184 7 1.000 −3.078 0 0.463 0 −0.159 8 0.350 0 0.130 0.172 1 0.018 1 0.061 3 0.203 0 2.000 −3.982 5 0.544 2 −0.218 7 0.343 4 0.133 0.141 9 0.021 9 0.064 5 0.208 8 3.000 −4.403 5 0.576 4 −0.270 8 0.348 8 0.140 0.069 9 0.031 1 0.070 8 0.221 3 4.000 −4.663 1 0.589 5 −0.305 4 0.353 4 0.150 −0.035 4 0.045 3 0.076 0 0.236 4 5.000 −4.846 1 0.592 9 −0.325 6 0.357 0 0.160 −0.136 9 0.060 1 0.076 3 0.248 4 6.000 −4.989 1 0.592 1 −0.336 6 0.359 0 0.170 −0.233 3 0.074 2 0.075 7 0.259 0 7.000 −5.102 2 0.587 7 −0.340 0 0.360 3 0.180 −0.322 8 0.086 7 0.075 0 0.269 5 8.000 −5.194 7 0.580 9 −0.338 2 0.361 1 0.190 −0.407 7 0.098 4 0.073 7 0.280 0 9.000 −5.280 3 0.575 3 −0.335 0 0.361 5 0.200 −0.491 8 0.110 1 0.071 8 0.289 9 10.000 −5.357 1 0.570 7 −0.332 7 0.361 7 0.220 −0.645 9 0.133 4 0.061 8 0.303 7 注:a0,a1和a2为文中式(1)的回归系数,σ为标准差。 分别计算各条PGA归一化加速度反应谱与式(1)所给出的PGA归一化加速度反应谱预测值之间的偏差。若此偏差的最大值大于+0.5倍的方差,则认为此条加速度反应谱具有规律性偏差,对应的强震动记录为有反应谱规律性偏差记录;否则,则认为此条加速度反应谱无规律性偏差,对应的强震动记录为无反应谱规律性偏差记录。据此得到无反应谱规律性偏差记录6万零747条,有反应谱规律性偏差记录2万5 229条。
3. 反应谱规律性偏差表征参数
基于6万零747条无反应谱规律性偏差记录,以地震震级和震中距为自变量,仍然采用式(1)来统计回归无反应谱规律性偏差记录的PGA归一化加速度反应谱经验统计关系,得到PGA和周期0.02—10 s内104个周期点反应谱的回归系数值,其中77个代表性周期点的数值详见表2。
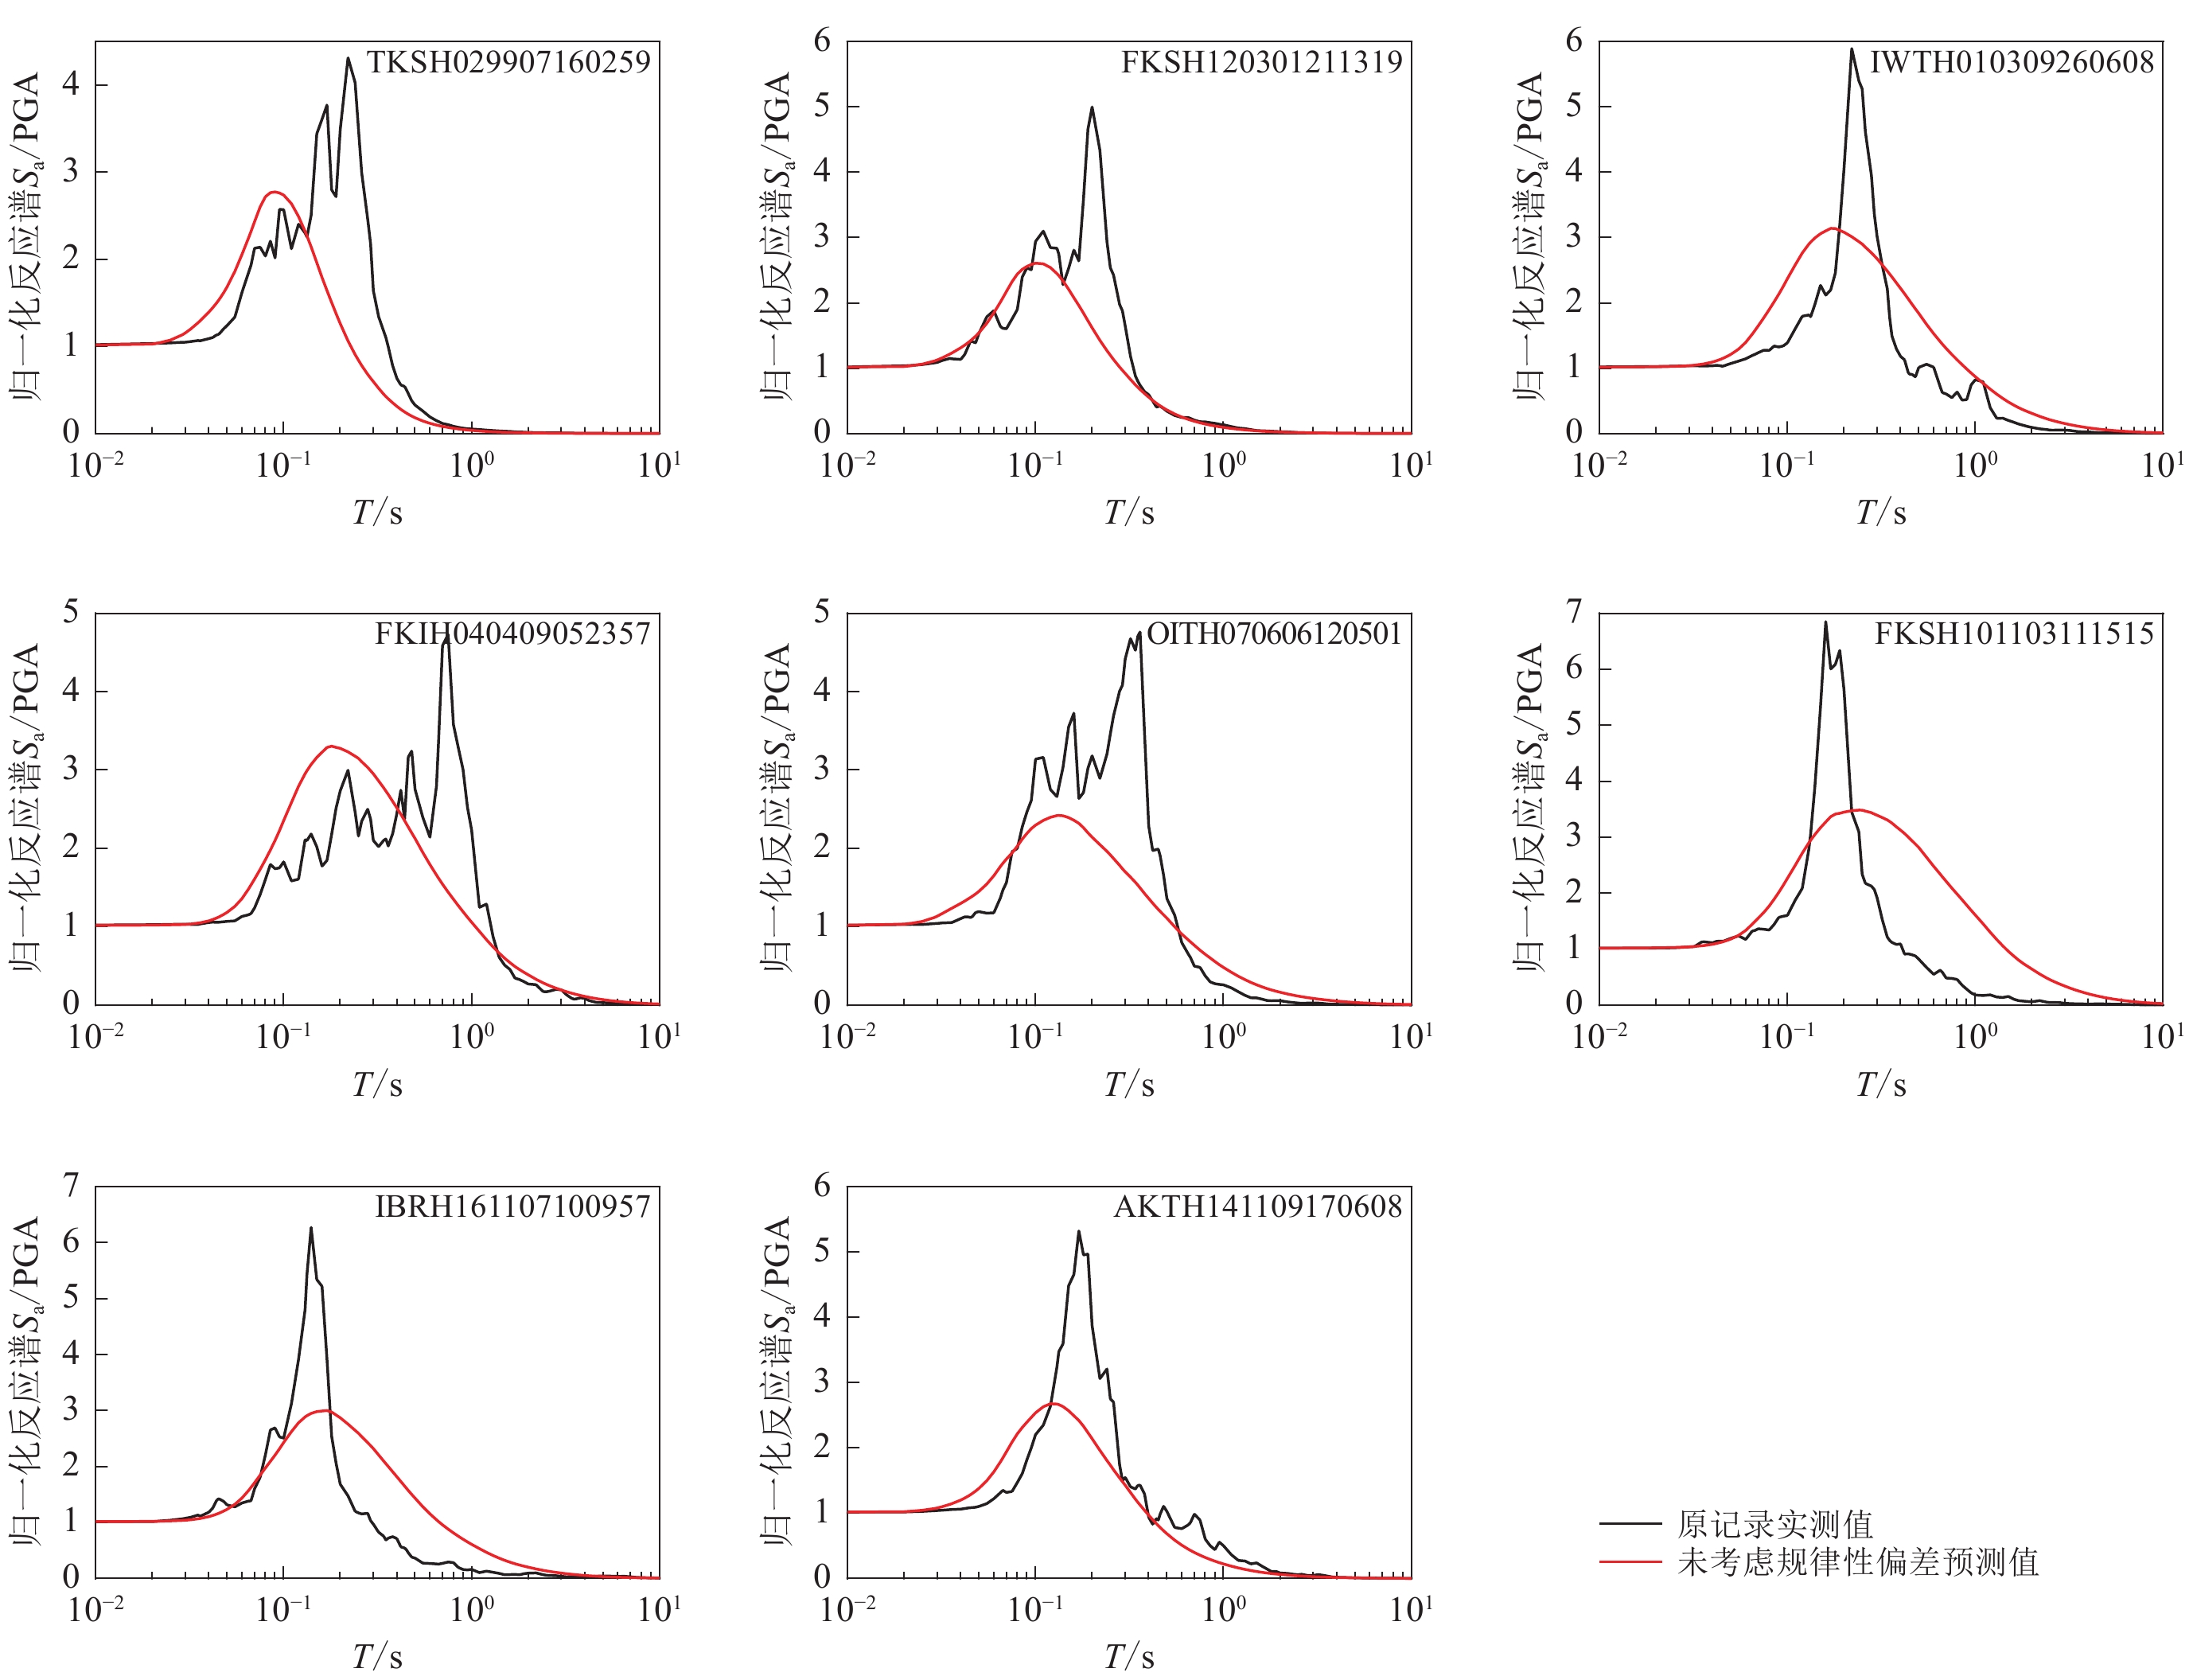
表 2 无反应谱规律性偏差记录的PGA归一化加速度反应谱(阻尼比5%)回归系数Table 2. Regression coefficients of PGA normalized acceleration response spectrum (damping ratio is 0.05) for records without the regular deviations of spectral accelerationT/s a0 a1 a2 σ T/s a0 a1 a2 σ PGA 0.008 2 −0.000 1 −0.000 1 0.003 0 0.240 −0.775 4 0.160 5 0.029 8 0.285 5 0.020 0.021 9 −0.000 1 −0.004 8 0.011 2 0.250 −0.839 2 0.169 7 0.026 3 0.290 5 0.022 0.039 5 −0.001 7 −0.006 8 0.014 2 0.260 −0.899 2 0.178 3 0.021 9 0.294 5 0.025 0.072 7 −0.004 4 −0.011 8 0.023 6 0.280 −1.014 5 0.194 7 0.014 8 0.302 1 0.029 0.142 6 −0.009 5 −0.023 9 0.047 3 0.290 −1.068 3 0.201 9 0.012 2 0.306 1 0.030 0.164 2 −0.011 2 −0.027 3 0.054 4 0.300 −1.120 0 0.209 2 0.008 5 0.310 4 0.032 0.207 5 −0.014 4 −0.034 3 0.067 6 0.320 −1.221 5 0.225 0 −0.003 8 0.316 8 0.035 0.269 1 −0.019 4 −0.042 1 0.083 7 0.340 −1.325 2 0.240 8 −0.015 1 0.321 3 0.036 0.288 0 −0.021 1 −0.043 8 0.087 8 0.350 −1.374 7 0.247 9 −0.019 6 0.323 4 0.040 0.352 6 −0.027 3 −0.047 3 0.100 6 0.360 −1.422 8 0.254 6 −0.023 1 0.325 6 0.042 0.379 4 −0.029 9 −0.047 2 0.105 6 0.380 −1.515 5 0.267 1 −0.029 6 0.328 8 0.044 0.404 8 −0.032 5 −0.046 5 0.110 3 0.400 −1.606 6 0.280 0 −0.037 4 0.330 1 0.045 0.417 1 −0.033 9 −0.045 8 0.112 6 0.420 −1.696 3 0.292 5 −0.045 0 0.329 8 0.046 0.428 7 −0.035 2 −0.044 6 0.114 9 0.440 −1.778 4 0.304 2 −0.053 3 0.329 5 0.048 0.452 2 −0.037 8 −0.042 5 0.119 9 0.450 −1.816 9 0.309 8 −0.057 8 0.329 5 0.050 0.476 1 −0.040 4 −0.040 4 0.125 2 0.460 −1.854 5 0.315 3 −0.062 2 0.329 6 0.055 0.532 0 −0.046 3 −0.034 0 0.137 3 0.480 −1.926 9 0.325 9 −0.071 1 0.330 1 0.060 0.578 1 −0.050 6 −0.026 4 0.147 1 0.500 −1.996 0 0.335 8 −0.079 1 0.330 7 0.065 0.605 5 −0.052 1 −0.017 9 0.152 5 0.550 −2.154 2 0.356 7 −0.093 9 0.331 4 0.067 0.611 9 −0.052 6 −0.012 8 0.153 4 0.600 −2.296 1 0.374 6 −0.105 5 0.334 2 0.070 0.620 6 −0.053 8 −0.004 3 0.153 5 0.650 −2.419 8 0.390 8 −0.118 1 0.338 2 0.075 0.627 0 −0.055 2 0.010 4 0.151 7 0.667 −2.459 3 0.395 8 −0.121 7 0.339 3 0.080 0.621 4 −0.053 0 0.018 2 0.148 2 0.700 −2.535 3 0.405 1 −0.127 6 0.341 1 0.085 0.599 8 −0.047 1 0.020 4 0.145 1 0.750 −2.645 3 0.417 8 −0.133 5 0.342 9 0.090 0.565 1 −0.040 1 0.023 7 0.145 5 0.800 −2.746 7 0.429 7 −0.140 0 0.344 7 0.095 0.523 0 −0.032 6 0.028 2 0.148 3 0.850 −2.840 3 0.440 5 −0.146 2 0.345 8 0.100 0.473 9 −0.025 2 0.035 2 0.151 9 0.900 −2.930 3 0.450 1 −0.149 5 0.345 7 0.110 0.370 9 −0.009 7 0.046 3 0.160 6 0.950 −3.014 6 0.458 8 −0.152 6 0.345 2 0.120 0.261 5 0.007 0 0.053 7 0.171 5 1.000 −3.092 6 0.467 0 −0.156 3 0.344 6 0.130 0.158 2 0.023 3 0.055 6 0.186 2 2.000 −4.002 4 0.547 8 −0.210 5 0.340 5 0.133 0.128 2 0.028 0 0.055 9 0.190 7 3.000 −4.430 1 0.581 0 −0.260 9 0.346 7 0.140 0.057 7 0.038 9 0.056 0 0.199 9 4.000 −4.697 6 0.596 0 −0.295 5 0.352 1 0.150 −0.045 0 0.054 4 0.055 7 0.211 0 5.000 −4.886 8 0.600 8 −0.315 6 0.356 3 0.160 −0.145 3 0.069 3 0.054 6 0.221 6 6.000 −5.033 3 0.601 2 −0.327 5 0.358 4 0.170 −0.242 0 0.083 2 0.054 7 0.232 5 7.000 −5.148 0 0.597 2 −0.331 3 0.359 8 0.180 −0.330 5 0.095 5 0.054 2 0.243 0 8.000 −5.241 4 0.591 0 −0.330 3 0.360 7 0.190 −0.412 4 0.106 7 0.052 5 0.252 5 9.000 −5.327 9 0.585 8 −0.327 6 0.361 2 0.200 −0.493 3 0.118 2 0.049 7 0.261 2 10.000 −5.404 8 0.581 3 −0.325 7 0.361 6 0.220 −0.641 5 0.140 4 0.039 9 0.274 1 注:a0,a1和a2为文中式(1)的回归系数,σ为标准差。 图3给出了八条有规律性偏差记录的PGA归一化反应谱与未考虑规律性偏差记录的反应谱预测值之间的对比,其中黑色曲线为强震动记录对应加速度反应谱除以PGA后得到的PGA归一化反应谱,红色曲线为根据记录对应的地震震级、震中距和式(1)、表2共同给出的归一化加速度反应谱预测值(未考虑规律性偏差)。可以看出:未考虑规律性偏差的归一化加速度反应谱预测值(红色实线)其实仍然存在一个反应谱宽峰,但这个峰的幅值较小且宽度较大;有规律性偏差归一化加速度反应谱(黑色实线)可以认为是在无规律性偏差加速度反应谱预测值的基础上,再叠加一个宽度较小但幅值较大的窄峰,两者间存在显著的差异。图3中的八条典型的有规律性偏差记录是随机挑选的,对应台站的震级、震中距、30 m平均剪切波速vS30和剪切波速至1 km/s的覆盖岩土层厚度Z1如表3所示,其它有规律性偏差记录亦呈现出高度相似的规律性。
![]() 图 3 有反应谱规律性偏差记录的加速度反应谱预测值(未考虑规律性偏差)Figure 3. Predicted values of the spectral accelerations without considering the regular deviations for records with regular deviations表 3 所选取记录的地震参数及场地条件参数Table 3. Earthquakes parameters and site conditions parameters for the selected records
图 3 有反应谱规律性偏差记录的加速度反应谱预测值(未考虑规律性偏差)Figure 3. Predicted values of the spectral accelerations without considering the regular deviations for records with regular deviations表 3 所选取记录的地震参数及场地条件参数Table 3. Earthquakes parameters and site conditions parameters for the selected records记录编号 MW 震中距
R/kmvS30
/(m·s−1)覆盖层
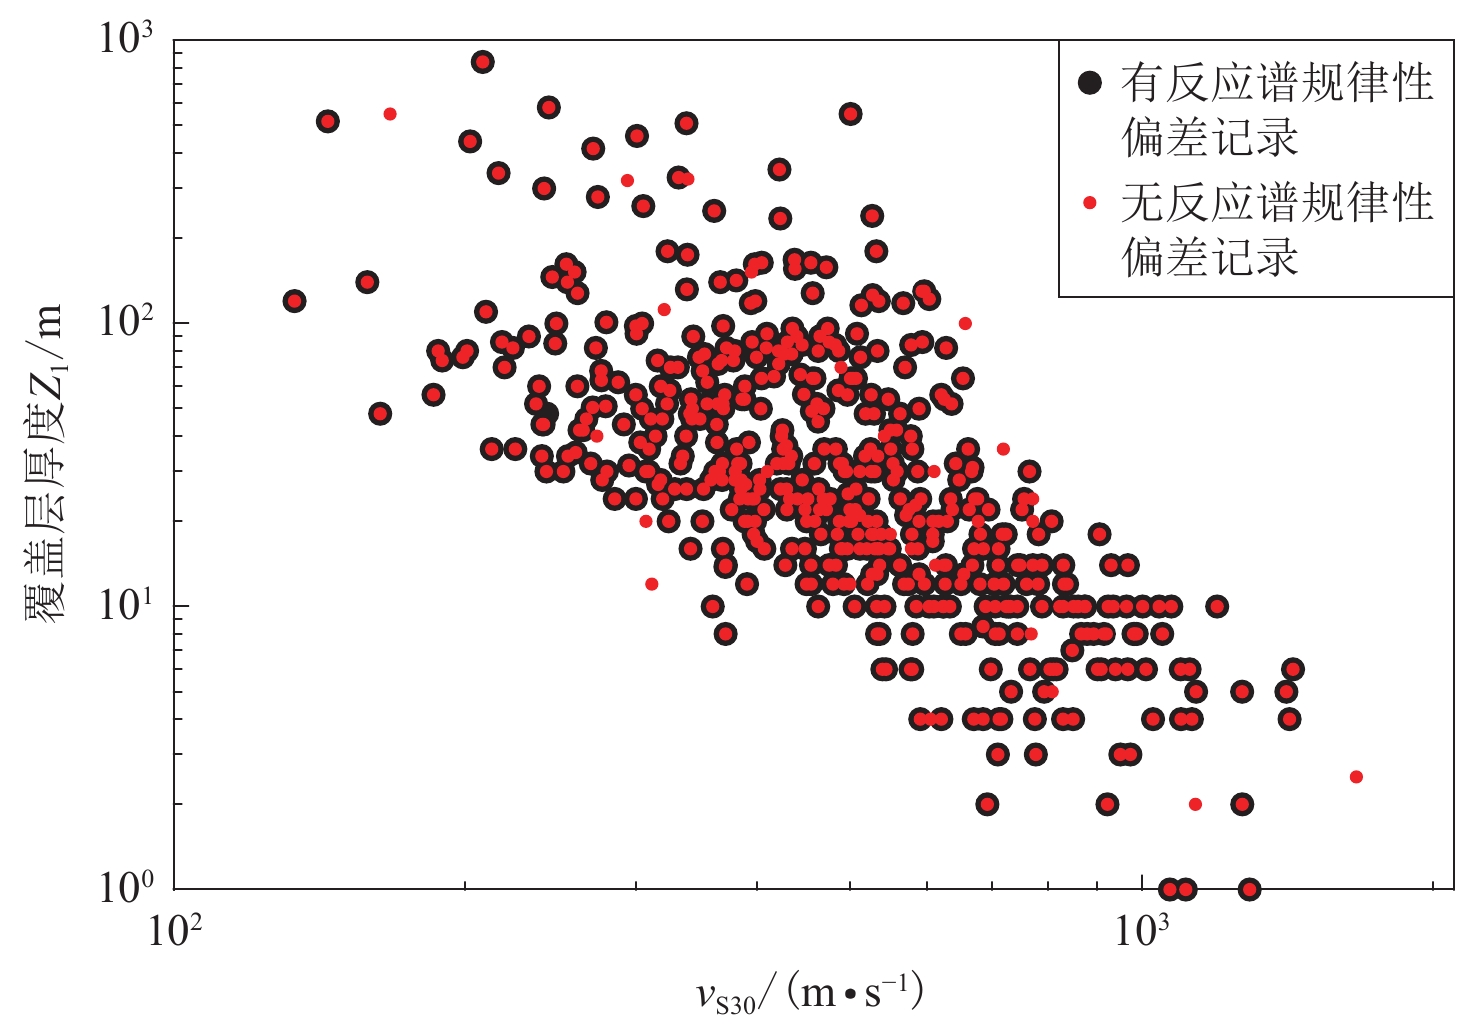
厚度Z1/mTKSH029 907 160 259 4.2 94 349 46 FKSH120 301 211 319 5.1 103 449 22 IWTH010 309 260 608 7.3 257 438 156 FKIH040 409 052 357 7.5 292 300 98 OITH070 606 120 501 6.4 23 276 63 FKSH101 103 111 515 7.8 157 487 32 IBRH161 107 100 957 7.0 316 626 12 AKTH141 109 170 608 6.0 206 233 90 图4给出了有、无反应谱规律性偏差记录对应的强震动台站场地vS30和剪切波速至1 km/s的覆盖岩土层厚度Z1的分布图,可以看出,除有限几个离散点外,其它的有、无反应谱规律性偏差记录的离散点重合,即对于绝大多数台站,部分强震动记录有反应谱规律性偏差,部分强震动记录无反应谱规律性偏差,这说明反应谱规律性偏差的出现不仅仅与场地条件有关,还与基岩地震动有关。因此推测无规律性偏差加速度反应谱的形状主要是由震源谱及衰减规律所决定,有规律性偏差加速度反应谱叠加的窄峰可能是由基岩谱与局部场地条件影响的“共振”所产生。即使软弱厚覆盖层场地上的台站亦有强震动记录未呈现出清晰的反应谱规律性偏差,这可能由基岩谱与局部场地条件影响未产生“共振”所致,从而也在一定程度上表明,此时软弱覆盖层引起的地震动放大效应并不明显。因此,在利用式(1)统计获得表2中无反应谱规律性偏差记录的PGA归一化加速度反应谱回归系数时,未考虑场地条件影响项。这些推测仍需进一步验证。
![]() 图 4 有、无反应谱规律性偏差记录对应的强震动台站场地vS30和覆盖层厚度Z1分布图Figure 4. Distribution of vS30 and overburden thickness Z1 on the sites of strong motion stations for the records with/without regular deviation of spectral acceleration
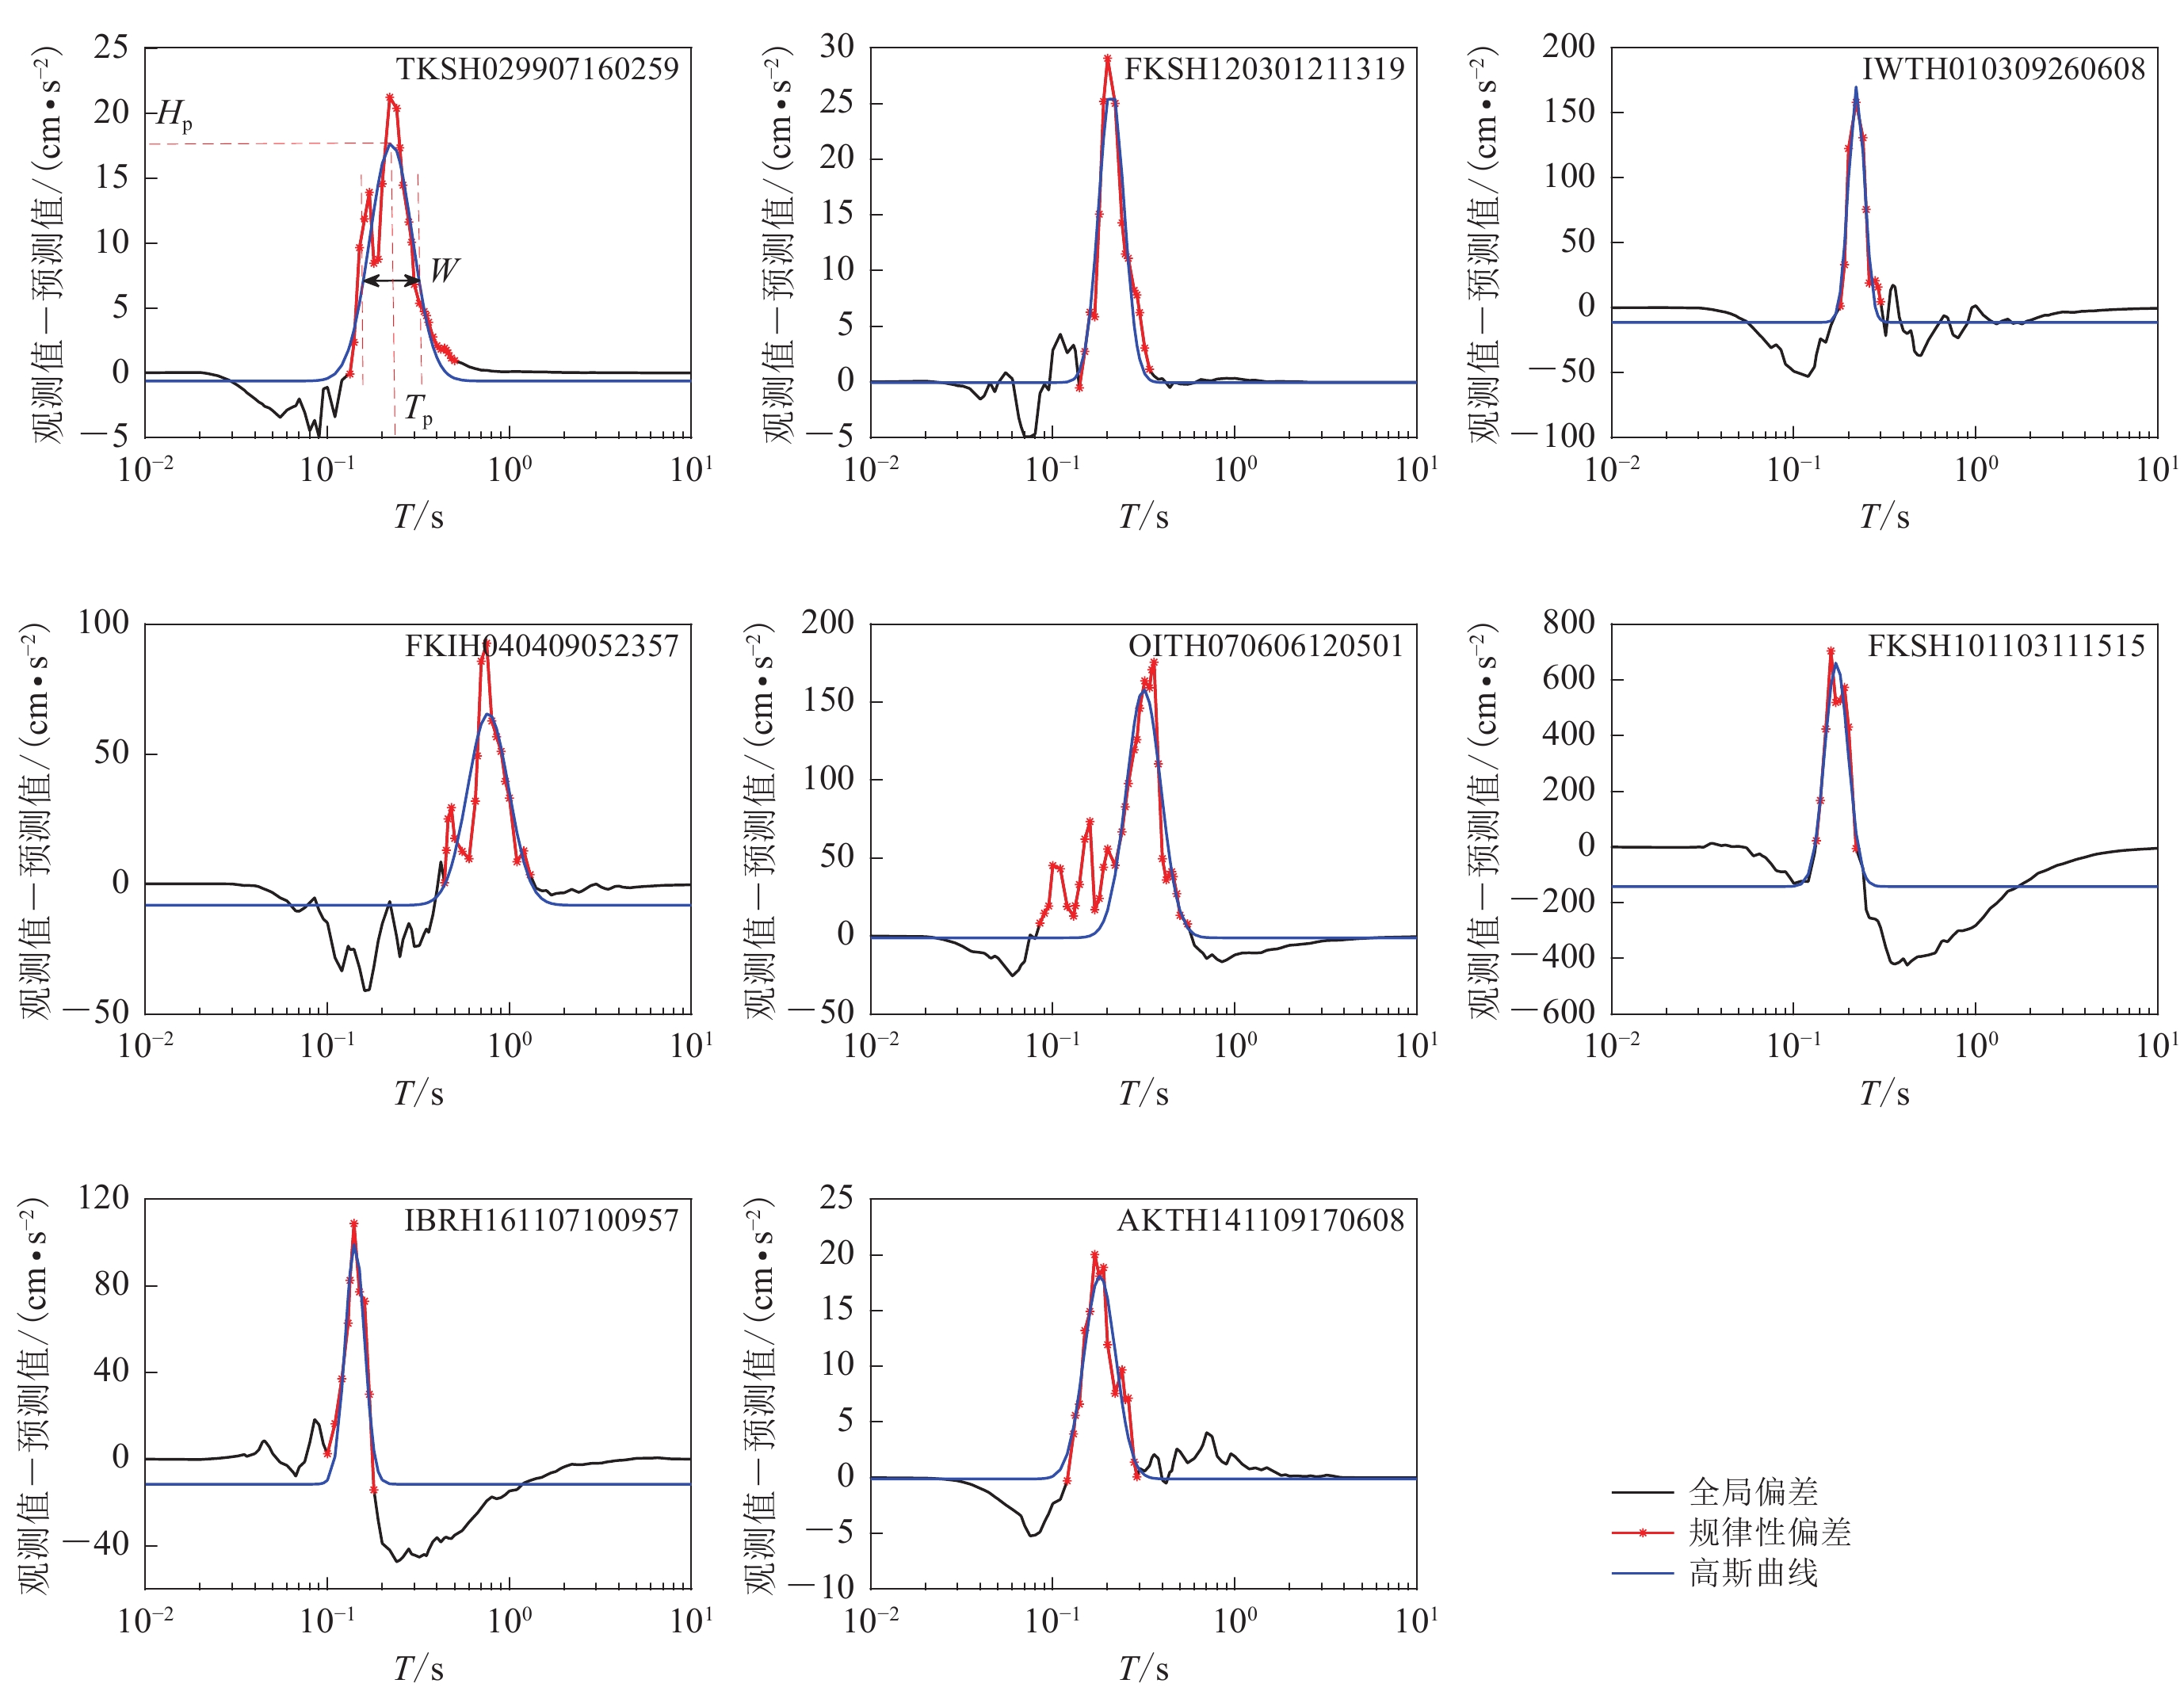
图 4 有、无反应谱规律性偏差记录对应的强震动台站场地vS30和覆盖层厚度Z1分布图Figure 4. Distribution of vS30 and overburden thickness Z1 on the sites of strong motion stations for the records with/without regular deviation of spectral acceleration为探究反应谱规律性偏差的特征,需要对反应谱规律性偏差进行分离并确定其表征参数。针对本文分选出的每一条有反应谱规律性偏差的记录,分别计算加速度反应谱与式(1)和表2给出的加速度反应谱预测值之间的差值,部分算例结果如图5所示。可以看出,差值数据曲线中存在一个清晰的反应谱偏差窄峰,截取窄峰峰值点左右至最靠近零线的谱值点,可以得到反应谱规律性偏差窄峰,如图中红色星实线所示。
![]() 图 5 典型记录加速度反应谱规律性偏差的分离Figure 5. Separation of the regular deviations from typical spectral acceleration
图 5 典型记录加速度反应谱规律性偏差的分离Figure 5. Separation of the regular deviations from typical spectral acceleration从图5中可以看出,反应谱规律性偏差窄峰出现的位置、幅值和宽度均不相同,且形状也存在差异。通过观察,发现反应谱规律性偏差窄峰的形状与高斯曲线相近,因此,利用高斯曲线对各反应谱规律性偏差窄峰进行拟合:
$$\begin{split} \\ y ( T ) ={H}_{{\mathrm{p}}} \mathrm{exp}\left[-{\left(\frac{T-{T}_{{\mathrm{p}}}}{W}\right)}^{2}\right] + \varepsilon \text{,} \end{split}$$ (1) 式中,y为加速度反应谱拟合值,T为周期,Hp为反应谱规律性偏差窄峰的高度,Tp为反应谱规律性偏差的中心周期(窄峰中心点所对应的周期),W为反应谱规律性偏差窄峰的宽度,ε为反应谱规律性偏差相对于横坐标的位置(接近0)。
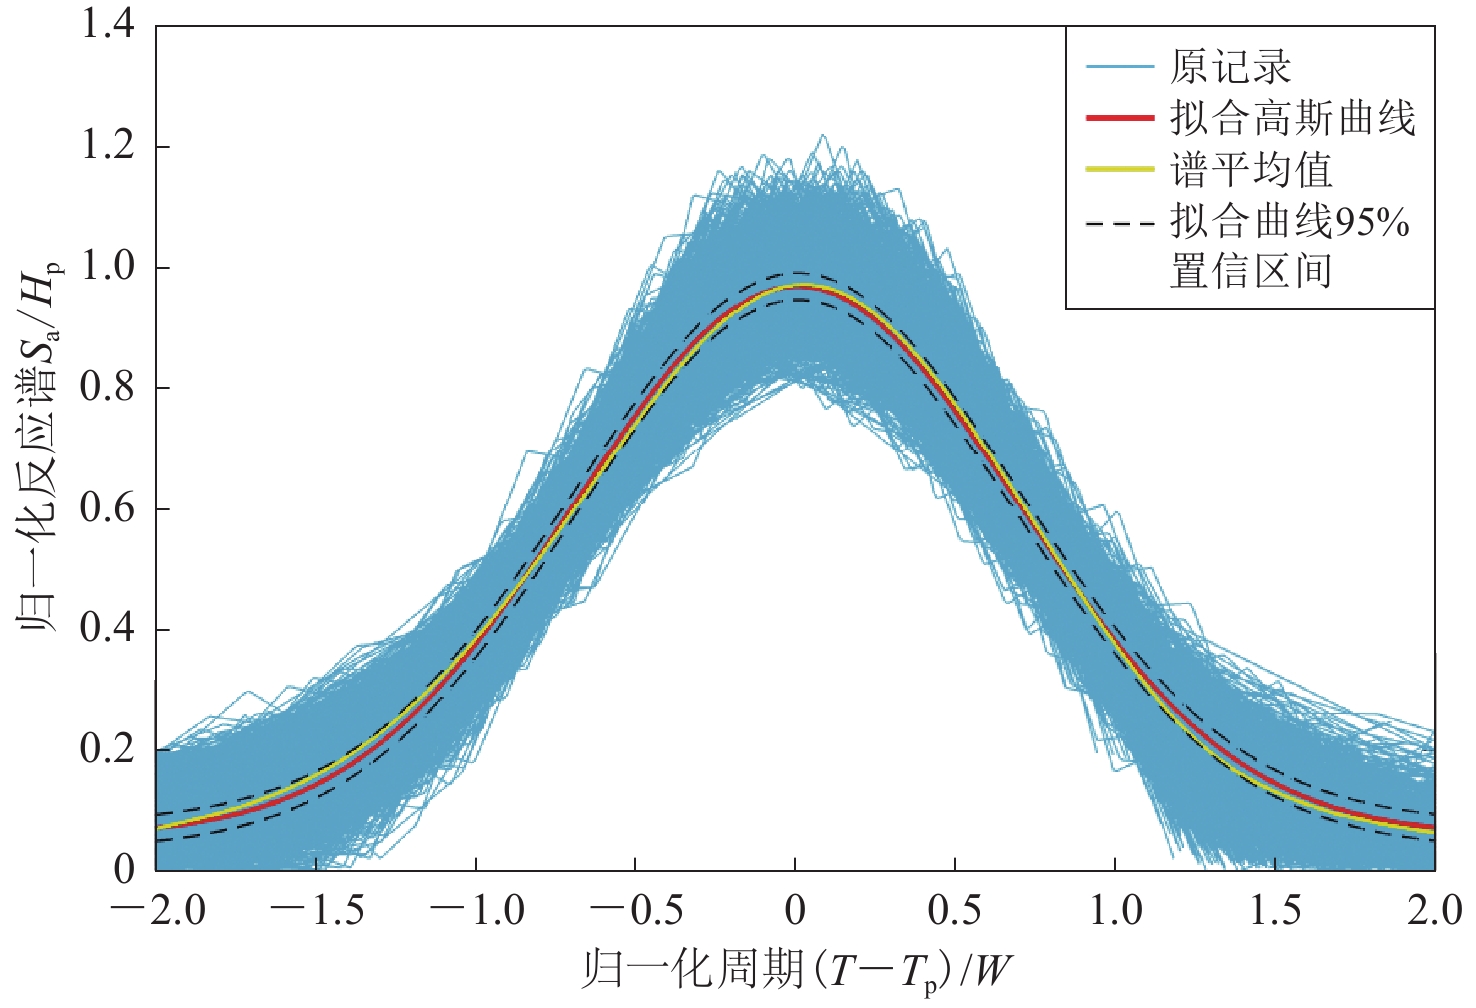
图6给出了各反应谱规律性偏差的窄峰经式(2)归一化后的形状,其中各参数的定义与式(2)相同,横坐标为归一化后的周期(T-Tp)/W,纵坐标为归一化后的反应谱谱值Sa /Hp,其过程等效为:将每条强震动记录对应的单对数坐标下的反应谱规律性偏差窄峰沿横坐标向左平移至窄峰中心点的横坐标为0 处(向左平移距离为Tp),然后保持窄峰中心点横坐标不变,将窄峰的宽度缩放至原窄峰宽度的1/W,高度缩放至原窄峰高度的1/Hp。从图6中可以看出,各反应谱规律性偏差窄峰(蓝色折线)的形状虽然存在一定的离散性,但其变化规律及平均值(绿色曲线)与高斯曲线(红色实线)高度吻合。反应谱规律性偏差的窄峰平均值位于高斯曲线拟合值的95%置信区间内,统计拟合优度R2=0.999 7。因此,后续分析中均采用高斯曲线进行反应谱规律性偏差的拟合,以获得反应谱规律性偏差的中心周期Tp、反应谱规律性偏差窄峰的高度Hp、宽度W等反应谱规律性偏差表征参数。
![]() 图 6 加速度反应谱规律性偏差及拟合高斯曲线Figure 6. Regular deviations of spectral accelerations and their fitting Gaussian curve
图 6 加速度反应谱规律性偏差及拟合高斯曲线Figure 6. Regular deviations of spectral accelerations and their fitting Gaussian curve4. 反应谱规律性偏差影响因素分析
为探讨反应谱规律性偏差表征参数的影响因素及其影响程度,选用地震震级MW、震中距R、峰值加速度PGA等地震动影响场表征参数和30 m平均剪切波速vS30、剪切波速至1 km/s的覆盖岩土层厚度Z1等局部场地条件表征参数作为自变量开展统计。因变量反应谱规律性偏差位置表征参数选为式(2)中反应谱规律性偏差的中心周期Tp;反应谱规律性偏差高度表征参数选为相对高度Hp/H0,其中Hp的定义与式(2)相同,H0为式(1)和表2给出的周期Tp处的无偏差加速度反应谱预测值的峰值高度;反应谱规律性偏差宽度表征参数选为相对于Tp的相对宽度W/Tp,其中W和Tp的定义与式(2)相同。
图7展示了反应谱规律性偏差的中心周期与各影响因素之间的统计关系。从图中可以看出:在双对数坐标下,反应谱规律性偏差的中心周期随地震震级(线性坐标)和震中距的增大均略有增加,随地震动强度(PGA)的变化趋势不明显;随30 m平均剪切波速vS30的增加而明显减小,表明场地表层土越硬,反应谱规律性偏差对应的周期越短;随剪切波速至1 km/s的覆盖岩土层厚度的增加而明显增加,表明场地覆盖土层越厚,反应谱规律性偏差对应的周期越长。尽管反应谱规律性偏差的中心周期与各影响因素之间的相关性存在较大的离散性,但是仍可以认为反应谱规律性偏差位置主要受局部场地条件(剪切波速和覆盖层厚度)的控制,同时也受地震震级和震源距离的影响。
![]() 图 7 加速度反应谱规律性偏差的中心周期Tp与各影响因素的相关性Figure 7. Correlations between central periods Tp of the regular deviations of spectral acceleration and each factor
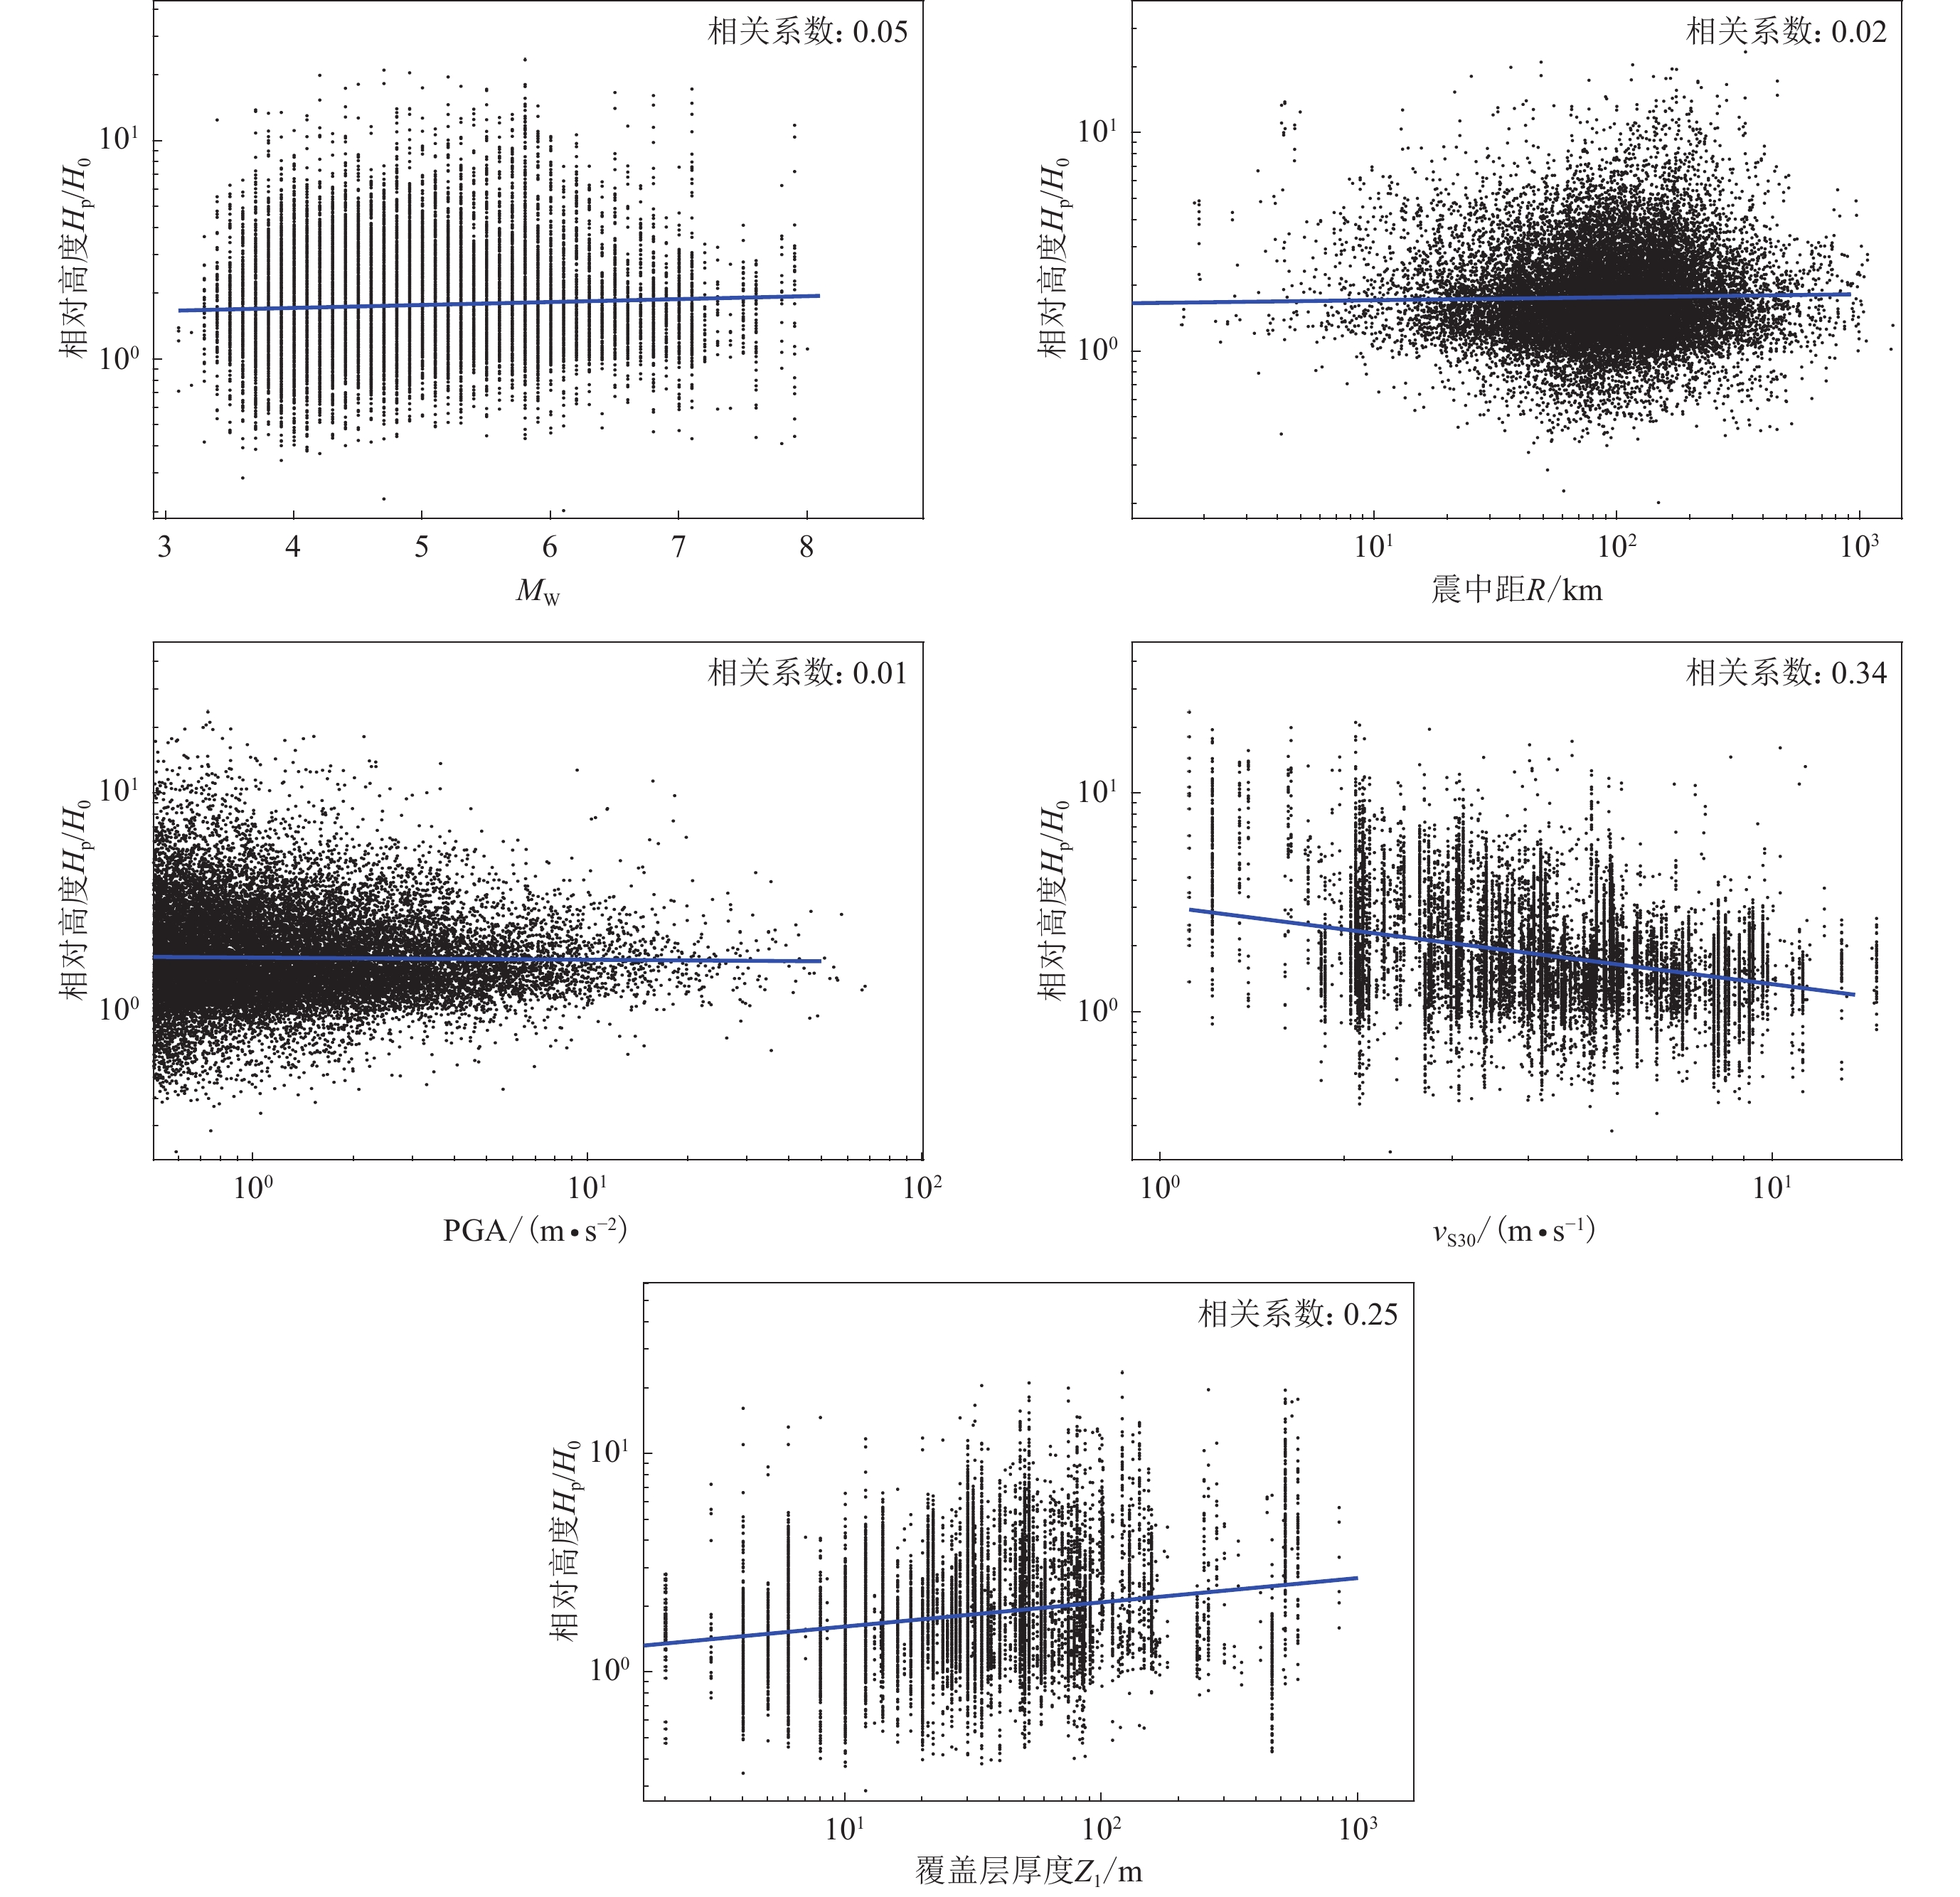
图 7 加速度反应谱规律性偏差的中心周期Tp与各影响因素的相关性Figure 7. Correlations between central periods Tp of the regular deviations of spectral acceleration and each factor图8展示了反应谱规律性偏差相对高度与各影响因素之间的统计关系,可以看出,在双对数坐标下,反应谱规律性偏差窄峰的相对高度Hp/H0:随地震震级(线性坐标)、震中距和地震动强度(PGA)的变化趋势不明显;随vS30的增大而明显减小,表明场地表层土越硬,反应谱规律性偏差窄峰的相对高度越小;随剪切波速至1 km/s的覆盖岩土层厚度的增加而略微增加。尽管也存在较大的离散性,但可以认为反应谱规律性偏差窄峰的相对高度主要受局部场地条件(剪切波速和覆盖层厚度)的控制,受地震震级、震源距离和地震动强度的影响不明显。
![]() 图 8 加速度反应谱规律性偏差的相对高度Hp/H0与各影响因素的相关性Figure 8. Correlations between relative heights Hp/H0 of the regular deviations of spectral acceleration and each factor
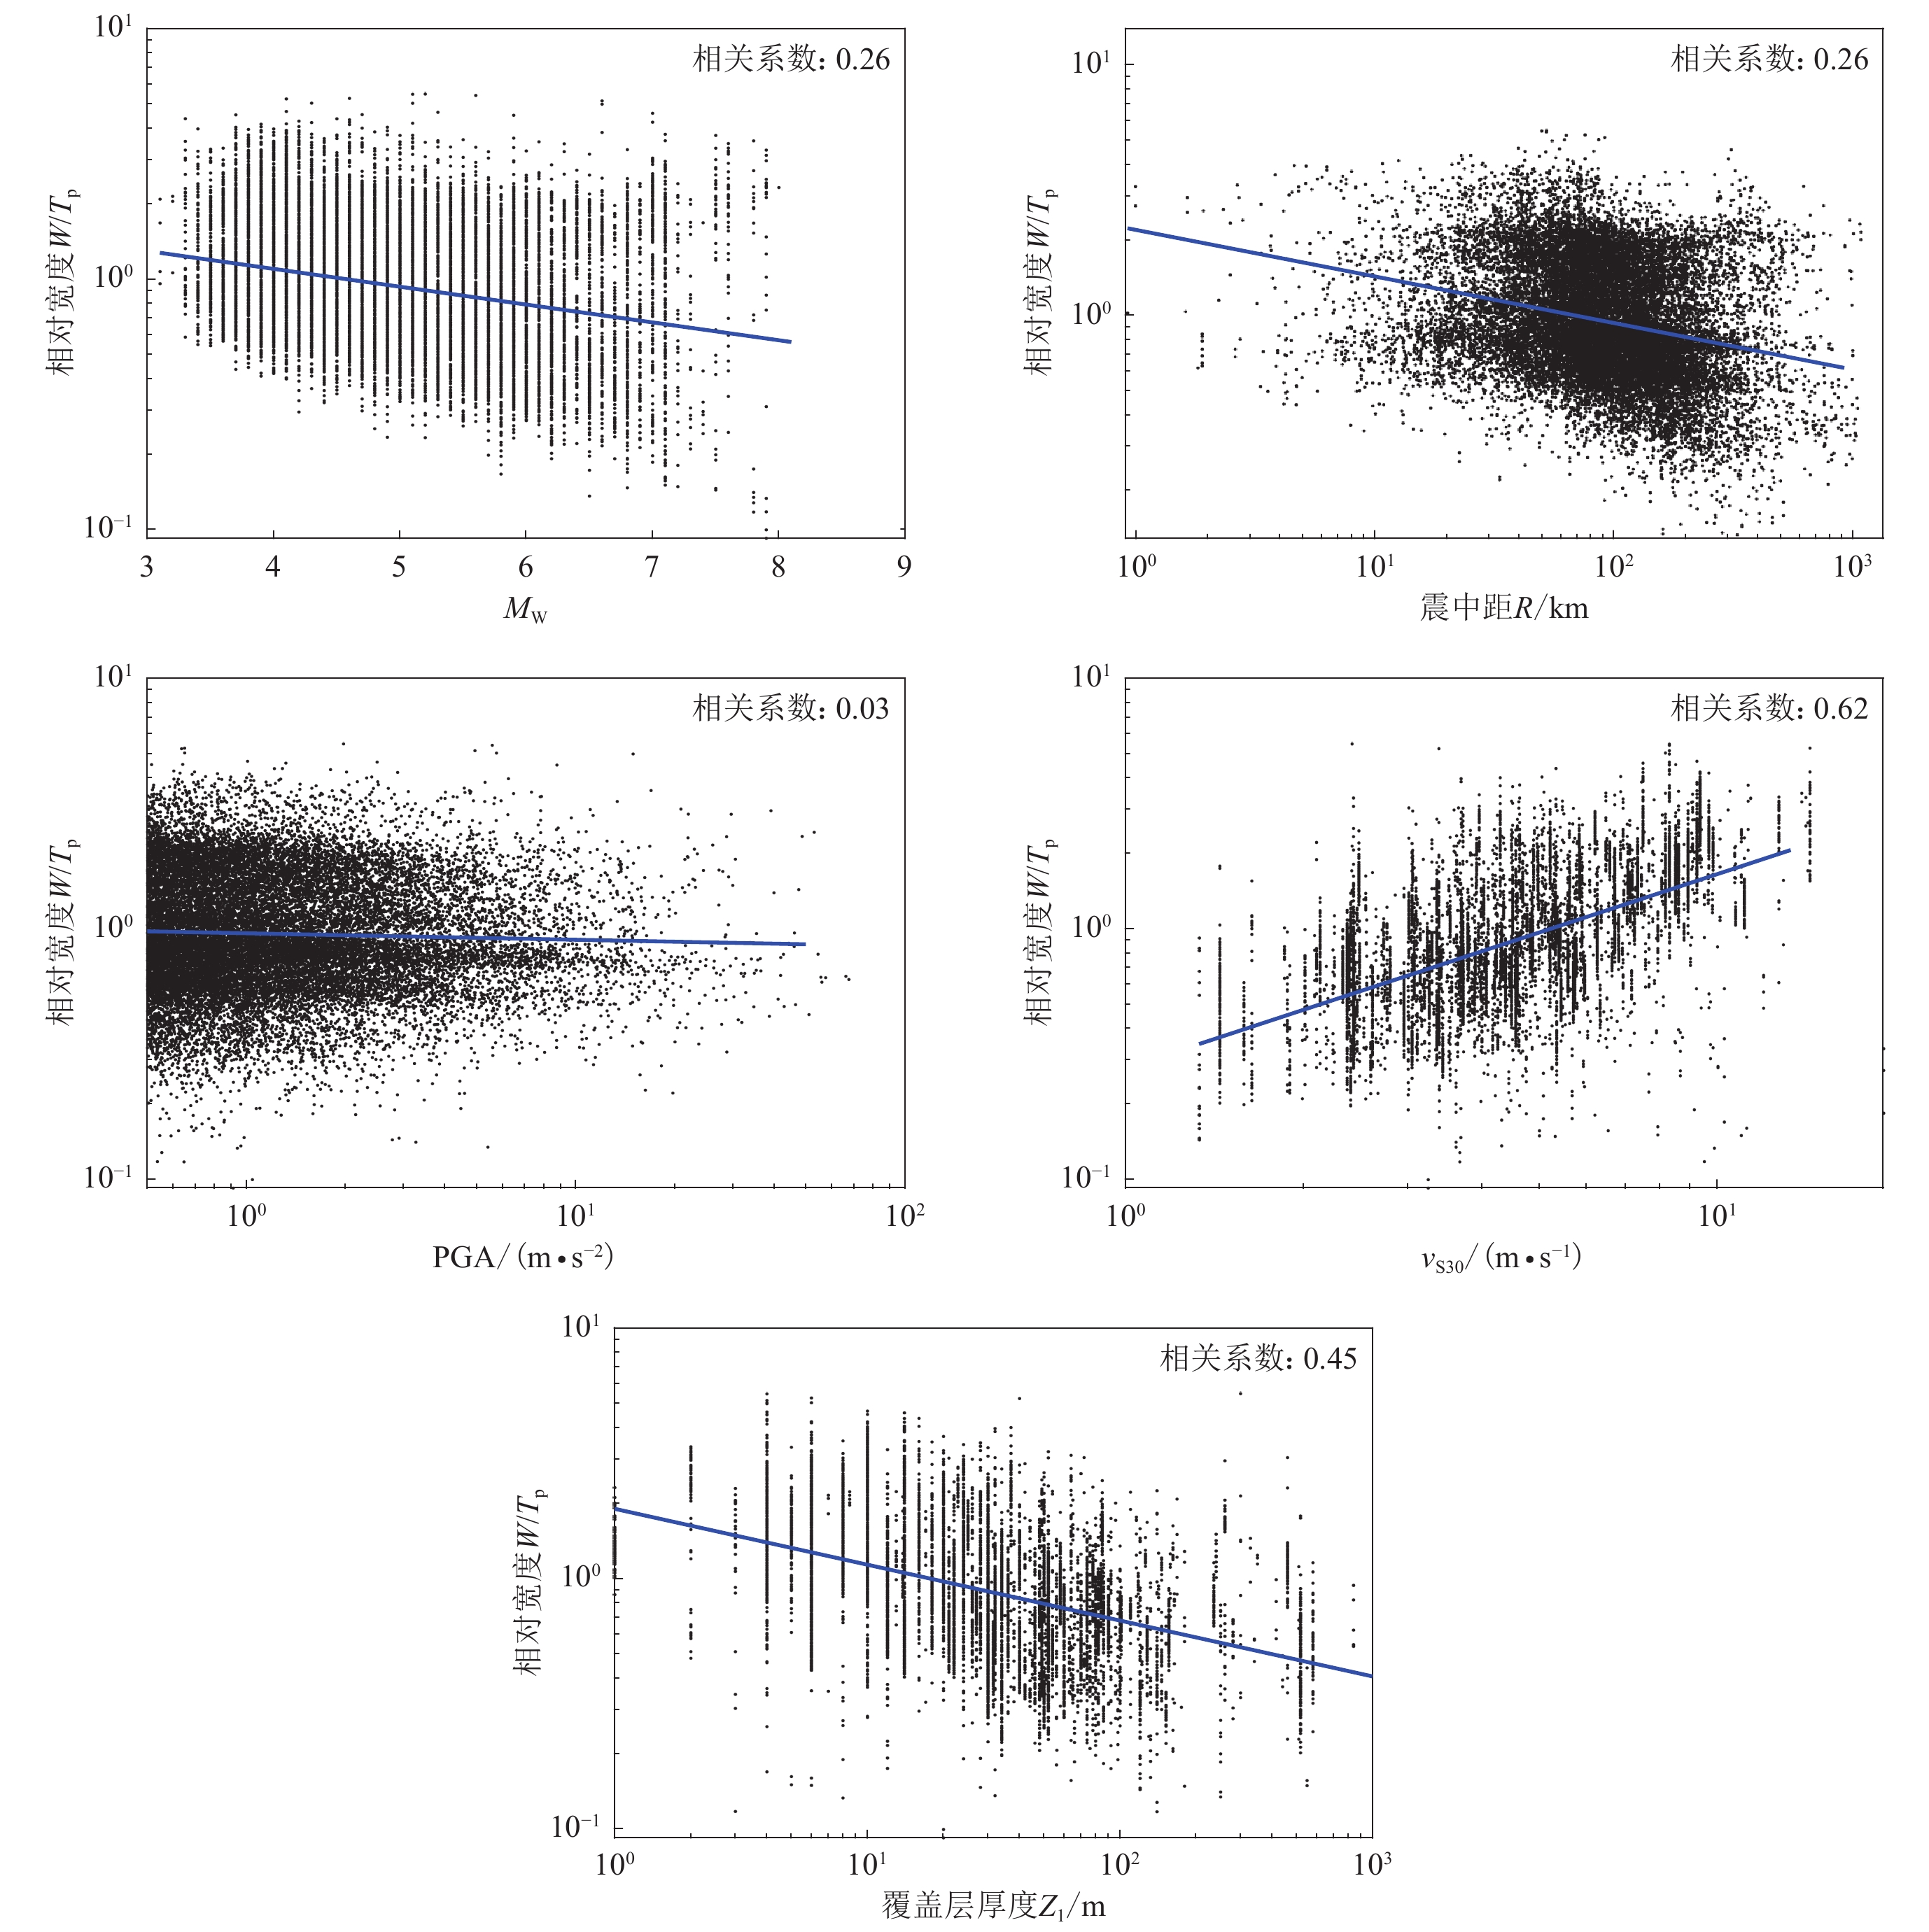
图 8 加速度反应谱规律性偏差的相对高度Hp/H0与各影响因素的相关性Figure 8. Correlations between relative heights Hp/H0 of the regular deviations of spectral acceleration and each factor图9展示了反应谱规律性偏差相对宽度与各影响因素之间的统计关系,可以看出,在双对数坐标下,反应谱规律性偏差的相对宽度:随地震震级(线性坐标)、震中距和剪切波速至1 km/s的覆盖岩土层厚度的增加而减小;随地震动强度(PGA)的变化趋势不明显;随vS30的增加而明显增大,表明场地表层土越硬,反应谱规律性偏差窄峰相对宽度越大。因此,可以认为反应谱规律性偏差相对宽度受局部场地条件(剪切波速和覆盖层厚度)和地震震级、震源距离等因素的综合影响。
![]() 图 9 加速度反应谱规律性偏差的相对宽度W/Tp与各影响因素的相关性Figure 9. Correlations between relative widths W/Tp of the regular deviations of spectral acceleration and each factor
图 9 加速度反应谱规律性偏差的相对宽度W/Tp与各影响因素的相关性Figure 9. Correlations between relative widths W/Tp of the regular deviations of spectral acceleration and each factor从上述分析可以看出,加速度反应谱规律性偏差的位置、相对高度、相对宽度等表征参数受平均剪切波速、覆盖层厚度等局部场地条件表征参数的影响较为显著,同时也受地震震级、震中距等参数的影响,但与地震动强度的相关性不明显。
5. 反应谱规律性偏差预测方程
鉴于加速度反应谱规律性偏差的中心周期、相对高度、相对宽度等表征参数受局部场地条件和地震动影响场表征参数的影响,选取平均剪切波速、覆盖层厚度、地震震级、震中距等参数作为自变量,利用2万5 229条有反应谱规律性偏差的强震动记录,在双对数坐标系下进行多元线性回归,得到反应谱规律性偏差的中心周期、相对高度、相对宽度的经验关系如下:
$$ \mathrm{lg}Y_i=a_{i\text{,} 0}+\sum_{j=0}^4a_{i\text{,} j}X_i+\sigma_i\text{,} $$ (3) 式中:Yi分别表示加速度反应谱规律性偏差的中心周期Tp、相对高度Hp/H0 或相对宽度W/Tp;自变量X1,X2,X3,X4分别为MW,lgR,lgvS30,lgZ1;ai, j (j=0,1,2,3,4)为回归系数,σi为标准差。这些参数的具体数值详见表4,可以看出,式(3)给出的加速度反应谱规律性偏差的中心周期Tp、相对高度Hp/H0和相对宽度W/Tp的精度较高。
表 4 反应谱规律性偏差表征参数的多元线性回归系数Table 4. Regression coefficients of characteristic parameters for regular deviations of spectral acceleration using multiple linear regressions表征参数 ai, 0 ai, 1 ai, 2 ai, 3 ai, 4 σi Tp 1.064 0.049 0 0.066 1 −0.853 7 0.002 8 0.183 0 Hp/H0 1.398 0.010 9 −0.027 9 −0.420 0 −0.014 9 0.191 0 W/Tp −0.741 −0.033 1 −0.087 5 0.757 9 0.008 3 0.168 9 对于具体场点,可以采用以下过程确定有加速度反应谱规律性偏差的场地相关地震动反应谱:
1) 利用地震动衰减关系,并考虑局部场地条件影响,确定无加速度反应谱规律性偏差的场地相关加速度反应谱;
2) 利用式(3)和表4确定加速度反应谱规律性偏差的位置、高度和宽度,并根据式(2)确定加速度反应谱规律性偏差的数值;
3) 在无加速度反应谱规律性偏差的场地相关加速度反应谱上,叠加加速度反应谱规律性偏差,即可获得有加速度反应谱规律性偏差的场地相关地震动反应谱。
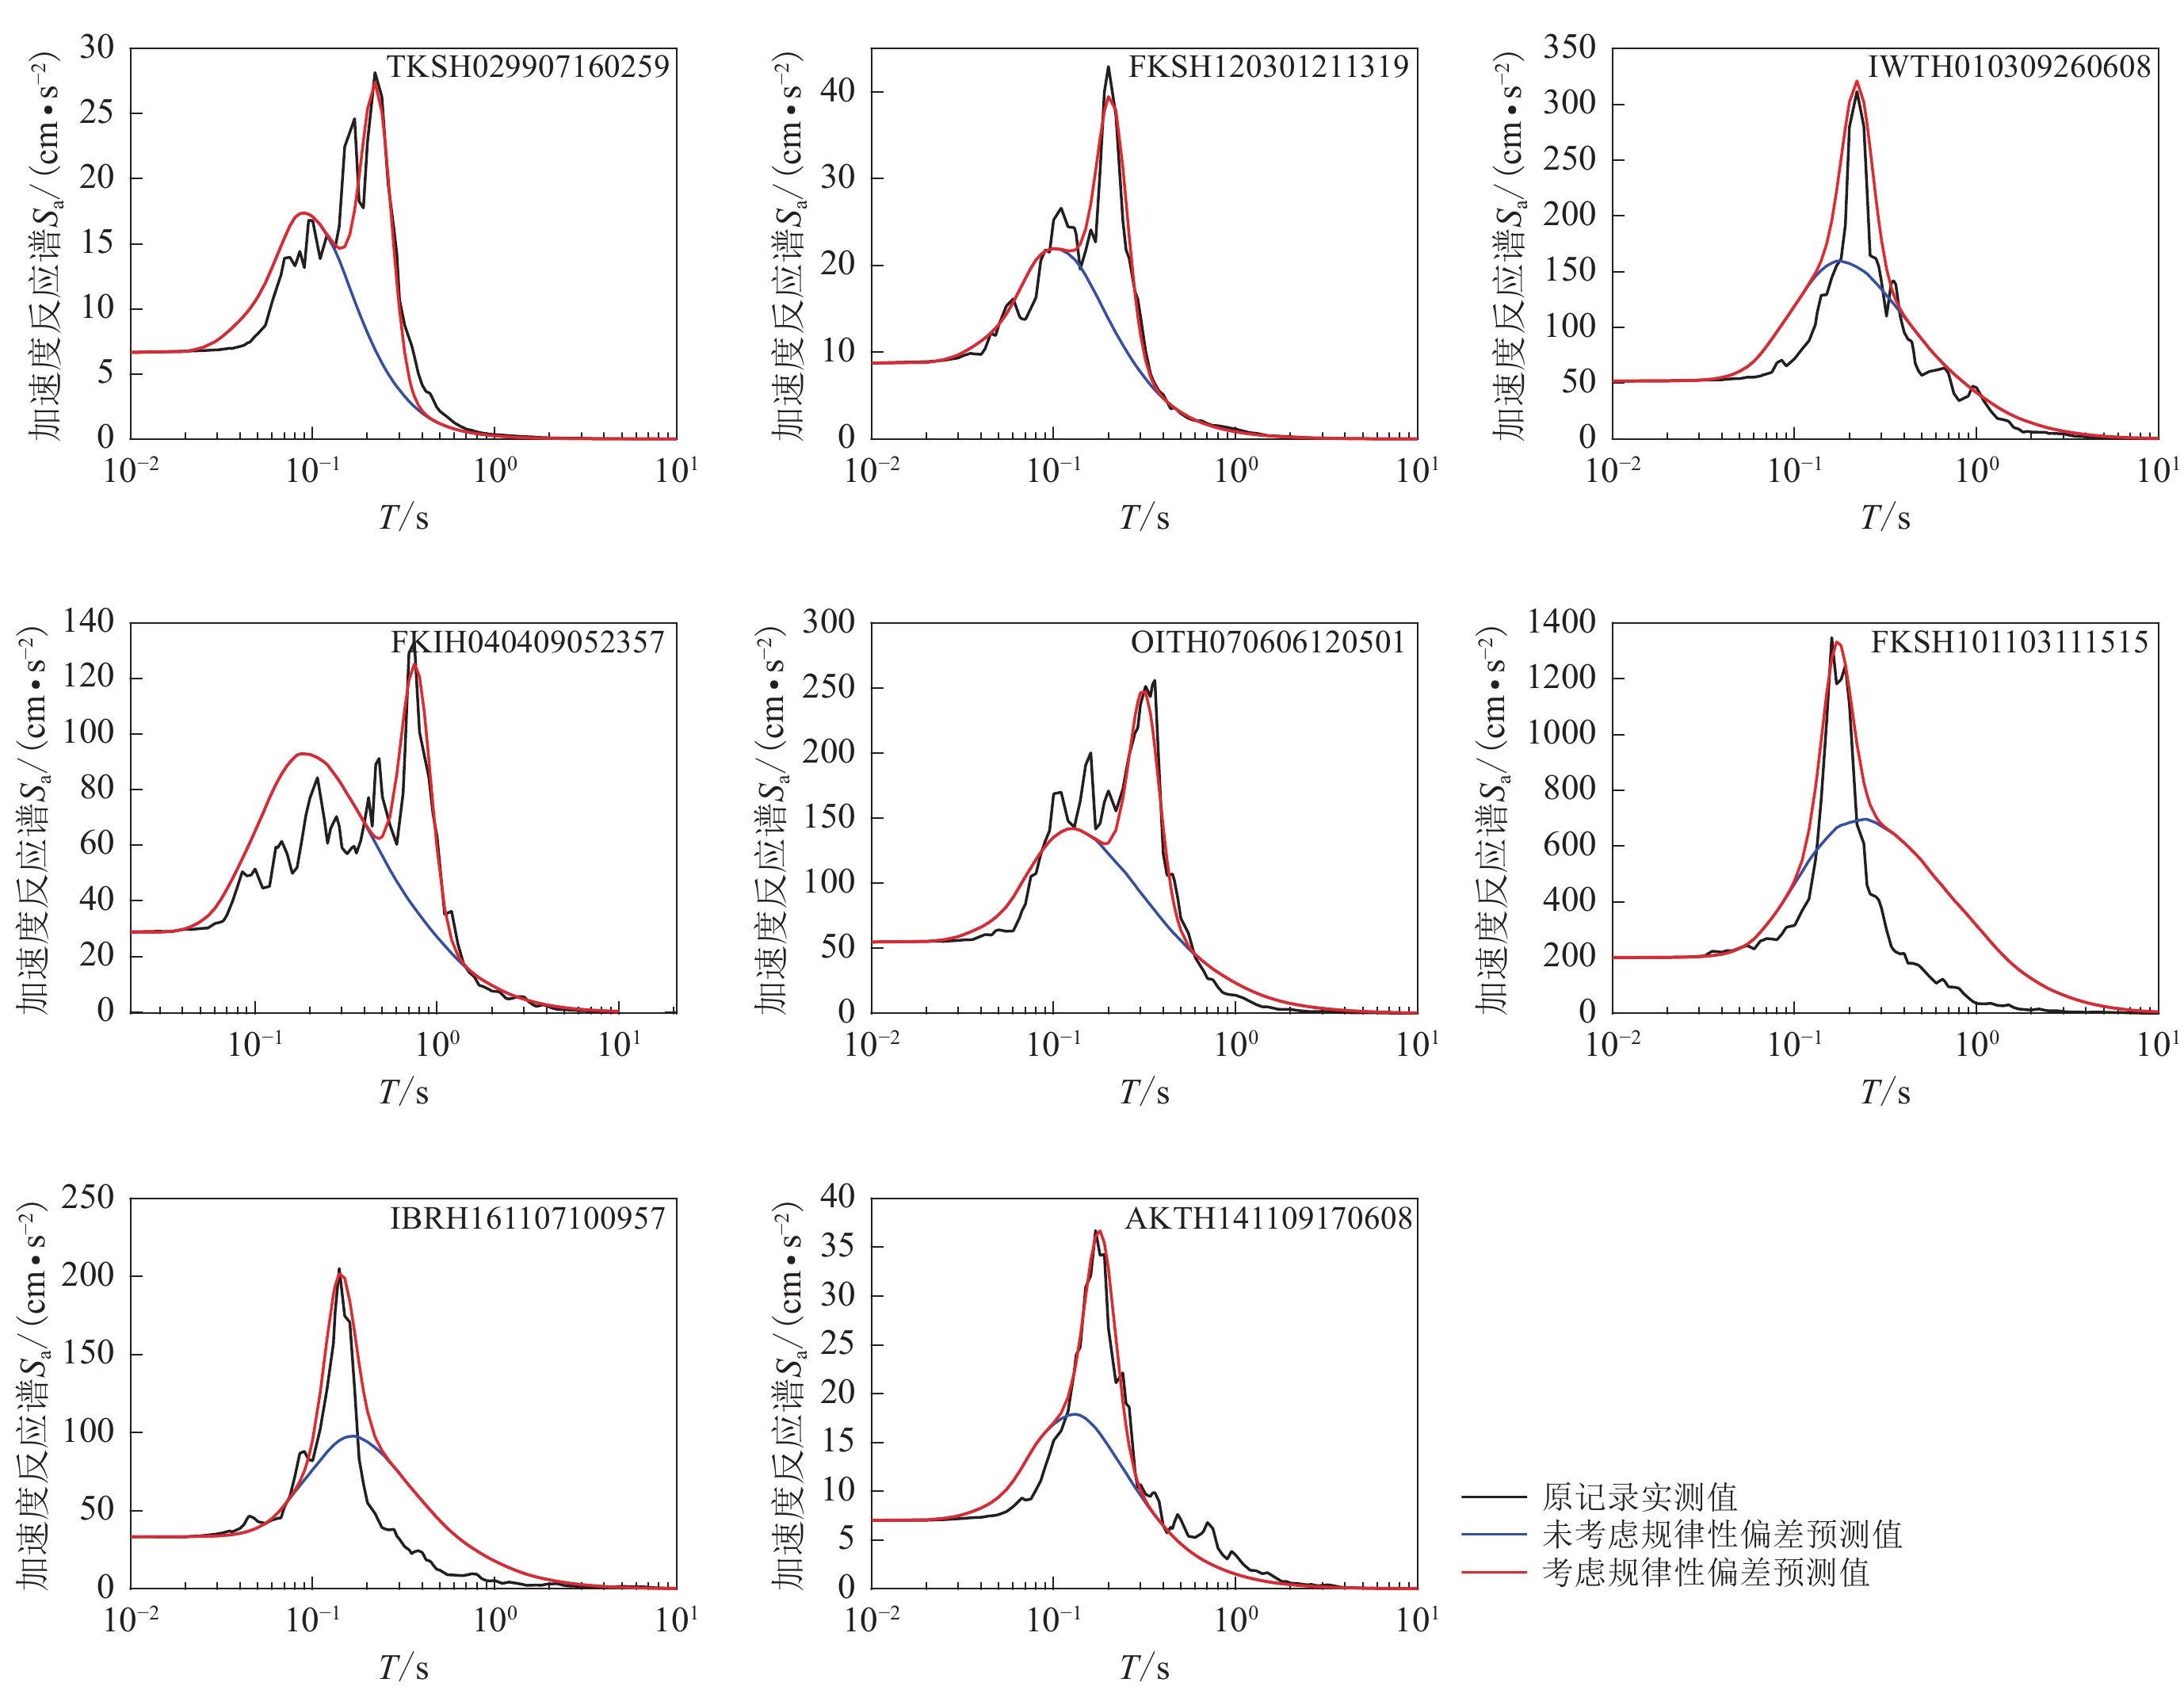
图10给出了几条强震动记录加速度反应谱与其预测值的比较,其中黑色曲线为基于强震动记录计算得到的加速度反应谱,蓝色曲线为利用式(1)和表2得到的无偏差加速度反应谱,红色曲线为有加速度反应谱规律性偏差的场地相关加速度反应谱,其中PGA直接选自原记录。从该图中可以看出,考虑反应谱规律性偏差得到的加速度反应谱能更好地反映实际地震动特征。
![]() 图 10 典型的有反应谱规律性偏差记录的加速度反应谱预测值(考虑规律性偏差)Figure 10. Predicted values of spectral accelerations considering regular deviations of spectral acceleration for typical records with regular deviations
图 10 典型的有反应谱规律性偏差记录的加速度反应谱预测值(考虑规律性偏差)Figure 10. Predicted values of spectral accelerations considering regular deviations of spectral acceleration for typical records with regular deviations6. 讨论与结论
本文基于日本KiK-net台网697个竖向钻井台阵获取的8万5 976组加速度记录,析出了加速度反应谱规律性偏差并进行了参数化表述,探讨了反应谱规律性偏差表征参数与局部场地条件和地震动影响场表征参数间的相关性。
研究显示,加速度反应谱规律性偏差的形状与高斯曲线高度吻合,可以用加速度反应谱规律性偏差的中心周期、相对高度和相对宽度表征,这三个表征参数受剪切波速、覆盖层厚度等局部场地条件表征参数的影响较为显著,受地震震级、震中距的影响相对较小,与地震动强度相关性差。本研究给出了加速度反应谱规律性偏差表征参数的经验统计关系,提出了有加速度反应谱规律性偏差的场地相关加速度反应谱的预测方法。
本文选取强震动记录加速度反应谱是否大于平均值+0.5倍的方差作为加速度反应谱规律性偏差的识别准则,但未讨论其优越性,且未考虑局部场地条件对无规律性偏差反应谱预测值的影响,可以预期所选准则不同研究结果会有差异。此外,如何根据地震动影响场和局部场地条件表征参数确定强震动记录中有/无加速度反应谱规律性偏差的判定依据,尚待深入研究。
日本防灾科学技术研究所所属的KiK-net台网提供了强震动记录数据和场地钻孔信息,审稿专家提出了中肯的意见,作者在此表示衷心的感谢。
-
![]()
图 1 所选取记录对应观测台阵的空间分布
Figure 1. The spatial distribution of the observation array corresponding to selected records
![]()
图 2 所选取记录的峰值加速度PGA随震级M、震中距的分布
Figure 2. Distribution of the PGAs with earthquake magnitude M and epicentral distance for the selected records
![]()
图 3 有反应谱规律性偏差记录的加速度反应谱预测值(未考虑规律性偏差)
Figure 3. Predicted values of the spectral accelerations without considering the regular deviations for records with regular deviations
![]()
图 4 有、无反应谱规律性偏差记录对应的强震动台站场地vS30和覆盖层厚度Z1分布图
Figure 4. Distribution of vS30 and overburden thickness Z1 on the sites of strong motion stations for the records with/without regular deviation of spectral acceleration
![]()
图 5 典型记录加速度反应谱规律性偏差的分离
Figure 5. Separation of the regular deviations from typical spectral acceleration
![]()
图 6 加速度反应谱规律性偏差及拟合高斯曲线
Figure 6. Regular deviations of spectral accelerations and their fitting Gaussian curve
![]()
图 7 加速度反应谱规律性偏差的中心周期Tp与各影响因素的相关性
Figure 7. Correlations between central periods Tp of the regular deviations of spectral acceleration and each factor
![]()
图 8 加速度反应谱规律性偏差的相对高度Hp/H0与各影响因素的相关性
Figure 8. Correlations between relative heights Hp/H0 of the regular deviations of spectral acceleration and each factor
![]()
图 9 加速度反应谱规律性偏差的相对宽度W/Tp与各影响因素的相关性
Figure 9. Correlations between relative widths W/Tp of the regular deviations of spectral acceleration and each factor
![]()
图 10 典型的有反应谱规律性偏差记录的加速度反应谱预测值(考虑规律性偏差)
Figure 10. Predicted values of spectral accelerations considering regular deviations of spectral acceleration for typical records with regular deviations
表 1 所有记录的PGA归一化加速度反应谱(阻尼比5%)的回归系数
Table 1 Regression coefficients of PGA normalized spectral acceleration (damping ratio is 0.05) for all records
T/s a0 a1 a2 σ T/s a0 a1 a2 σ PGA 0.008 1 0 −0.000 2 0.002 6 0.240 −0.784 9 0.155 5 0.048 3 0.313 2 0.020 0.022 4 0 −0.005 3 0.011 2 0.250 −0.850 3 0.166 0 0.041 2 0.316 8 0.022 0.039 7 −0.001 3 −0.007 9 0.014 3 0.260 −0.911 1 0.175 6 0.033 8 0.319 1 0.025 0.072 8 −0.003 6 −0.013 9 0.023 8 0.280 −1.028 5 0.193 9 0.020 7 0.323 0 0.029 0.142 0 −0.008 1 −0.028 1 0.047 3 0.290 −1.083 3 0.202 0 0.015 5 0.325 4 0.030 0.163 2 −0.009 4 −0.032 3 0.054 3 0.300 −1.135 3 0.210 0 0.009 1 0.328 3 0.032 0.205 6 −0.011 9 −0.040 9 0.067 3 0.320 −1.237 4 0.226 5 −0.005 7 0.332 6 0.035 0.266 8 −0.016 0 −0.051 5 0.083 2 0.340 −1.341 6 0.242 7 −0.018 4 0.335 6 0.036 0.285 5 −0.017 4 −0.054 1 0.087 2 0.350 −1.391 0 0.250 0 −0.023 6 0.337 4 0.040 0.350 8 −0.022 8 −0.060 7 0.100 1 0.360 −1.438 7 0.256 7 −0.027 8 0.339 1 0.042 0.378 7 −0.025 2 −0.062 1 0.105 7 0.380 −1.530 5 0.269 5 −0.035 6 0.341 6 0.044 0.405 3 −0.027 5 −0.062 9 0.111 2 0.400 −1.619 9 0.282 0 −0.043 7 0.342 4 0.045 0.418 1 −0.028 7 −0.062 9 0.113 9 0.420 −1.707 0 0.294 0 −0.051 0 0.341 7 0.046 0.430 3 −0.029 8 −0.062 7 0.116 8 0.440 −1.787 2 0.305 2 −0.058 8 0.340 9 0.048 0.454 5 −0.032 0 −0.062 4 0.122 8 0.450 −1.824 9 0.310 6 −0.063 0 0.340 7 0.050 0.478 7 −0.034 2 −0.061 9 0.129 0 0.460 −1.861 6 0.315 9 −0.067 5 0.340 6 0.055 0.537 1 −0.039 6 −0.058 7 0.144 7 0.480 −1.931 4 0.326 0 −0.076 2 0.340 5 0.060 0.586 9 −0.044 0 −0.052 2 0.160 0 0.500 −1.998 4 0.335 4 −0.083 9 0.340 6 0.065 0.617 4 −0.046 1 −0.043 5 0.170 0 0.550 −2.153 9 0.355 4 −0.097 4 0.340 1 0.067 0.623 9 −0.046 5 −0.038 6 0.171 9 0.600 −2.294 5 0.373 0 −0.108 6 0.341 9 0.070 0.631 3 −0.047 3 −0.030 6 0.172 4 0.650 −2.417 6 0.388 8 −0.120 1 0.345 3 0.075 0.633 9 −0.048 0 −0.016 0 0.170 1 0.667 −2.456 4 0.393 6 −0.123 5 0.346 3 0.080 0.624 5 −0.045 6 −0.006 9 0.165 6 0.700 −2.530 9 0.402 6 −0.129 1 0.347 8 0.085 0.600 8 −0.040 2 −0.002 2 0.161 0 0.750 −2.640 2 0.415 2 −0.135 2 0.349 1 0.090 0.566 3 −0.033 9 0.003 1 0.160 8 0.800 −2.740 6 0.426 7 −0.141 3 0.350 8 0.095 0.526 5 −0.027 3 0.008 7 0.162 6 0.850 −2.832 7 0.437 4 −0.147 8 0.351 6 0.100 0.480 7 −0.020 9 0.016 4 0.164 7 0.900 −2.920 0 0.446 7 −0.152 2 0.351 5 0.110 0.382 4 −0.008 0 0.032 1 0.172 7 0.950 −3.001 9 0.455 1 −0.155 7 0.350 8 0.120 0.275 0 0.005 5 0.047 9 0.184 7 1.000 −3.078 0 0.463 0 −0.159 8 0.350 0 0.130 0.172 1 0.018 1 0.061 3 0.203 0 2.000 −3.982 5 0.544 2 −0.218 7 0.343 4 0.133 0.141 9 0.021 9 0.064 5 0.208 8 3.000 −4.403 5 0.576 4 −0.270 8 0.348 8 0.140 0.069 9 0.031 1 0.070 8 0.221 3 4.000 −4.663 1 0.589 5 −0.305 4 0.353 4 0.150 −0.035 4 0.045 3 0.076 0 0.236 4 5.000 −4.846 1 0.592 9 −0.325 6 0.357 0 0.160 −0.136 9 0.060 1 0.076 3 0.248 4 6.000 −4.989 1 0.592 1 −0.336 6 0.359 0 0.170 −0.233 3 0.074 2 0.075 7 0.259 0 7.000 −5.102 2 0.587 7 −0.340 0 0.360 3 0.180 −0.322 8 0.086 7 0.075 0 0.269 5 8.000 −5.194 7 0.580 9 −0.338 2 0.361 1 0.190 −0.407 7 0.098 4 0.073 7 0.280 0 9.000 −5.280 3 0.575 3 −0.335 0 0.361 5 0.200 −0.491 8 0.110 1 0.071 8 0.289 9 10.000 −5.357 1 0.570 7 −0.332 7 0.361 7 0.220 −0.645 9 0.133 4 0.061 8 0.303 7 注:a0,a1和a2为文中式(1)的回归系数,σ为标准差。  下载: 导出CSV
表 2 无反应谱规律性偏差记录的PGA归一化加速度反应谱(阻尼比5%)回归系数
Table 2 Regression coefficients of PGA normalized acceleration response spectrum (damping ratio is 0.05) for records without the regular deviations of spectral acceleration
T/s a0 a1 a2 σ T/s a0 a1 a2 σ PGA 0.008 2 −0.000 1 −0.000 1 0.003 0 0.240 −0.775 4 0.160 5 0.029 8 0.285 5 0.020 0.021 9 −0.000 1 −0.004 8 0.011 2 0.250 −0.839 2 0.169 7 0.026 3 0.290 5 0.022 0.039 5 −0.001 7 −0.006 8 0.014 2 0.260 −0.899 2 0.178 3 0.021 9 0.294 5 0.025 0.072 7 −0.004 4 −0.011 8 0.023 6 0.280 −1.014 5 0.194 7 0.014 8 0.302 1 0.029 0.142 6 −0.009 5 −0.023 9 0.047 3 0.290 −1.068 3 0.201 9 0.012 2 0.306 1 0.030 0.164 2 −0.011 2 −0.027 3 0.054 4 0.300 −1.120 0 0.209 2 0.008 5 0.310 4 0.032 0.207 5 −0.014 4 −0.034 3 0.067 6 0.320 −1.221 5 0.225 0 −0.003 8 0.316 8 0.035 0.269 1 −0.019 4 −0.042 1 0.083 7 0.340 −1.325 2 0.240 8 −0.015 1 0.321 3 0.036 0.288 0 −0.021 1 −0.043 8 0.087 8 0.350 −1.374 7 0.247 9 −0.019 6 0.323 4 0.040 0.352 6 −0.027 3 −0.047 3 0.100 6 0.360 −1.422 8 0.254 6 −0.023 1 0.325 6 0.042 0.379 4 −0.029 9 −0.047 2 0.105 6 0.380 −1.515 5 0.267 1 −0.029 6 0.328 8 0.044 0.404 8 −0.032 5 −0.046 5 0.110 3 0.400 −1.606 6 0.280 0 −0.037 4 0.330 1 0.045 0.417 1 −0.033 9 −0.045 8 0.112 6 0.420 −1.696 3 0.292 5 −0.045 0 0.329 8 0.046 0.428 7 −0.035 2 −0.044 6 0.114 9 0.440 −1.778 4 0.304 2 −0.053 3 0.329 5 0.048 0.452 2 −0.037 8 −0.042 5 0.119 9 0.450 −1.816 9 0.309 8 −0.057 8 0.329 5 0.050 0.476 1 −0.040 4 −0.040 4 0.125 2 0.460 −1.854 5 0.315 3 −0.062 2 0.329 6 0.055 0.532 0 −0.046 3 −0.034 0 0.137 3 0.480 −1.926 9 0.325 9 −0.071 1 0.330 1 0.060 0.578 1 −0.050 6 −0.026 4 0.147 1 0.500 −1.996 0 0.335 8 −0.079 1 0.330 7 0.065 0.605 5 −0.052 1 −0.017 9 0.152 5 0.550 −2.154 2 0.356 7 −0.093 9 0.331 4 0.067 0.611 9 −0.052 6 −0.012 8 0.153 4 0.600 −2.296 1 0.374 6 −0.105 5 0.334 2 0.070 0.620 6 −0.053 8 −0.004 3 0.153 5 0.650 −2.419 8 0.390 8 −0.118 1 0.338 2 0.075 0.627 0 −0.055 2 0.010 4 0.151 7 0.667 −2.459 3 0.395 8 −0.121 7 0.339 3 0.080 0.621 4 −0.053 0 0.018 2 0.148 2 0.700 −2.535 3 0.405 1 −0.127 6 0.341 1 0.085 0.599 8 −0.047 1 0.020 4 0.145 1 0.750 −2.645 3 0.417 8 −0.133 5 0.342 9 0.090 0.565 1 −0.040 1 0.023 7 0.145 5 0.800 −2.746 7 0.429 7 −0.140 0 0.344 7 0.095 0.523 0 −0.032 6 0.028 2 0.148 3 0.850 −2.840 3 0.440 5 −0.146 2 0.345 8 0.100 0.473 9 −0.025 2 0.035 2 0.151 9 0.900 −2.930 3 0.450 1 −0.149 5 0.345 7 0.110 0.370 9 −0.009 7 0.046 3 0.160 6 0.950 −3.014 6 0.458 8 −0.152 6 0.345 2 0.120 0.261 5 0.007 0 0.053 7 0.171 5 1.000 −3.092 6 0.467 0 −0.156 3 0.344 6 0.130 0.158 2 0.023 3 0.055 6 0.186 2 2.000 −4.002 4 0.547 8 −0.210 5 0.340 5 0.133 0.128 2 0.028 0 0.055 9 0.190 7 3.000 −4.430 1 0.581 0 −0.260 9 0.346 7 0.140 0.057 7 0.038 9 0.056 0 0.199 9 4.000 −4.697 6 0.596 0 −0.295 5 0.352 1 0.150 −0.045 0 0.054 4 0.055 7 0.211 0 5.000 −4.886 8 0.600 8 −0.315 6 0.356 3 0.160 −0.145 3 0.069 3 0.054 6 0.221 6 6.000 −5.033 3 0.601 2 −0.327 5 0.358 4 0.170 −0.242 0 0.083 2 0.054 7 0.232 5 7.000 −5.148 0 0.597 2 −0.331 3 0.359 8 0.180 −0.330 5 0.095 5 0.054 2 0.243 0 8.000 −5.241 4 0.591 0 −0.330 3 0.360 7 0.190 −0.412 4 0.106 7 0.052 5 0.252 5 9.000 −5.327 9 0.585 8 −0.327 6 0.361 2 0.200 −0.493 3 0.118 2 0.049 7 0.261 2 10.000 −5.404 8 0.581 3 −0.325 7 0.361 6 0.220 −0.641 5 0.140 4 0.039 9 0.274 1 注:a0,a1和a2为文中式(1)的回归系数,σ为标准差。
下载: 导出CSV
表 3 所选取记录的地震参数及场地条件参数
Table 3 Earthquakes parameters and site conditions parameters for the selected records
记录编号 MW 震中距
R/kmvS30
/(m·s−1)覆盖层
厚度Z1/mTKSH029 907 160 259 4.2 94 349 46 FKSH120 301 211 319 5.1 103 449 22 IWTH010 309 260 608 7.3 257 438 156 FKIH040 409 052 357 7.5 292 300 98 OITH070 606 120 501 6.4 23 276 63 FKSH101 103 111 515 7.8 157 487 32 IBRH161 107 100 957 7.0 316 626 12 AKTH141 109 170 608 6.0 206 233 90
下载: 导出CSV
表 4 反应谱规律性偏差表征参数的多元线性回归系数
Table 4 Regression coefficients of characteristic parameters for regular deviations of spectral acceleration using multiple linear regressions
表征参数 ai, 0 ai, 1 ai, 2 ai, 3 ai, 4 σi Tp 1.064 0.049 0 0.066 1 −0.853 7 0.002 8 0.183 0 Hp/H0 1.398 0.010 9 −0.027 9 −0.420 0 −0.014 9 0.191 0 W/Tp −0.741 −0.033 1 −0.087 5 0.757 9 0.008 3 0.168 9
下载: 导出CSV
-
薄景山,李秀领,刘德东,刘红帅. 2003. 土层结构对反应谱特征周期的影响[J]. 地震工程与工程振动,23(5):42–45. doi: 10.3969/j.issn.1000-1301.2003.05.007 Bo J S,Li X L,Liu D D,Liu H S. 2003. Effects of soil layer construction on characteristic periods of response spectra[J]. Earthquake Engineering and Engineering Vibration,23(5):42–45 (in Chinese).
薄景山,吴兆营,翟庆生,齐文浩. 2004. 三种土层结构反应谱平台值的统计分析[J]. 地震工程与工程振动,24(2):23–28. doi: 10.3969/j.issn.1000-1301.2004.02.005 Bo J S,Wu Z Y,Zhai Q S,Qi W H. 2004. Statistical analysis on flat section values of response spectra in three kinds of soil layer constructions[J]. Earthquake Engineering and Engineering Vibration,24(2):23–28 (in Chinese).
耿淑伟. 2005. 抗震设计规范中地震作用的规定[D]. 哈尔滨:中国地震局工程力学研究所:44−69. Geng S W. 2005. Strong Ground Motion Input Parameter for Seismic Design[D]. Harbin:Institute of Engineering Mechanics,China Earthquake Administration:44−69 (in Chinese).
耿淑伟,席远. 2010. 基于现行规范场地划分标准的地震动反应谱衰减关系[J]. 世界地震工程,26(增刊):138–141. Geng S W,XiI Y. 2010. The attenuation relations of response spectra based on classified site criterion in current seismic design code[J]. World Earthquake Engineering,26(S1):138–141 (in Chinese).
郭峰,吴东明,许国富,伋雨林. 2011. 场地条件对抗震设计反应谱最大值的影响[J]. 土木工程与管理学报,28(1):69–72. doi: 10.3969/j.issn.2095-0985.2011.01.015 Guo F,Wu D M,Xu G F,Ji Y L. 2011. Effect of site condition on the maximum value of seismic design response spectrum[J]. Journal of Civil Engineering and Management,28(1):69–72 (in Chinese).
郭晓云,薄景山,巴文辉. 2012. 汶川地震不同场地反应谱平台值统计分析[J]. 地震工程与工程振动,32(4):54–62. Guo X Y,Bo J S,Ba W H. 2012. Statistical analysis of peak flat values of response spectra in different site conditions based on Wenchuan strong ground motions[J]. Earthquake Engineering and Engineering Vibration,32(4):54–62 (in Chinese).
郭明珠,胡海芹,曹鑫雨,常议彬. 2016. 反应谱特征周期的统计分析[J]. 防灾科技学院学报,18(1):42–50. doi: 10.3969/j.issn.1673-8047.2016.01.007 Guo M Z,Hu H Q,Cao X Y,Chang Y B. 2016. Statistical analysis of characteristic period of response spectrum[J]. Institute of Disaster Prevention,18(1):42–50 (in Chinese).
冀昆,温瑞智,崔建文,王宏伟,任叶飞. 2014. 鲁甸MS6.5级地震强震动记录及震害分析[J]. 震灾防御技术,9(3):325–339. doi: 10.11899/zzfy20140301 Ji K,Wen R Z,Cui J W,Wang H W,Ren Y F. 2014. Observation of strong motion and damage investigation for MS6.5 Ludian earthquake[J]. Technology for Earthquake Disaster Prevention,9(3):325–339 (in Chinese) .
李小军,彭青. 2001. 不同类别场地地震动参数的计算分析[J]. 地震工程与工程振动,21(1):29–36. doi: 10.3969/j.issn.1000-1301.2001.01.005 Li X J,Peng Q. 2001. Calculation and analysis of earthquake ground motion parameters for different site categories[J]. Earthquake Engineering and Engineering Vibration,21(1):29–36 (in Chinese).
李平. 2010. 场地类型对设计反应谱平台值的影响 [D]. 哈尔滨:中国地震局工程力学研究所:41−50. Li P. 2010. The Effect of Site Types on Platform Value of the Design Response Spectrum[D]. Harbin:Institute of Engineering Mechanics,China Earthquake Administration:41−50 (in Chinese).
李英成,张艳娟. 2018. 深覆盖软土场地弹塑性反应谱分析[J]. 重庆建筑,17(9):52–57. doi: 10.3969/j.issn.1671-9107.2018.09.52 Li Y C,Zhang Y J. 2018. Analysis on inelastic response spectra of site with deep and soft soil[J]. Chongqing Architecture,17(9):52–57 (in Chinese).
马宁,徐龙军,谢礼立. 2008. 集集地震地震动频谱参数研究[J]. 地震工程与工程振动,28(1):11–16. Ma N,Xu L J,Xie L L. 2008. Study on the period parameters of ground motions during the Chi-Chi earthquake[J]. Earthquake Engineering and Engineering Vibration,28(1):11–16 (in Chinese).
荣棉水,李小军,吕悦军,尤红兵. 2009. 平台地形对地震地面运动特征周期值的影响[J]. 中国地震,25(2):178–185. doi: 10.3969/j.issn.1001-4683.2009.02.008 Rong M S,Li X J,Lü Y J,You H B. 2009. Effect of protruding topography on characteristic period of ground motion[J]. Earthquake Research in China,25(2):178–185 (in Chinese).
宋晋东,白琳娟,李山有,冯继威,马强. 2017. 2017年3月27日云南漾濞5.1级地震强震动记录特征初步分析[J]. 地震工程与工程振动,37(2):197–204. Song J D,Bai L J,Li S Y,Feng J W,Ma Q. 2017. The characteristics of strong motion records of Yunnan Yangbi MS5.1 earthquake on March 27,2017[J]. Earthquake Engineering and Engineering Vibration,37(2):197–204 (in Chinese).
王玉石,李小军,刘爱文,卢滔,赵佳祥,王宁,李一琼. 2020a. 基于统计数据的非基岩核电厂抗震设计谱研究[J]. 核动力工程,41(3):115–120. Wang Y S,Li X J,Liu A W,Lu T,Zhao J X,Wang N,Li Y Q. 2020a. Study on spectral accelerations for seismic design of nuclear power plants on non-bedrock sites based on statistical data[J]. Nuclear Power Engineering,41(3):115–120 (in Chinese).
王玉石,李小军,刘艳琼,荣棉水,丁毅. 2020b. 2020年7月12日唐山古冶5.1级地震揭示的北京城区地震动场地效应分析[J]. 地震科学进展,50(7):14–19. doi: 10.3969/j.issn.2096-7780.2020.07.003 Wang Y S,Li X J,Liu Y Q,Rong M S,Ding Y. 2020b. Analysis on site effect of ground motion in Beijing urban area revealed by strong motion records in M5.1 Guye,Tangshan earthquake on 12th July,2020[J]. Progress in Earthquake Sciences,50(7):14–19 (in Chinese).
王维欢,王文才,尹欣欣,陈继锋,陈晓龙. 2021. 2021年青海玛多7.4级地震强震动记录及特征分析[J]. 地震工程学报,43(4):883–889. doi: 10.3969/j.issn.1000-0844.2021.04.883 Wang W H,Wang W C,Yin X X,Chen J F,Chen X L. 2021. Strong motion records and characteristics of the Maduo M7.4 earthquake in Qinghai Province,2021[J]. China Earthquake Engineering Journal,43(4):883–889 (in Chinese).
周雍年. 1984. 震级、震中距和场地条件对地面运动反应谱的影响[J]. 地震工程与工程振动,4(4):14–21. Zhou Y N. 1984. The effect of the seismic magnitudes,the epicentral distances and local soil conditions on the response spectra[J]. Earthquake Engineering and Engineering Vibration,4(4):14–21 (in Chinese).
周正华,周雍年,赵刚. 2002. 强震近场加速度峰值比和反应谱统计分析[J]. 地震工程与工程振动,22(3):15–18. doi: 10.3969/j.issn.1000-1301.2002.03.003 Zhou Z H,Zhou Y N,Zhao G. 2002. Statistical analysis of peak ratios and response spectra of near-field accelerograms[J]. Earthquake Engineering and Engineering Vibration,22(3):15–18 (in Chinese).
赵万松,耿淑伟. 2016. 基于设计地震分组的反应谱平台值研究[J]. 工程抗震与加固改造,38(5):38–43. Zhao W S,Geng S W. 2016. Research on the platform values of response spectra based on design earthquake classification[J]. Earthquake Resistant Engineering and Retrofitting,38(5):38–43 (in Chinese).
Chopra S,Choudhury P. 2011. A study of response spectra for different geological conditions in Gujarat,India[J]. Soil Dynam Earthq Eng,31(11):1551–1564. doi: 10.1016/j.soildyn.2011.06.007


计量
- 文章访问数: 213
- HTML全文浏览量: 34
- PDF下载量: 73
