

Anisotropic structure and dynamic implications of the upper mantle in the South China Sea
-
摘要: 南海处于欧亚板块、太平洋板块和印度—澳大利亚板块的交会区,是西北太平洋一系列边缘海中最大的边缘海。关于南海的打开以往研究提出了如印度板块与欧亚板块碰撞驱动挤出以及古南海俯冲拖拽等诸多模型。本文力图通过南海海盆及周边各向异性结构来约束南海演化机制。基于同济大学2012和2014年在南海中央海盆进行的两次被动源宽频带海底地震观测试验回收的10台OBS记录仪近1年的地震数据,本文采用三种不同的横波分裂方法,获取了中央海盆针对两次远震的XKS分裂结果以及南海周边20次区域地震提供的S震相分裂结果。SKS分裂结果显示,南海中央海盆下方存在快轴方向为NE-SW向的各向异性,其成因可能与海底扩张时期沿洋脊方向的地幔流以及南海海洋板块俯冲拖拽的地幔流有关。南海及其周边上地幔存在强各向异性,且不同方位观测到的各向异性不同,快轴方向与前人SKS横波分裂结果、GPS和板块运动一致,较好地对应了区域构造运动或者地幔对流模型。各向异性结果与印度—欧亚板块碰撞驱动挤出模型以及古南海俯冲板块拖拽模型预期结果一致,与理想的地幔柱上涌驱动模型不一致。由于海盆各向异性观测特别有限,各向异性结果不能证实亦不能证伪“大西洋型”海底扩张模型、弧后扩张模型和板缘破裂模型,后续还需要更多的观测结果来证实或证伪上述模型。Abstract: The South China Sea (SCS) is located at the intersection of the Eurasian, Pacific, and India-Australia plates. It is the largest marginal sea in a series of marginal seas in the Northwest Pacific Ocean. Many models have been proposed for the opening of the SCS, such as the extrusion model driven by the collision of the Indian plate and the Eurasian plate, and the slab pull model related to the subduction of the proto-SCS. This study aims to constrain the models of opening the SCS through the anisotropic structure of the central basin of the SCS and its surroundings. Based on the seismic data recorded by ten ocean bottom seismometers recovered from two passive seismic experiments conducted by Tongji University in the central basin of the SCS in 2012 and 2014, three different shear wave splitting methods are used to obtain the XKS splitting results of the central basin for two global earthquakes and the S phase splitting results provided by 20 regional earthquakes surrounding the SCS. The SKS splitting results demonstrate the presence of strong anisotropy with the NE fast direction in the central basin of the SCS, which may be related to mantle flow along the ocean ridge during seafloor expansion and the mantle flow dragged by the subduction of the proto-SCS plate. Strong anisotropy is also observed in the upper mantle surrounding SCS, and the anisotropy observed in different azimuths is different. The fast directions obtained are consistent with previous SKS-splitting results, GPS, and plate motions, and importantly correspond well to the regional tectonics or mantle convection models. The anisotropic results are consistent with the expected results of the extrusion model driven by the collision of the Indian-Eurasian plate and the slab pull of proto-SCS. The anisotropy results are inconsistent with the ideal upwelling driven model of the mantle plume. Unfortunately, due to the limited splitting observations in the central basin, the anisotropic results cannot confirm or falsify the “Atlantic-type” seafloor spreading model, the backarc spreading model, or the plate-edge rifting model. To verify the above models, further observations are needed.
-
引言
云南地区(97°E—106°E,21°N—29°N)位于青藏高原东南缘,新生代以来受青藏高原地壳物质向东侧运移和阿萨姆顶点楔入的共同作用,该地区的新构造变形和地震活动十分强烈,是中国大陆最显著的强震活动区域。根据中国大陆活动地块划分(张培震等,2003),云南地区主要涉及青藏地块( Ⅰ 级地块)的川滇地块( Ⅱ 级地块)和滇缅地块( Ⅰ 级地块)的滇南地块( Ⅱ 级地块)、滇西地块( Ⅱ 级地块),区内分布有安宁河—小江断裂带、红河断裂带和澜沧江断裂带(张国民等,2005)(图1)。
![]() 图 1 青藏高原活动地块划分及历史强震震中分布图(a) 青藏高原M≥7.0地震分布。Ⅰ :拉萨地块;Ⅱ :羌塘地块;Ⅲ : 巴颜喀拉地块;Ⅳ:柴达木地块;Ⅴ:祁连地块;Ⅵ:川滇地块;Ⅶ:滇南地块;Ⅷ:滇西地块;地块边界数据来引自张培震等(2003)。(b) 云南地区M≥6.7地震分布. F1:安宁河—小江断裂带;F2:红河断裂带;F3:澜沧江断裂带;断裂数据引自张国民等(2005)Figure 1. Distribution of active blocks and strong earthquakes in Qinghai-Xizang Plateau(a) Distribution of M≥7.0 earthquakes in Qinghai-Xizang Plateau. Ⅰ :Lhasa block;Ⅱ :Qiangtang block;Ⅲ :Bayan Har block;Ⅳ :Qaidam block;Ⅴ :Qilian block;Ⅵ :Sichuan-Yunnan block;Ⅶ :Southern Yunnan block;Ⅷ:Western Yunnan block. Block data are from Zhang et al (2003). (b) Distribution of M≥6.7 earthquakes in Yunnan region. F1:Anninghe-Xiaojiang fault zone;F2:Honghe fault zone;F3:Lancangjiang fault zone;the fault data refer from Zhang et al (2005)
图 1 青藏高原活动地块划分及历史强震震中分布图(a) 青藏高原M≥7.0地震分布。Ⅰ :拉萨地块;Ⅱ :羌塘地块;Ⅲ : 巴颜喀拉地块;Ⅳ:柴达木地块;Ⅴ:祁连地块;Ⅵ:川滇地块;Ⅶ:滇南地块;Ⅷ:滇西地块;地块边界数据来引自张培震等(2003)。(b) 云南地区M≥6.7地震分布. F1:安宁河—小江断裂带;F2:红河断裂带;F3:澜沧江断裂带;断裂数据引自张国民等(2005)Figure 1. Distribution of active blocks and strong earthquakes in Qinghai-Xizang Plateau(a) Distribution of M≥7.0 earthquakes in Qinghai-Xizang Plateau. Ⅰ :Lhasa block;Ⅱ :Qiangtang block;Ⅲ :Bayan Har block;Ⅳ :Qaidam block;Ⅴ :Qilian block;Ⅵ :Sichuan-Yunnan block;Ⅶ :Southern Yunnan block;Ⅷ:Western Yunnan block. Block data are from Zhang et al (2003). (b) Distribution of M≥6.7 earthquakes in Yunnan region. F1:Anninghe-Xiaojiang fault zone;F2:Honghe fault zone;F3:Lancangjiang fault zone;the fault data refer from Zhang et al (2005)受区域构造影响,云南地区地震活动呈现频度高、震级大、分布广的复杂特征,刘祖荫等(2002)根据地震分布特征将云南地区划分成6个地震活动带和3个地震活动区。皇甫岗和秦嘉政(2006)表明云南主体地区强震活动的时空成丛特征显著,将云南地区内的M≥6.7地震活动划分为四个强震活跃期。赵小艳等(2008)利用川滇M≥6.7强震幕式活动特征推断了汶川MS8.0地震后云南地区的强震趋势。秦嘉政等(2009)对云南强震活动的间隔时间特征进行研究,推断云南强震平均复发时间约为11 a。吴中海等(2014)分析表明青藏滇缅印尼歹字型构造体系的各构造部位之间具有密切成生联系,其历史大震的活动与运动学方面的整体性与协调性相对应,具有明显的联动效应。
1997年以来青藏高原的M≥7.0地震,除了发生在喜马拉雅构造带和缅甸弧地区的地震外,其余全部集中发生在巴颜喀拉地块,如1997年玛尼MS7.5地震、2001年昆仑山MS8.1地震、2008年于田MS7.3地震和汶川MS8.0地震、2010年玉树MS7.1地震、2013芦山MS7.0地震、2014年于田MS7.3地震、2017年九寨沟MS7.0地震和2021年玛多MS7.4地震。而历史上强震活动强烈的云南地区则一直处于M≥7.0地震平静状态,显示出云南区域强震平静而周边强震活跃的特征。
从1996年丽江MS7.0地震至今,云南地区不仅M≥7.0地震处于平静状态,M≥6.7地震也处于平静状态(M6.7是云南地区强震活跃期与平静期划分的下限震级)。截至2023年8月22日,云南地区M≥6.7和M≥7.0地震的平静时长已达27.55 a,均已显著超过1900年以来或1887年以来的历史最长平静期(见后述)。同时,在川滇地块空间尺度上M≥6.7地震也同步出现了超历史极限的平静期异常,2022年9月5日泸定MS6.8地震的发生结束了川滇地块长达26.59 a的M≥6.7地震平静期异常。
本文拟针对云南地区当前出现的强震超长时间平静现象,基于云南地区的强震活动特征,结合青藏高原、川滇地块强震活动状态,在更大的时空尺度上对该平静异常现象和问题及两地块间相互关系进行了深入分析和总结,并对云南地区的地震趋势进行讨论。
1. 云南地区强震超长时间平静
根据 《中国历史强震目录》 (公元前23世纪至1911年)和 《中国近代地震目录》 (1912—1990年)(国家地震局震害防御司,1995,1999), 《全球地震灾害信息目录(9999 BC—AD 2010) 》 (宋治平等,2011)和中国地震台网中心编制的全球M≥7.0地震目录,在保证目录完整的前提下,整理、编制了本研究使用的地震目录资料。
1.1 M≥6.7和M≥7.0地震活动特征
许多研究者对1900年以来云南地区强震活动的时空分布特征进行了研究(皇甫岗等,2000;苏有锦等,2001;苏有锦,李忠华,2011),其结果显示:云南地区M≥6.7强震在时间分布上明显呈现出以约10 a为尺度的活跃-平静分期特征;在空间分布上,以金沙江—红河断裂带为界,存在强震活动主体区东、西部交替现象。在云南地区地震活动性的统计研究中, “云南地区”通常定义为两个区域,即:① 以云南省行政区界外延50 km左右的不规则区域;② 包括全部云南省行政区的一个矩形区域(一般取21°N—29°N,97°E—106°E区域)。虽然由于统计空间和所使用地震目录资料不同,研究结果存在一定的差异性,但1900年以来明显存在四个强震活跃期,即:1913—1925年、1941(或1936)—1955年、1970—1979年和1988—1996年.
由于统计空间和地震目录不统一,对1900年以来的四个强震活跃期及相应平静期的认识和划分也在不断深化、完善(皇甫岗等,2013,2014)。1900年1月1日至1913年12月21日峨山M7.0地震后约14 a (13.97 a)内云南地区未发生M≥6.7地震;事实上再往前延伸,从1887年12月16日石屏M7.0地震至1913年12月21日峨山M7.0地震前约26 a (26.01 a)内,云南地区也无M≥6.7地震发生。根据云南地区历史地震记录情况,认为这一时期漏记M≥6.7的可能性不大(刘祖荫等,2002;宋治平等,2011;皇甫岗等,2013),这个约26 a的平静时段可能存在且可信,但对于该时段,尚无研究明确其是否为平静期。为了更全面、完整地分析云南地区1900年以来M≥6.7和M≥7.0地震活动特征,本研究把地震目录资料向前推移至1887年。
参照皇甫岗等(2013,2014)的划分方案,将1887年以来云南地区的M≥6.7地震目录、M≥6.7和M≥7.0地震活跃-平静分期及特征列于表1。1887年以来云南地区M≥6.7和M≥7.0地震的时序分布如图2所示。
表 1 云南地区M≥6.7和M≥7.0地震活跃-平静分期特征Table 1. Characteristics of active-quiet periods of earthquakes with M≥6.7 and M≥7.0 in Yunnan region序号 发震日期
年-月-日震中位置 震级 震中
位置间隔时间/a 活动分期 活动特征 北纬/° 东经/° M≥6.7 M≥7.0 M≥6.7 M≥7.0 0 1 887-12-16 23.70 102.50 7.0 石屏 第Ⅰ平静期 t=26.01 a
n=0
r=0t=26.9 a
n=0
r=01 1 913-12-21 24.15 102.45 7.0 峨山 26.01 t=12.00 a t=11.24 a 2 1 917-07-31 28.00 104.00 6.7 大关 3.61 3 1 923-06-22 22.75 98.75 7.3 缅甸 5.89 9.51 第Ⅰ活跃期 n=5 n=3 4 1 925-03-16 25.70 100.40 7.0 大理 1.73 1.73 r=0.42 r=0.42 5 1 925-12-22 21.00 101.50 6.8 老挝 0.77 第Ⅱ平静期 t=10.35 a
n=0
r=0t=16.17 a
n=0
r=06 1 936-04-27
1 936-05-1628.90
28.50103.60
103.606.7
6.7马边
马边10.35
0.057 1 941-05-16 23.60 99.40 7.0 耿马 5.00 16.17 t=19.41 a t=8.71 a 8 1 941-12-26 22.70 99.90 7.0 澜沧 0.61 0.61 第Ⅱ活跃期 n=9 n=3 9 1 942-02-01 23.10 100.30 6.7 思茅 0.10 r=0.46 r=0.34 10 1 950-02-03
1 950-02-0321.70
22.10100.10
99.907.0
6.7勐海
澜沧8.01
08.10
11 1 952-09-30 28.30 102.20 6.7 冕宁 2.66 12 1 955-09-23 26.60 101.80 6.7 永仁 2.98 第Ⅲ平静期 t=14.28 a
n=0
r=0t=19.92 a
n=0
r=013 1 970-01-05 24.20 102.68 7.8 通海 14.28 19.92 t=9.20 a t=6.40 a 14 1 971-04-28 23.00 101.10 6.7 思茅 1.31 n=7 n=4 15 1 974-05-11 28.20 104.10 7.1 大关 3.04 4.35 第Ⅲ活跃期 r=0.76 r=0.63 16 1 976-05-29
1 976-05-2924.50
24.6099.00
98.707.3/
7.4龙陵
龙陵2.05
02.05
017 1 976-11-07 27.60 101.10 6.7 盐源 0.44 1 8 1 979-03-15 23.20 101.10 6.8 宁洱 2.36 1 9 1 983-06-24 21.40 102.60 6.9 越南 4.27 第Ⅳ平静期 t=9.64 a
n=1
r=0.10t=12.22 a
n=0
r=020 1 988-11-06
1 988-11-0622.92
23.1699.79
99.557.4
7.2澜沧
耿马5.37
012.22
0t=7.24 a t=7.24 a 21 1 992-04-23
1 992-04-2322.30
22.6099.10
99.006.7
6.9缅甸
缅甸3.46
0第Ⅳ活跃期 n=6 n=4 22 1 995-07-12 22.00 99.30 7.3 缅甸 3.22 6.68 r=0.83 r=0.55 23 1 996-02-03 27.20 100.30 7.0 丽江 0.56 0.56 第Ⅴ平静期 t=27.49 a
n=0
r=0t=27.49 a
n=0
r=0注:表中t表示持续时间,单位为a;n表示地震次数;r表示年发生率,r=n/t。 ![]() 图 2 1887—2022年云南地区M≥6.7和M≥7.0地震M-t图图中彩色条带中数字为持续时间,下同Figure 2. M-t plot of M≥6.7 and M≥7.0 earthquakes in Yunnan region in the period of 1887−2022The numbers in color bar represent the duration,the same below
图 2 1887—2022年云南地区M≥6.7和M≥7.0地震M-t图图中彩色条带中数字为持续时间,下同Figure 2. M-t plot of M≥6.7 and M≥7.0 earthquakes in Yunnan region in the period of 1887−2022The numbers in color bar represent the duration,the same below由表1可见1887年以来云南地区经历的四个M≥6.7地震活跃期分别为:① 1913年12月21日—1925年12月22日(第Ⅰ活跃期),其间发生了5次M≥6.7地震(其中M≥7.0地震3次);② 1936年4月27日—1955年9月23日(第Ⅱ活跃期),其间发生了9次M≥6.7地震(其中3次M≥7.0地震);③ 1970年1月5日—1979年3月15日(第Ⅲ活跃期),其间发生了6次M≥6.7地震(其中4次M≥7.0地震);④ 1988年11月6日—1996年2月3日(第Ⅳ活跃期),其间发生了6次M≥6.7地震(其中4次M≥7.0地震)。四个活跃期的持续时间依次为12.00,19.41,9.20和7.24 a,活跃期中M≥6.7地震的年发生率依次为0.42,0.46,0.76和0.83。相应的四个平静期分别为1887年12月17日—1913年12月20日(第Ⅰ平静期)、1925年12月23日—1936年4月26日(第Ⅱ平静期)、1955年9月24日—1970年1月4日(第Ⅲ平静期)、1979年3月16日—1988年11月5日(第Ⅳ平静期),持续时间依次为26.01,10.35,14.28,9.64 a。
云南地区M≥7.0地震活跃-平静分期特征如下。四个活跃期分别为:1913年12月21日(峨山M7.0地震)—1925年3月16日(大理MS7.0地震),其间共有3次M≥7.0地震,为第Ⅰ活跃期;1941年5月16日(耿马MS7.0地震)—1950年2月3日(勐海MS7.0地震),其间共有3次M≥7.0地震,为第Ⅱ活跃期;1970年1月5日(通海MS7.8地震)—1976年5月29日(龙陵MS7.3,MS7.4地震),其间共有4次M≥7.0地震,为第Ⅲ活跃期;1988年11月6日(澜沧MS7.4,耿马MS7.2地震)—1996年2月3日(丽江MS7.0地震),其间共有4次M≥7.0地震,为第Ⅳ活跃期。四个活跃期的持续时间依次为11.24,8.71,6.40,7.24 a,M≥7.0地震年发生率依次为0.27,0.34,0.63,0.55。相应的四个平静期分别为1887年12月17日—1913年12月20日(第Ⅰ平静期)、1925年3月17日—1941年5月15日(第Ⅱ平静期)、1950年2月4日—1970年1月4日(第Ⅲ平静期)、1976年5月30日—1988年11月5日(第Ⅳ平静期),持续时间依次为26.01,16.17,19.92,12.22 a。由以上分析可见,在地震强度、频次和时间丛集度上第Ⅲ和第Ⅳ活跃期明显强于第Ⅰ和第Ⅱ活跃期强。
从1996年2月3日丽江M7.0地震至今为第Ⅴ平静期,M≥6.7和M≥7.0地震平静时间已长达27.55 a,均已超过1887年以来26.01 a或1900年以来19.92 a的最长平静时间且仍在持续中。
1.2 与青藏高原M≥7.0地震活动的关系
对于青藏高原地区(图1a 所示区域),一般认为1900年以来的M≥7.0地震目录是完整的(有仪测地震),而1900年之前存在不完整的问题。为了更全面地、完整地分析青藏高原1900年以来的地震活动状态,我们适当向前推移,使用了1879年以来的地震目录资料(补充1879—1899年时段的资料,作参考)。图3 给出了1879年以来青藏高原M≥7.0地震时序分布图(M-t图和时间间隔dt-t图)。
![]() 图 3 1880—2022年青藏高原M≥7.0地震时序分布(a) M-t图;(b) 时间间隔dt-t图,tavg为青藏高原M≥7.0平均间隔时间;1std为1倍均方差线;2std为2倍均方差线,下同Figure 3. Distribution with time series for M≥7.0 earthquakes in Qinghai-Xizang Plateau in 1880−2022(a) M-t;(b) dt-t, where tavg represent the mean time interval for M≥7.0 earthquake in Qinghai-Xizang Plateau,1std represent the 1 time mean square variance,2std represent the 2 times mean square variance,the same below
图 3 1880—2022年青藏高原M≥7.0地震时序分布(a) M-t图;(b) 时间间隔dt-t图,tavg为青藏高原M≥7.0平均间隔时间;1std为1倍均方差线;2std为2倍均方差线,下同Figure 3. Distribution with time series for M≥7.0 earthquakes in Qinghai-Xizang Plateau in 1880−2022(a) M-t;(b) dt-t, where tavg represent the mean time interval for M≥7.0 earthquake in Qinghai-Xizang Plateau,1std represent the 1 time mean square variance,2std represent the 2 times mean square variance,the same below青藏高原1900年以来经历了三个M≥7.0地震活跃期,分别为1904—1956年(1904年8月30日四川道孚M7.5地震—1956年7月16日缅甸MS7.0地震)、1970—1976年(1970年1月5日云南通海MS7.8地震—1976年8月23日四川松潘MS7.2地震)和1988年至今(1988年8月6日缅甸MS7.2地震至今);三个活跃期M≥7.0地震次数n,持续时间t,年发生率r依次为n=48,t=51.89 a,r=0.93;n=9,t=6.63 a,r=1.36;n=29,t=32.77 a,r=0.88。平静期分别为1897—1904年(1897年6月13日—1904年8月29日),1956—1970年(1956年7月17日—1970年1月4日)和1976—1988年(1976年8月24日—1988年8月5日),持续时间分别为7.22,13.47,11.95 a (图3)。
青藏高原1970—1976年活跃期相较于1904 —1956年和1988年至今的两个活跃期,其持续时间非常短(仅持续了6.63 a),且无M≥8.0地震发生;但在6.63 a内密集发生了9次M≥7.0地震(最大地震为M7.8),丛集活动特征明显,且其前后有两个非常显著的平静期,因此仍将其作为一个活跃期进行了划分。本文结果与邓起东等(2014)的结果有较大差异,他们认为青藏高原1900年以来经历过三个活动丛集期,分别为1920—1937年“海原—古浪地震系列” 、1947—1976年“察隅—当雄地震系列”和1995年到现在的“昆仑—汶川地震系列” ,这种划分差异主要在于他们关于青藏高原地震的统计中未包括东构造结缅甸弧地区的地震,而本文将这个区域的地震囊括在内。
从青藏高原空间尺度上看(图3a),云南地区M≥7.0地震的第 Ⅰ 和第 Ⅱ 活跃期与第 Ⅰ 和第 Ⅱ 平静期均发生在青藏高原M≥7.0地震第Ⅰ活跃期(1904—1956年)中,第 Ⅲ 活跃期发生在青藏高原第 Ⅱ 活跃期(1970—1976年)中,第Ⅳ活跃期发生在青藏高原第Ⅲ活跃期(1988年至今)中;第Ⅲ和Ⅳ平静期与青藏高原1956—1970年、1976—1988年两个平静期基本一致(即同步平静)。这显示出云南地区第 Ⅰ 和第 Ⅱ 平静期与第Ⅲ和第Ⅳ平静期所处的周边地震活动环境(青藏高原地震活动状态)有很大差异性:即第 Ⅰ 和第Ⅱ平静期是在青藏高原M≥7.0地震处于活跃状态的背景下出现的(即云南地区平静,青藏高原活跃),而第Ⅲ和第Ⅳ平静期则与青藏高原平静期基本一致(即云南地区平静,青藏高原也平静)。当前的第Ⅴ平静期也是在青藏高原活跃状态下出现的,即其周边地震活动环境与第 Ⅰ 和第Ⅱ平静期相似。图4给出了云南地区5个M≥7.0地震平静期对应的青藏高原M≥7.0地震震中分布图。
![]() 图 4 云南地区5个M≥7.0地震平静期内青藏高原M≥7.0地震震中分布图Figure 4. Distribution of M≥7.0 earthquakes in Qinghai-Xizang Plateau during five quiescence periods of M≥7.0 earthquakes in Yunnan region
图 4 云南地区5个M≥7.0地震平静期内青藏高原M≥7.0地震震中分布图Figure 4. Distribution of M≥7.0 earthquakes in Qinghai-Xizang Plateau during five quiescence periods of M≥7.0 earthquakes in Yunnan region云南地区周边地震活动环境的这种显著差异性是否预示着其后续地震趋势的差异性,这是一个值得深入探讨的问题。上述云南地区第 Ⅰ 和第Ⅱ活跃期,从地震强度、频次和时间丛集度上均比第Ⅲ和第Ⅳ活跃期弱。云南地区两个“强活跃期”(第Ⅲ和第Ⅳ活跃期)可能是在整个青藏高原均处于平静状态的背景下形成的,具有其特殊性和显著性;当前云南地区处于27.55 a的超长时间平静期(第Ⅴ平静期),其所处的青藏高原地震活动状态与第中 Ⅰ 和第Ⅱ平静期相似,其后续地震趋势可能与第 Ⅰ 和第Ⅱ活跃期相似,即可能是相对“弱活跃期”。这是从历史震例类比中注意到的一个现象或得到的一种推断。
2. 沪定MS6.8地震结束了川滇地块M≥6.7地震超长时间平静
以鲜水河—安宁河—小江断裂和金沙江—红河断裂为主要边界带的川滇地块是川滇地区的一个主要地震构造区。川滇地块又划分为川西地块和滇中地块(苏有锦,秦嘉政,2001),川西地块现代构造运动比滇中地块强烈,川西地块的滑动速率为 5.4—7.6 mm/a,滇中地块约为3 mm/a;川西地块地震活动水平(地震应变释放)比滇中地块高两倍左右,可能与这两个地块的现代构造运动状态差异有关(苏有锦等,2001)。
川滇地块1880年以来共发生M≥6.7地震18次,图5给出了1880年以来川滇地块M≥6.7地震M-t。川滇地块1887年以来经历了两个M≥6.7地震活跃期,分别为1887—1925年和1948—1996年,两个活跃期M≥6.7地震的次数n、持续时间t、年发生率r依次为n=6,t=37.26 a,r=0.16与n=12,t=47.69 a,r=0.25;两个平静期为1925—1948年和1996—2022年,持续时间t分别为23.19 a和26.59 a。
![]() 图 5 1880—2022年川滇地块M≥6.7地震时序分布图(a) M-t图;(b) 时间间隔dt-t图Figure 5. Distribution of M≥6.7 earthquake with time in Sichuan-Yunnan block (1880−2022)(a) M-t;(b) Time interval dt-t
图 5 1880—2022年川滇地块M≥6.7地震时序分布图(a) M-t图;(b) 时间间隔dt-t图Figure 5. Distribution of M≥6.7 earthquake with time in Sichuan-Yunnan block (1880−2022)(a) M-t;(b) Time interval dt-t1996年丽江M7.0地震后,川滇地块与云南地区同步出现了M≥6.7地震平静。2022年9月5日四川泸定县发生了MS6.8地震(震中位于29.59°N,102.08°E,震源深度为16 km),该地震位于鲜水河断裂带南东段的磨西断裂(An et al,2023)。泸定MS6.8地震的发生结束了川滇地块自1996年丽江MS7.0地震以来长达约26.59 a的M≥6.7地震平静异常。如果类比1925—1948年平静期,泸定MS6.8地震后,川滇地块可能会进入一个新的M≥6.7地震活跃时段,持续时间为40—50 a,M≥6.7地震年发生率为0.16—0.25。同时表明,滇中地块(主要涉及云南中东部地区)发生M≥6.7地震的危险性和紧迫性进一步增强。
3. 巴颜喀拉地块与川滇地块强震交替活动特征
巴颜喀拉地块和川滇地块属青藏Ⅰ级地块区的两个相邻的Ⅱ级地块(张培震等,2003),鲜水河断裂带为其共同边界。
巴颜喀拉地块和川滇地块1880年以来M≥6.7地震震中分布图及其时序分布图(M-t图)如图6所示。由图6b可见,巴颜喀拉地块1880年以来经历过三个M≥6.7地震丛集活动时期,分别为1923—1947年、1960—1976年和1997年至今;川滇地块经历过两个M≥6.7地震丛集活动过程,分别为1887—1925年和1948—1996年。对比两个地块的地震活动状态(图6b中①,②,③,④时段),可以看出巴颜喀拉地块与川滇地块M≥6.7地震活动存在“巴颜喀拉地块活跃-川滇地块平静,川滇地块活跃-巴颜喀拉地块弱”的交替活跃特征。由此推断,2022年9月5日四川泸定MS6.8地震后,川滇地块进入活跃时段,巴颜喀拉地块可能会转入相对弱活动时段。
![]() 图 6 1880—2022年巴颜喀拉地块和川滇地块M≥6.7地震的分布(a) 震中分布图;(b) 时序分布图M-t图,①,②,③,④为划分的4个时段Figure 6. Distribution of M≥6.7 earthquakes in Bayan Har block and Sichuan-Yunnan block in 1880−2022(a) Distribution of epicenters;(b) M-t plot,where ①,②,③ and ④ represent four divided periods
图 6 1880—2022年巴颜喀拉地块和川滇地块M≥6.7地震的分布(a) 震中分布图;(b) 时序分布图M-t图,①,②,③,④为划分的4个时段Figure 6. Distribution of M≥6.7 earthquakes in Bayan Har block and Sichuan-Yunnan block in 1880−2022(a) Distribution of epicenters;(b) M-t plot,where ①,②,③ and ④ represent four divided periods4. 讨论与结论
不同时空尺度的地震活动时、空丛集特征(时、空非均匀性)是普遍存在的,基于此提出了地震活跃期-平静期(或活跃时段-平静时段)和主体活动区的概念,这些概念及其分析方法在地震大形势分析研判中一直被广泛应用。
对云南地区百年时间尺度的M≥6.7和M≥7.0地震活动规律总结和认识,需不断深化、完善(皇甫岗等,2013,2014)。需要讨论的是,2011年3月24日缅甸孟帕亚MS7.2地震,其震中位置(20.80°N,99.80°E)正好位于云南地区统计区域(21°N—29°N,97°E—106°E)边缘(图1a),对于该地震是否应该纳入云南地区M≥6.7或M≥7.0地震活动规律的统计分析中,皇甫岗等(2013,2014)认为,缅甸孟帕亚MS7.2地震与云南地区地震活动构造相连,动力同源,应纳入云南地区M≥6.7地震活动特征的统计研究中,并认为缅甸孟帕亚MS7.2地震标志着云南地区已进入新一轮强震活跃期。但至今12 a过去了,云南地区仍未发生过M≥6.7地震,仍不具备活跃期的统计特征(年发生率)。因此,缅甸孟帕亚MS7.2地震是否纳入统计,对云南地区M≥6.7地震活动规律的认识不会产生明显影响。如果纳入统计,从1996年丽江MS7.0地震至今27.49 a的时间里仅发生一次M7.2地震,M≥6.7地震年发生率约为0.04,显著低于云南地区活跃期M≥6.7地震年发生率0.42—0.83 (低一个数量级),仍是平静期特征;如果不纳入统计,即为当前长达27.55 a的超长时间平静期特征。
由图1b所示,M≥6.7地震活动主要分布在安宁河—小江断裂带、红河断裂带和澜沧江断裂带三个强震活动带。事实上,地震活动性统计区域的确定有很大的人为性,人们通常选取地震相对集中分布且具有一定构造联系的区域来确定统计研究的空间范围。关于统计空间范围变化对云南地区M≥6.7地震活跃-平静分期划分的影响问题,皇甫岗等(2013)通过适当扩大或缩小统计空间进行了对比分析,认为其分期特征基本一致(即无明显影响),这表明,云南地区M≥6.7地震10年尺度活跃-平静的分期特征可能是一个规律性特征。关于统计震级下限问题,通常是根据云南地区地震时序图像(M-t图)“人工识别”选取震级下限为M6.7 (皇甫岗等,2000;刘祖荫等,2002;皇甫岗,秦嘉政,2006)。苏有锦等(2001)给出了云南地区M≥5.0地震的年均能量释放水平为${E}^{1/2} {\text{≈}} 3.0 {\text{×}}{10}^{7}\,{{\mathrm{J}}}^{1/2}$,相当于一次约为M6.7的地震(按地震能量-震级公式${\mathrm{lg}}E=4.8+1.5M$),则M6.7地震可能是云南地区年均地震能量释放水平,表明选取M6.7作为下限震级有统计上的合理性。从统计意义上理解,若某个空间尺度或区域内有一个相对稳定的地震能量释放水平,那么一个较长时间的强震平静(平静期)后,会出现一个集中释放过程(活跃期);反之一个集中释放过程后,会有一个平静时段。
青藏高原1956—1988年时段的地震活动状态与其前(1904—1956年)、后(1988年至今)两个时段的地震活动状态有很大差异(图3),尤其是青藏高原1956—1970年和1976—1988年两个非常显著平静期是否存在更大空间尺度的地震活动背景,尚待商榷。从东亚大陆大三角区(以下简称大三角区)空间尺度上作进一步分析、讨论。已有相关研究认为,大三角区1800年以来M≥8.0地震的记录基本上是完整的(Bilham et al,2001;傅征祥等,2003,2012)。图7给出了大三角区1800年以来M≥8.0地震震中分布图及其时序分布图(M-t图和时间间隔dt-t图)。自1800年以来大三角区经历了一次完整的M≥8.0地震活动过程(图7b中红色虚线):1840—1878年为M≥8.0地震平静时段(40.27 a),1879—1957年为M≥8.0地震活跃时段(78.41 a),整个过程持续时间为118.68 a。2001年11月14日昆仑山口西MS8.1地震的发生打破了大三角区自1957年蒙古MS8.3地震后持续了43.94 a的M≥8.0地震平静状态,之后发生了2008年汶川MS8.0地震和2015年尼泊尔MS8.1地震,表明大三角区可能又进入一个新的M≥8.0地震活跃时段。
![]() 图 7 1800—2022年大三角区内M≥8.0地震震中分布图(a)、M-t图(b)和时间间隔dt-t图(c)Figure 7. Distribution of M≥8.0 earthquakes (1800−2022) in Big Triangle area of East Asian continent (a),M-t (b),time interval dt-t (c)
图 7 1800—2022年大三角区内M≥8.0地震震中分布图(a)、M-t图(b)和时间间隔dt-t图(c)Figure 7. Distribution of M≥8.0 earthquakes (1800−2022) in Big Triangle area of East Asian continent (a),M-t (b),time interval dt-t (c)对比大三角区与青藏高原地震活动状态可见(图3,图7),青藏高原1904—1956年M≥7.0地震活跃时段对应于大三角区1879—1957年M≥8.0地震活跃时段;青藏高原1956—1988年M≥7.0 地震出现的两个非常显著平静期时段对应于1957—2001年大三角区M≥8.0地震平静时段。青藏高原1988年至今M≥7.0地震处于活跃时段,大三角区2001年以来也进入一个新的M≥8.0地震活跃时段。表明青藏高原M≥7.0地震活跃时段与大三角区M≥8.0地震活跃时段基本一致,而青藏高原两个非常显著的平静期出现在大三角区M≥8.0地震平静时段。这可能是一个很有意义的现象,值得持续关注。如果类比大三角区1840—1957年的M≥8.0地震活动过程,未来较长时间(几十年)大三角区仍将处于M≥8.0地震活跃时段,青藏高原也仍将处于M≥7.0地震活跃时段。
通过以上分析和讨论,得到以下基本认识:
1) 本文对云南地区、川滇地块和青藏高原M≥6.7或M≥7.0地震活动状态分析表明,在这三个空间尺度上,均存在活跃-平静交替发生的分期特征。
云南地区1887年以来经历过的M≥6.7地震的四个活跃期分别为1913—1925年、1936—1955年、1970—1979年、1988—1996年,相应的持续时间依次为12.00,19.41,9.20,7.24 a,平均为(11.96±5.35) a;四个平静期分别为1887—1913年、1925—1936年、1955—1970年、1979—1988年,相应的持续时间依次为26.01,10.35,14.28,9.64 a,平均为(15.07±7.57) a。M≥7.0地震的四个活跃期分别为1913—1925年、1941—1950年、1970—1976年、1988—1996年,相应的持续时间依次为11.24,8.71,6.40,7.24 a,平均为(8.40±2.12) a;四个平静期分别为1887—1913年、1925—1941年、1950—1970年、1976—1988年,相应的持续时间依次为26.01,16.17,19.92,12.22 a,平均为(18.58±5.87) a。云南地区在活跃期中M≥6.7地震的年发生率为0.42—0.83,M≥7.0地震的年发生率为0.27—0.63。
川滇地块1887年以来经历过的M≥6.7地震的两个活跃期为1887—1925年和1948—1996年,相应的持续时间分别为37.26 a和47.69 a,平均为(42.47±7.38) a;两个平静期分别为1925—1948年和1996—2022年,相应的持续时间分别为23.19 a和26.59 a,平均为(24.89±2.40) a。川滇地块在活跃期中M≥6.7地震的年发生率为0.16—0.25。
青藏高原1897年以来经历过M≥7.0地震的三个活跃期,分别为1904—1956年、1970—1976年,1988年至今,相应的持续时间依次为51.89,6.63,32.77 a,三个平静期分别为1897—1904年、1956—1970年、1976—1988年,相应的持续时间依次为7.22,13.47,11.95 a,平均为(10.88±3.26) a。青藏高原在活跃期中M≥7.0地震的年发生率为0.88—1.36。表2给出了青藏高原、川滇地块、云南地区在活跃期中M≥6.7或M≥7.0地震的年发生率,这些基本统计特征对地震趋势研判具有参考意义。
表 2 青藏高原、川滇地块、云南地区在活跃期中M≥6.7或M≥7.0地震的年发生率Table 2. Annual occurrence rate of M≥6.7 or M≥7.0 earthquakes during the active period in Qinghai-Xizang Plateau,Sichuan-Yunnan block and Yunnan region空间尺度 地震年发生率 M≥6.7 M≥7.0 青藏高原 0.88—1.36 川滇地块 0.16—0.25 云南地区 0.42—0.83 0.27—0.63 2) 云南地区1887年以来五个M≥7.0地震平静期所处的周边地震活动环境有很大差异性:第 Ⅰ , Ⅱ , Ⅴ 平静期出现在青藏高原M≥7.0地震活跃状态中(即云南地区平静,但青藏高原活跃),第Ⅲ和第Ⅳ平静期出现在青藏高原M≥7.0地震平静状态中(即云南地区平静,青藏高原也平静)。当前云南地区出现的27.55 a超长时间平静(第 Ⅴ 平静期),其所处的周边地震活动环境与第 Ⅰ 和第 Ⅱ 平静期相似。据此推断,其后续地震趋势可能与第Ⅰ和第Ⅱ活跃期相似,即相对弱的活跃期特征。
3) 未来较长时间(几十年)青藏高原可能仍将处于M≥7.0地震活跃时段。
4) 2022年泸定MS6.8地震的发生结束了川滇地块自1996年丽江M7.0地震以来长达约26.59 a的M≥6.7地震平静异常,川滇地块可能会进入一个新的M≥6.7地震活跃时段。
5) 巴颜喀拉地块与川滇地块M≥6.7地震活动存在活动主体区交替活动特征:巴颜喀拉地块活跃-川滇地块平静,川滇地块活跃-巴颜喀拉地块弱。由此推断,2022年9月5日四川泸定MS6.8地震后,川滇地块进入活跃时段,巴颜喀拉地块可能会转入相对弱活动时段。
以上是从有限样本量统计或历史震例类比得到的一种推断,其正确性尚需检验,物理机制或解释仍需要进一步研究。
-
![]()
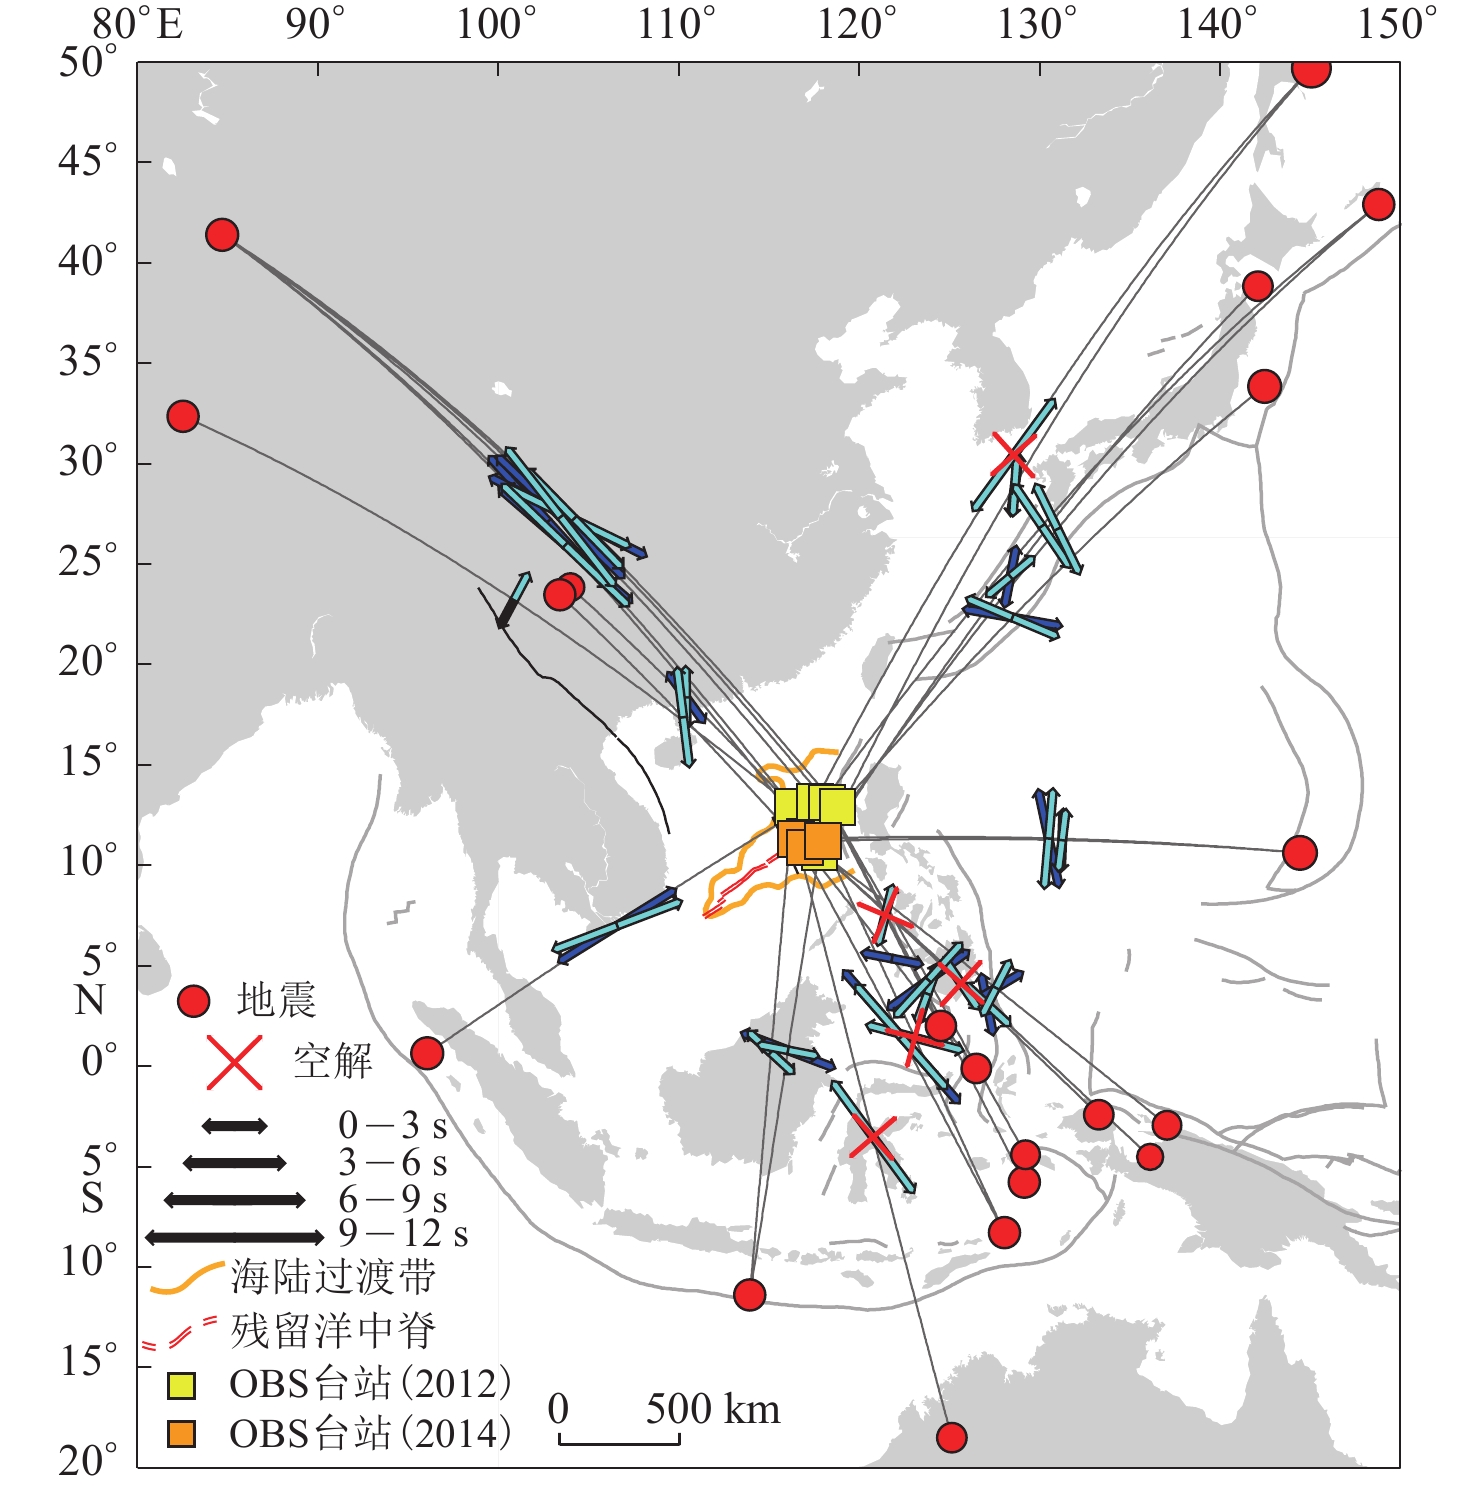
图 2 (a) 布设的海底地震仪及提供了有用的区域S波震相分裂解的20次区域地震的分布;(b) 中央海盆的地震仪分布;(c) 提供了有用的SKS震相分裂解的两次远震的分布
Figure 2. (a) The deployed ocean bottom seismometers and the distribution of regional earthquakes which provide useful regional S-wave splitting results;(b) The enlarged version of the distribution of OBSs in central basin;(c) The distribution of the two global earthquakes which provids useful SKS splitting results
![]()
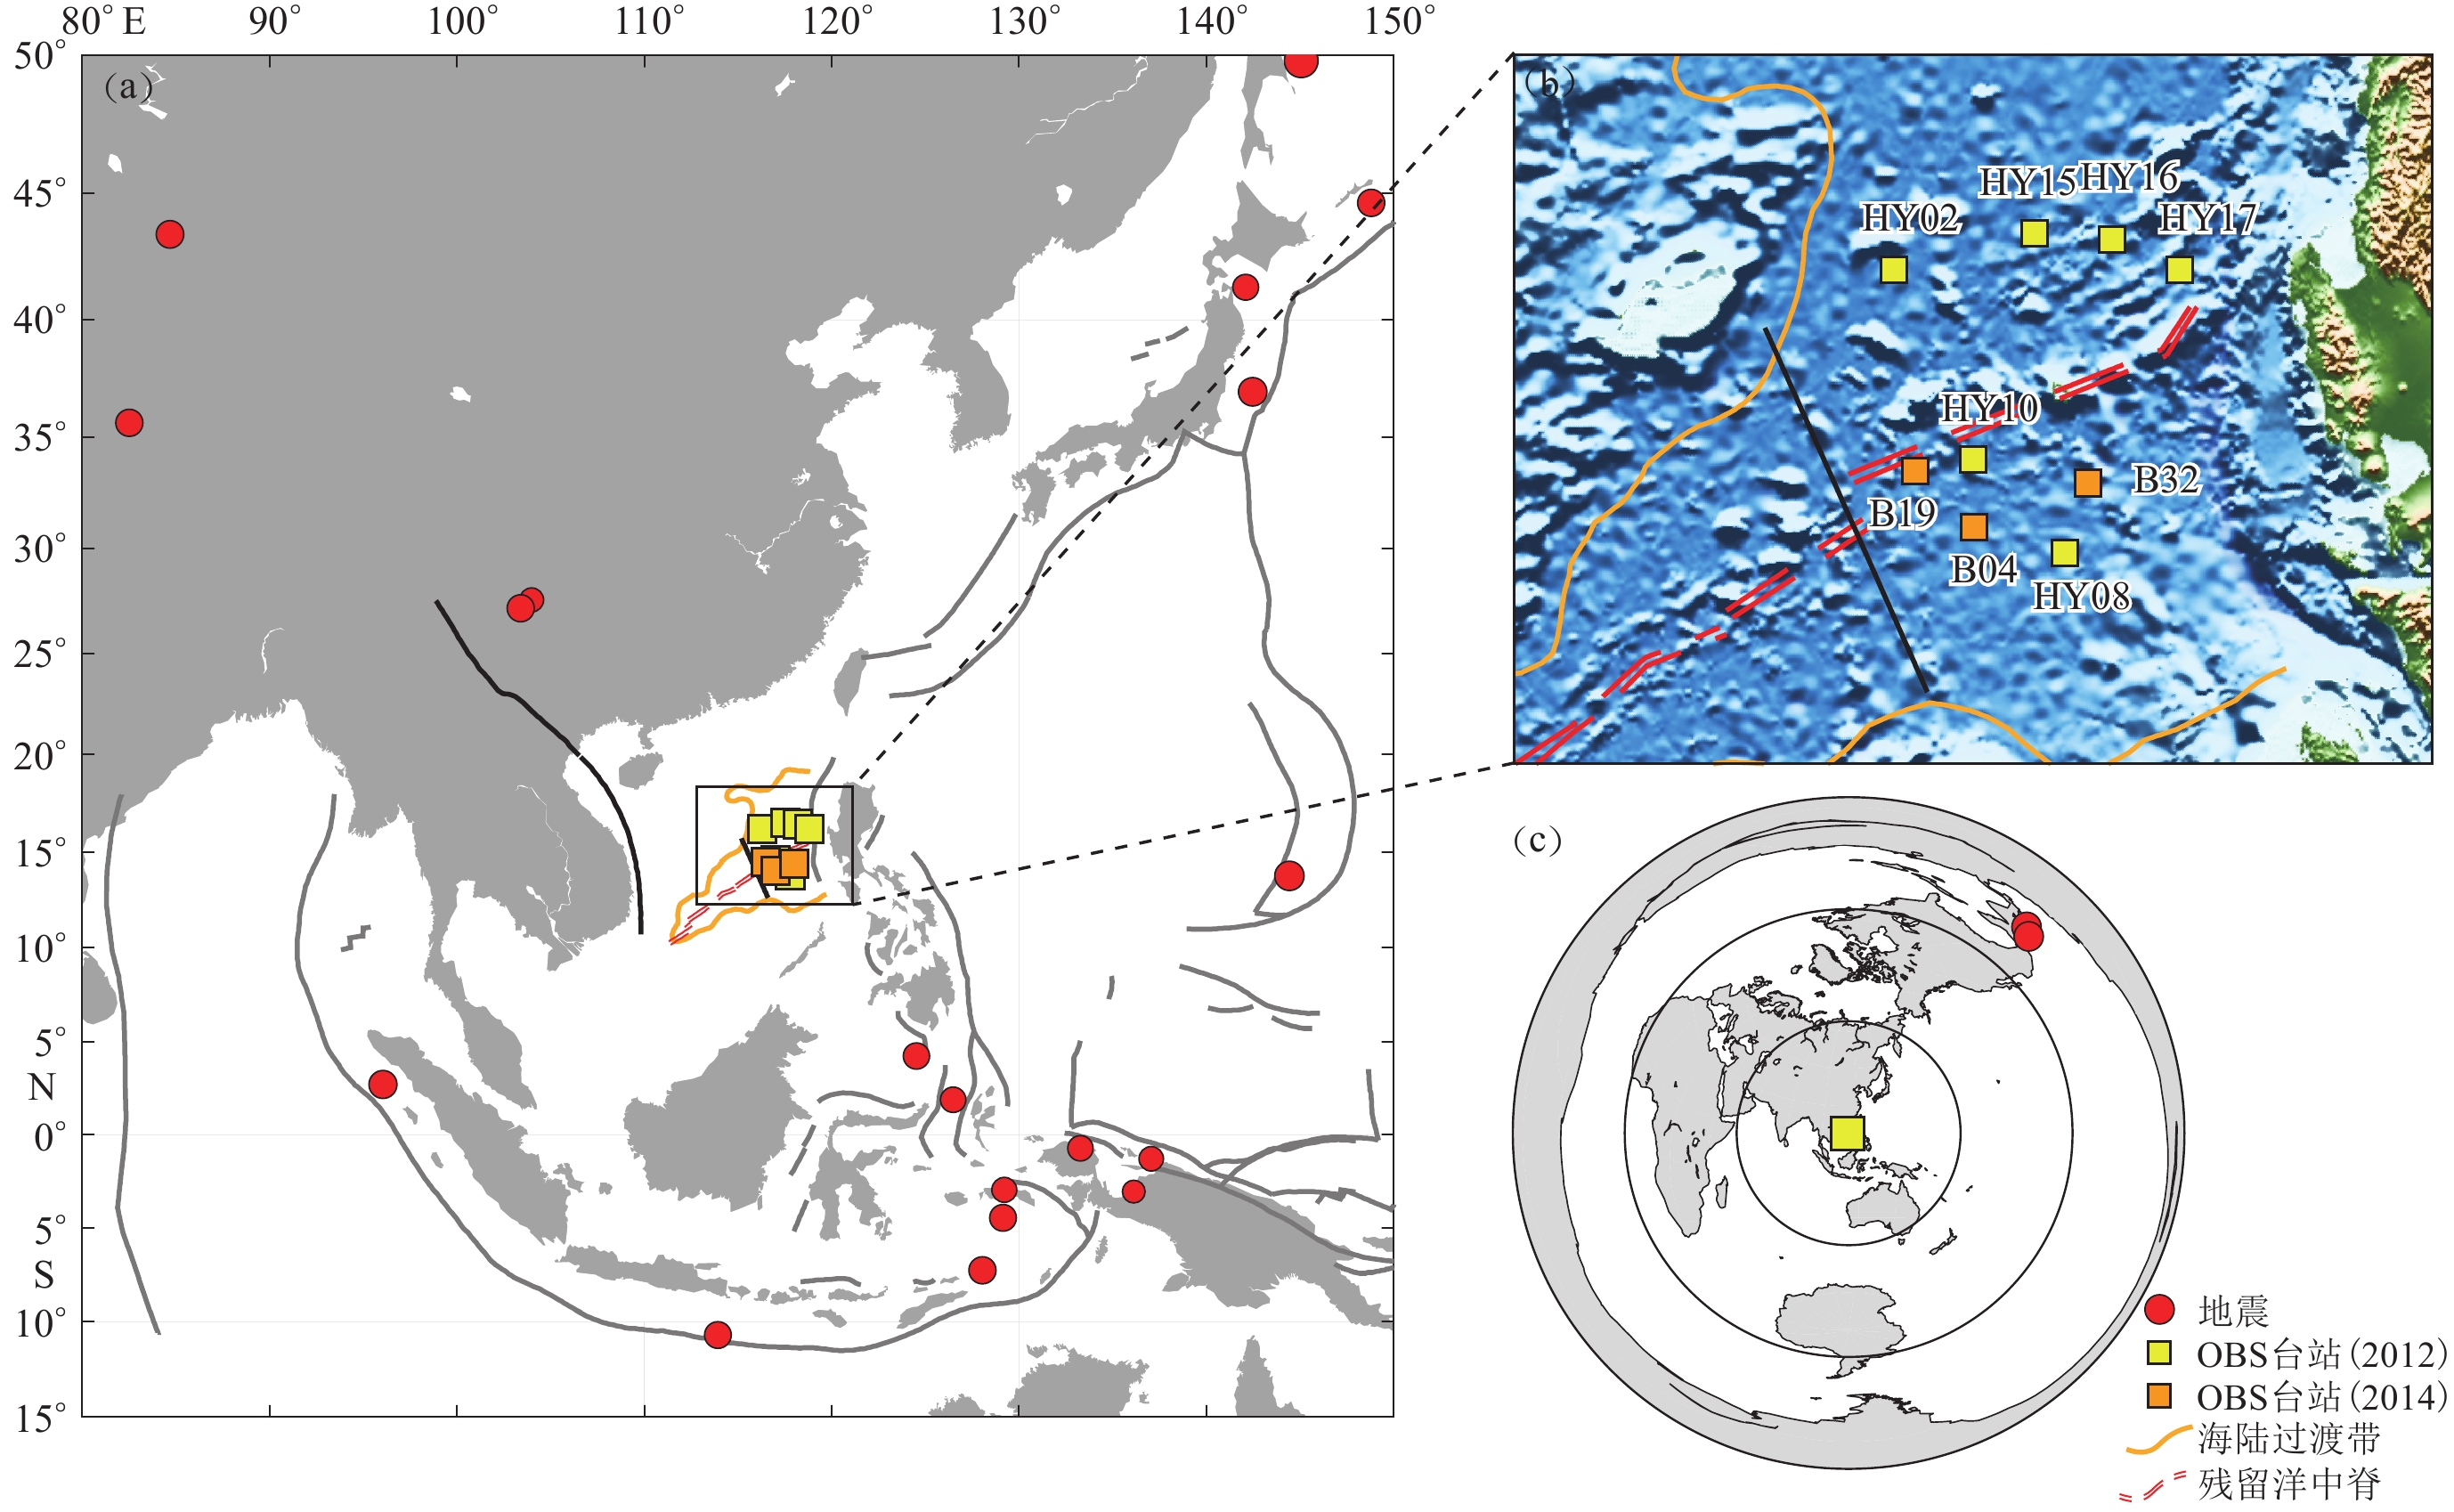
图 1 南海区域构造地质、地震台站及历史地震分布图
南海的海陆过渡带位置参考Li和Song(2012),马尼拉海沟位置来自Jiang和Wang(2021);其中中南断裂和残留洋中脊的位置来自Zhao 等(2019),红河断裂带来自Yang 等 (2015)。箭头表示板块的绝对运动方向(Gripp,Gordon,2002)
Figure 1. Tectonics of South China Sea and the distributions of seismic stations as well as history seismic events
Continental Ocean Boundaryof South China Sea refers to Li and Song (2012),and the location of Manila trench is from Jiang and Wang (2021). The locations of Zhongnan fault and the remnant mid-ocean ridges are from Zhao et al (2019) and the location of Red River Fault is from Yang et al (2015). Black arrows indicate the absolute plate motions (Gripp,Gordon,2002)
![]()
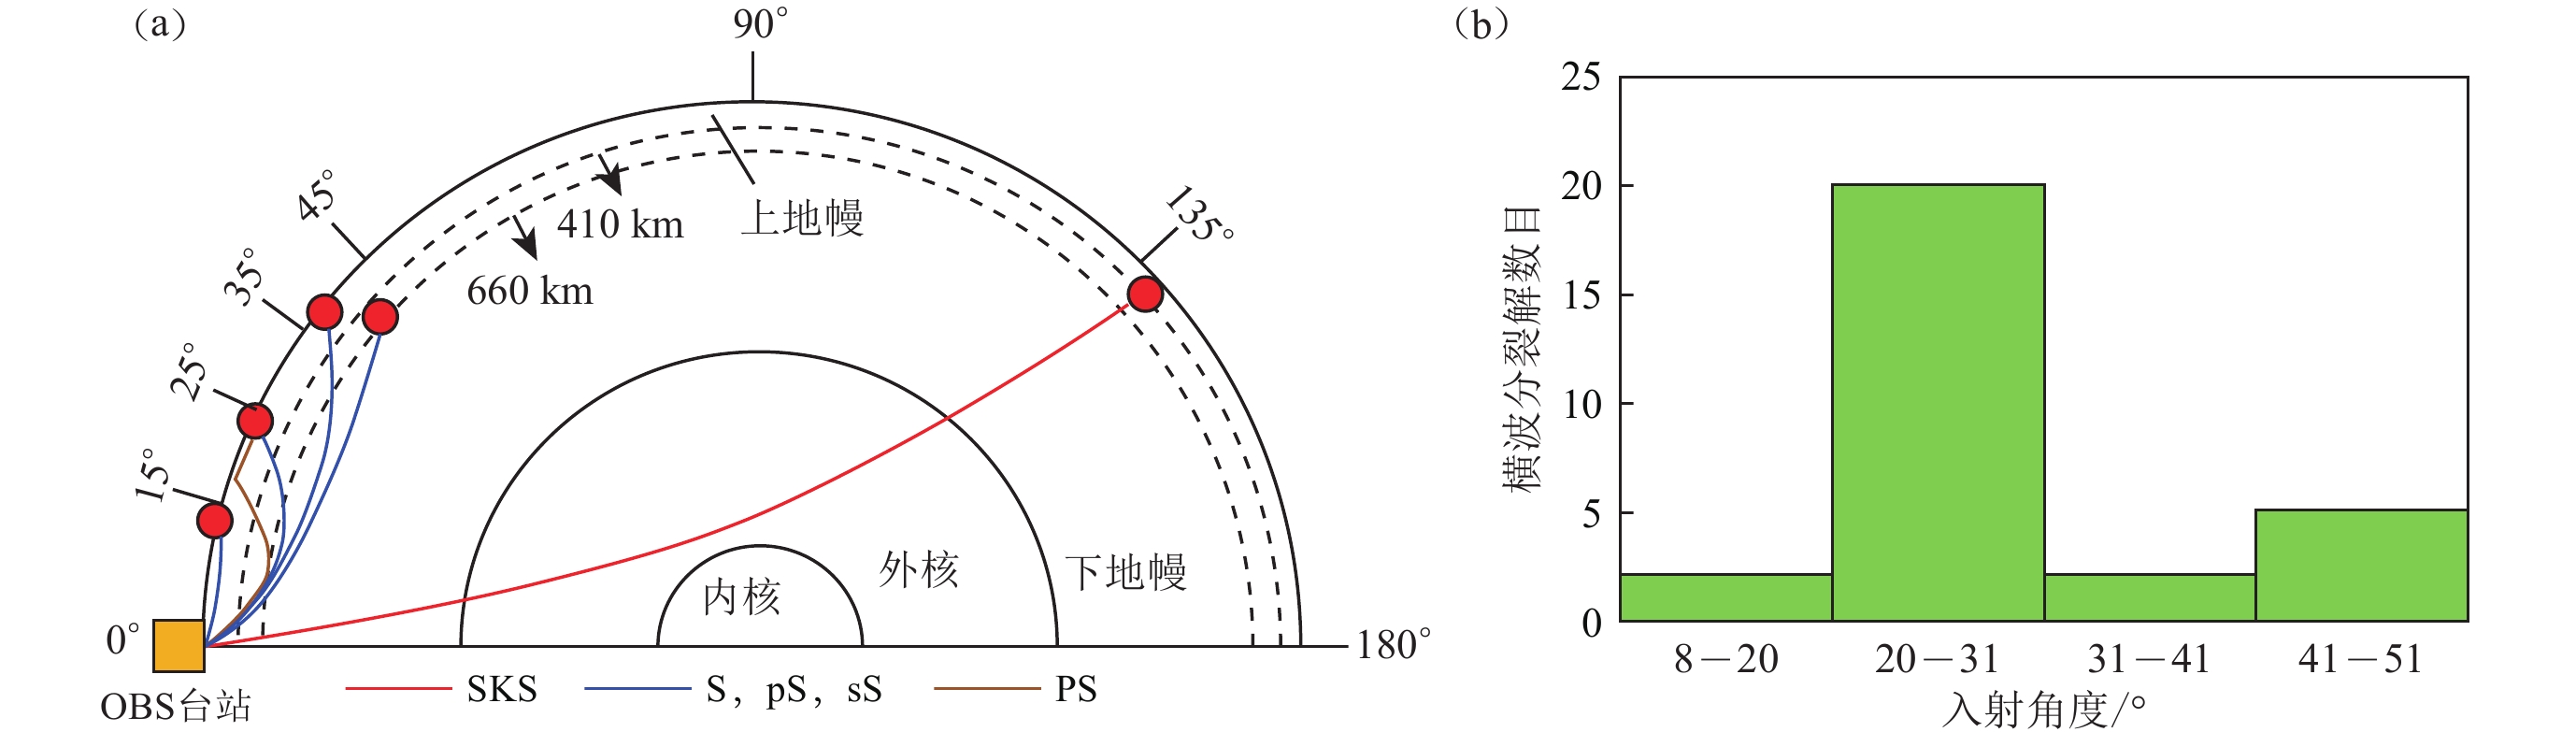
图 3 (a) 利用Taup软件并采用IASP91速度模型得到的SKS,S,pS,sS和PS震相射线路径示意图;(b)文中提供有用横波分裂解的S震相的入射角度统计图
Figure 3. (a) Schematic raypaths of SKS,S,pS,sS,and PS phases obtained using the Taup package and the IASP91 velocity model (Kennett,Engdahl,1991;Crotwell et al,1999);(b) Statistical histogram of the incident angles of the S phases used in shear-wave splitting
![]()
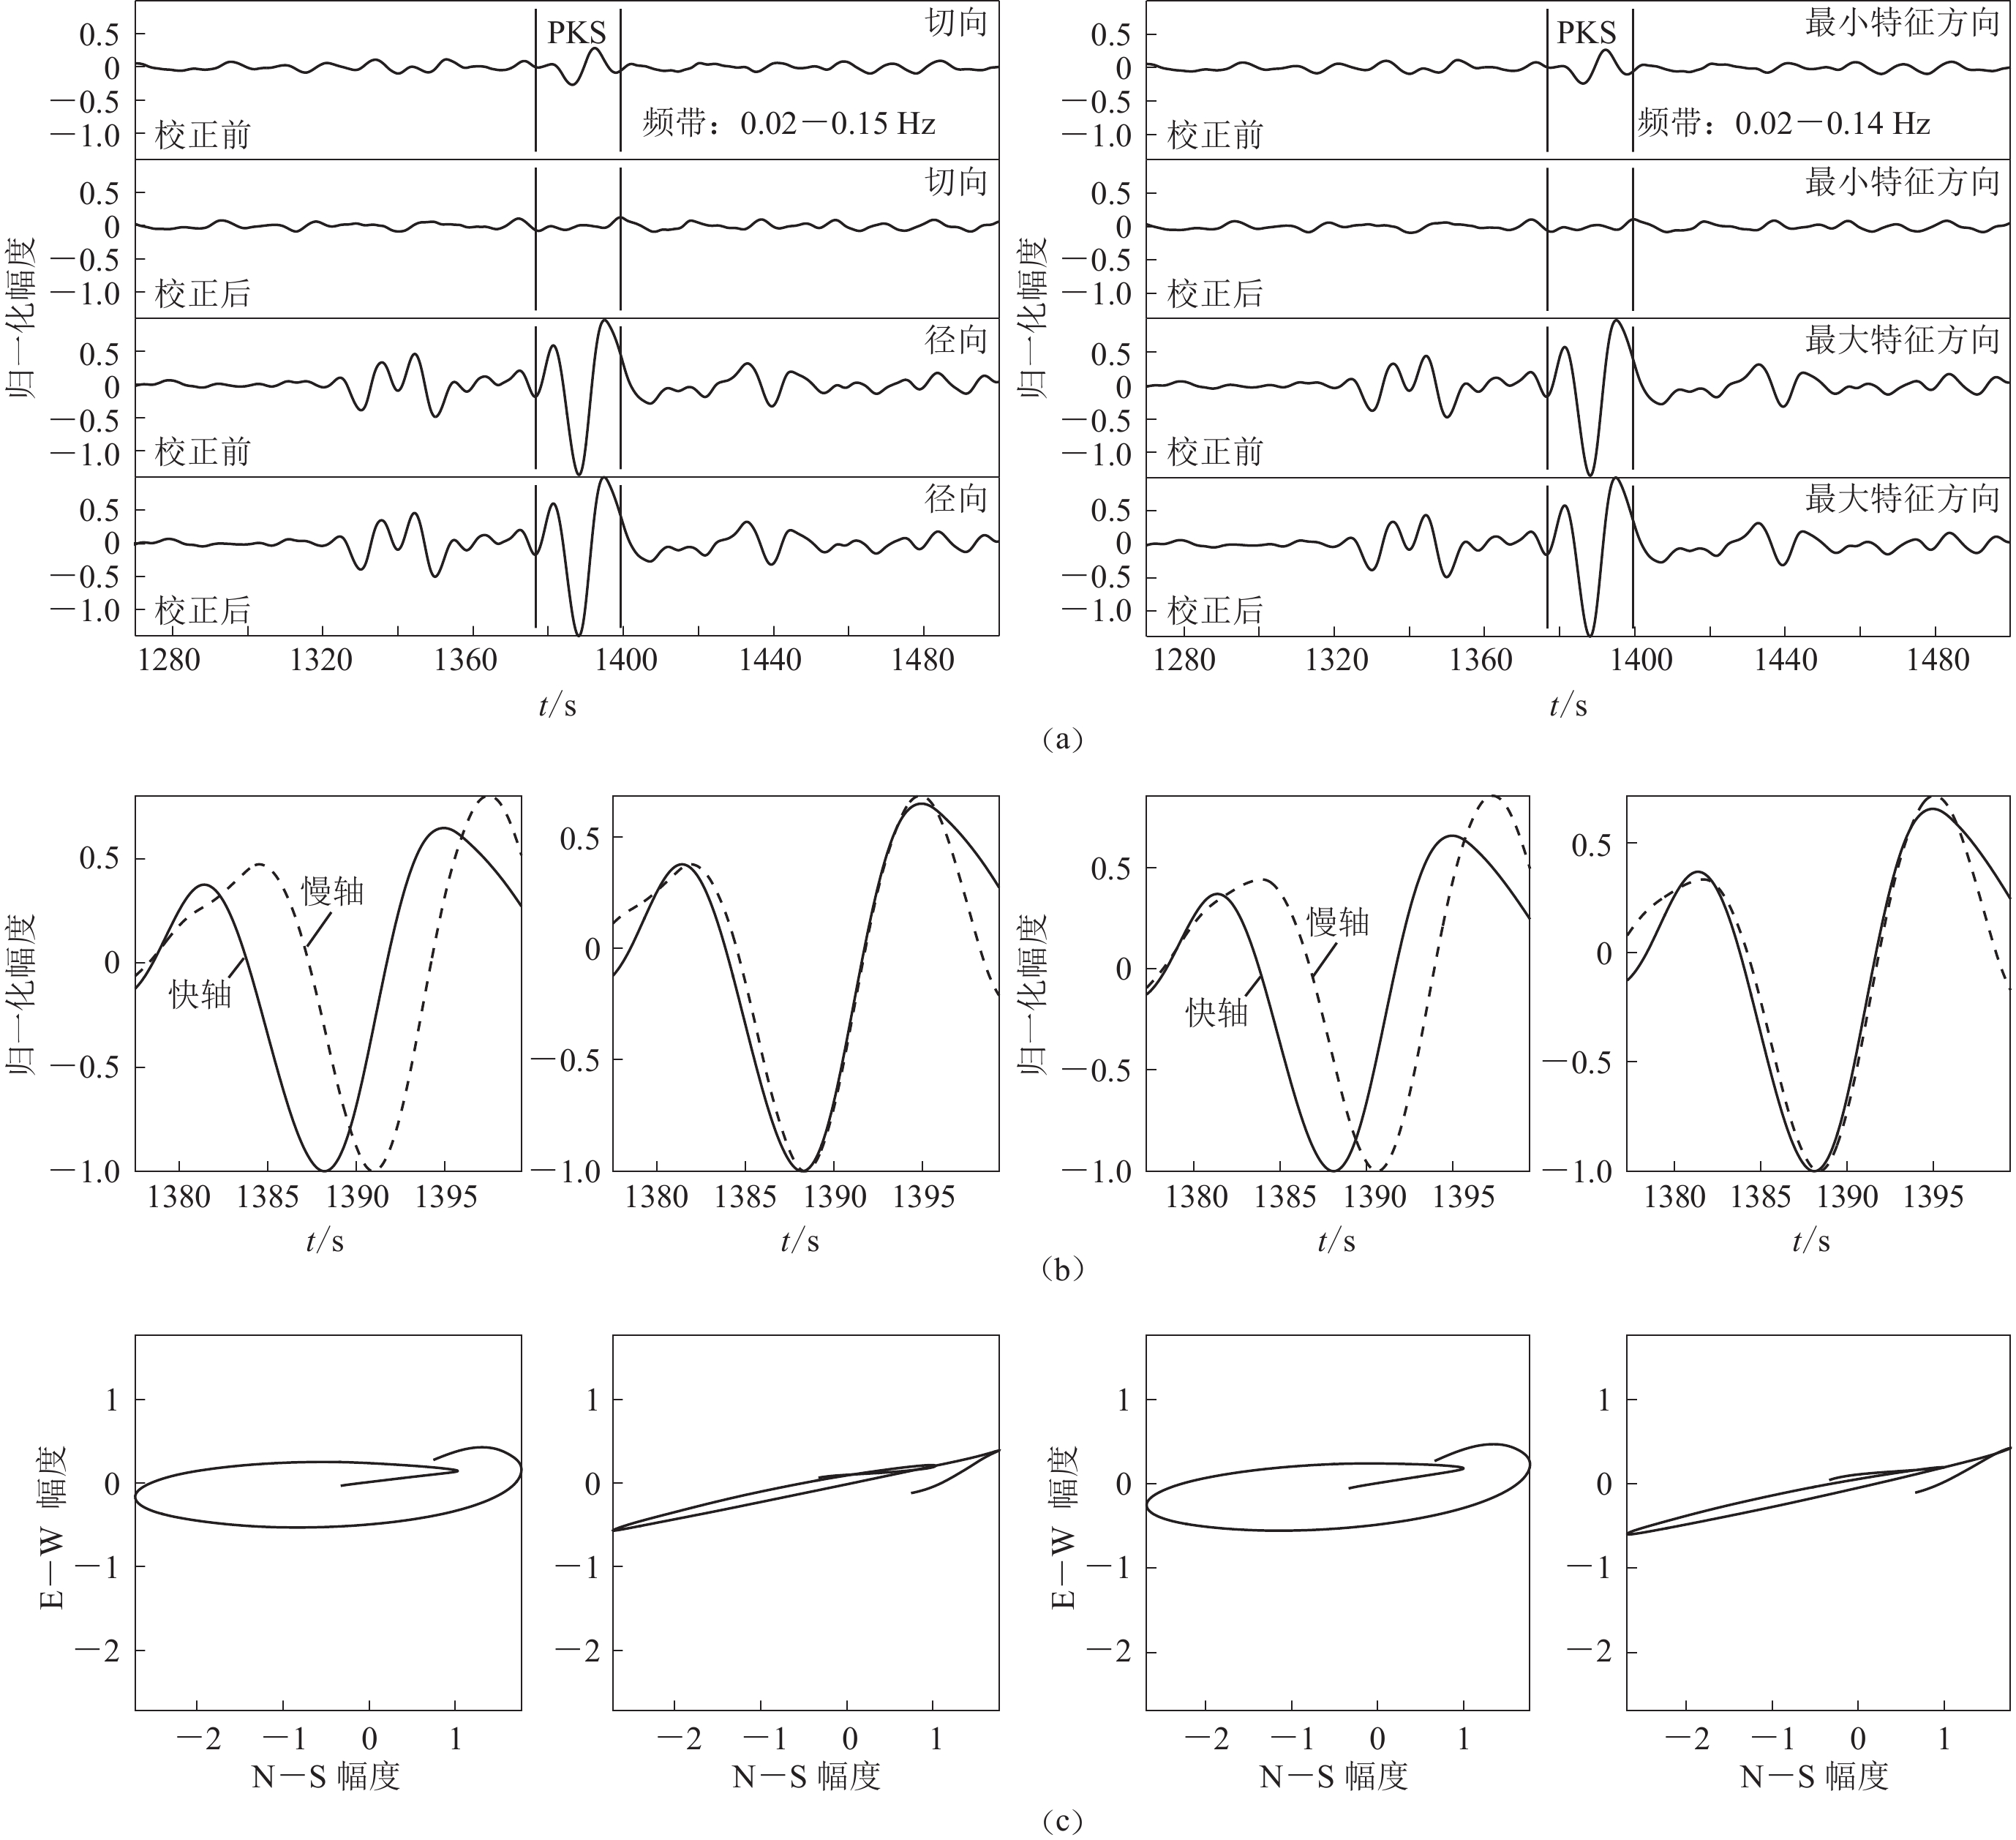
图 4 采用切向能量最小化(左)和最小特征值最小化(右)方法对HY16台站记录的2012年11月7日危地马拉沿海地震激发的PKS震相进行横波分裂分析
(a)—(c)横波分裂校正前后PKS震相滤波后的地震波形、投影到快/慢轴的波形及质点振动图(由原始的椭圆状线性化)
Figure 4. Shear wave splitting analysis on the PKS phase excited by the Guatemalan coastal earthquake on November 7,2012 recorded at station HY16 using the tangential energy minimization (left) and the minimum eigenvalue minimization (right) methods
(a)−(c) The filtered seismic waveforms,waveforms projected onto the fast /slow axis and the particle motions which arelinearized from the original elliptical shape of the PKS phase before and after correcting anisotropy
![]()
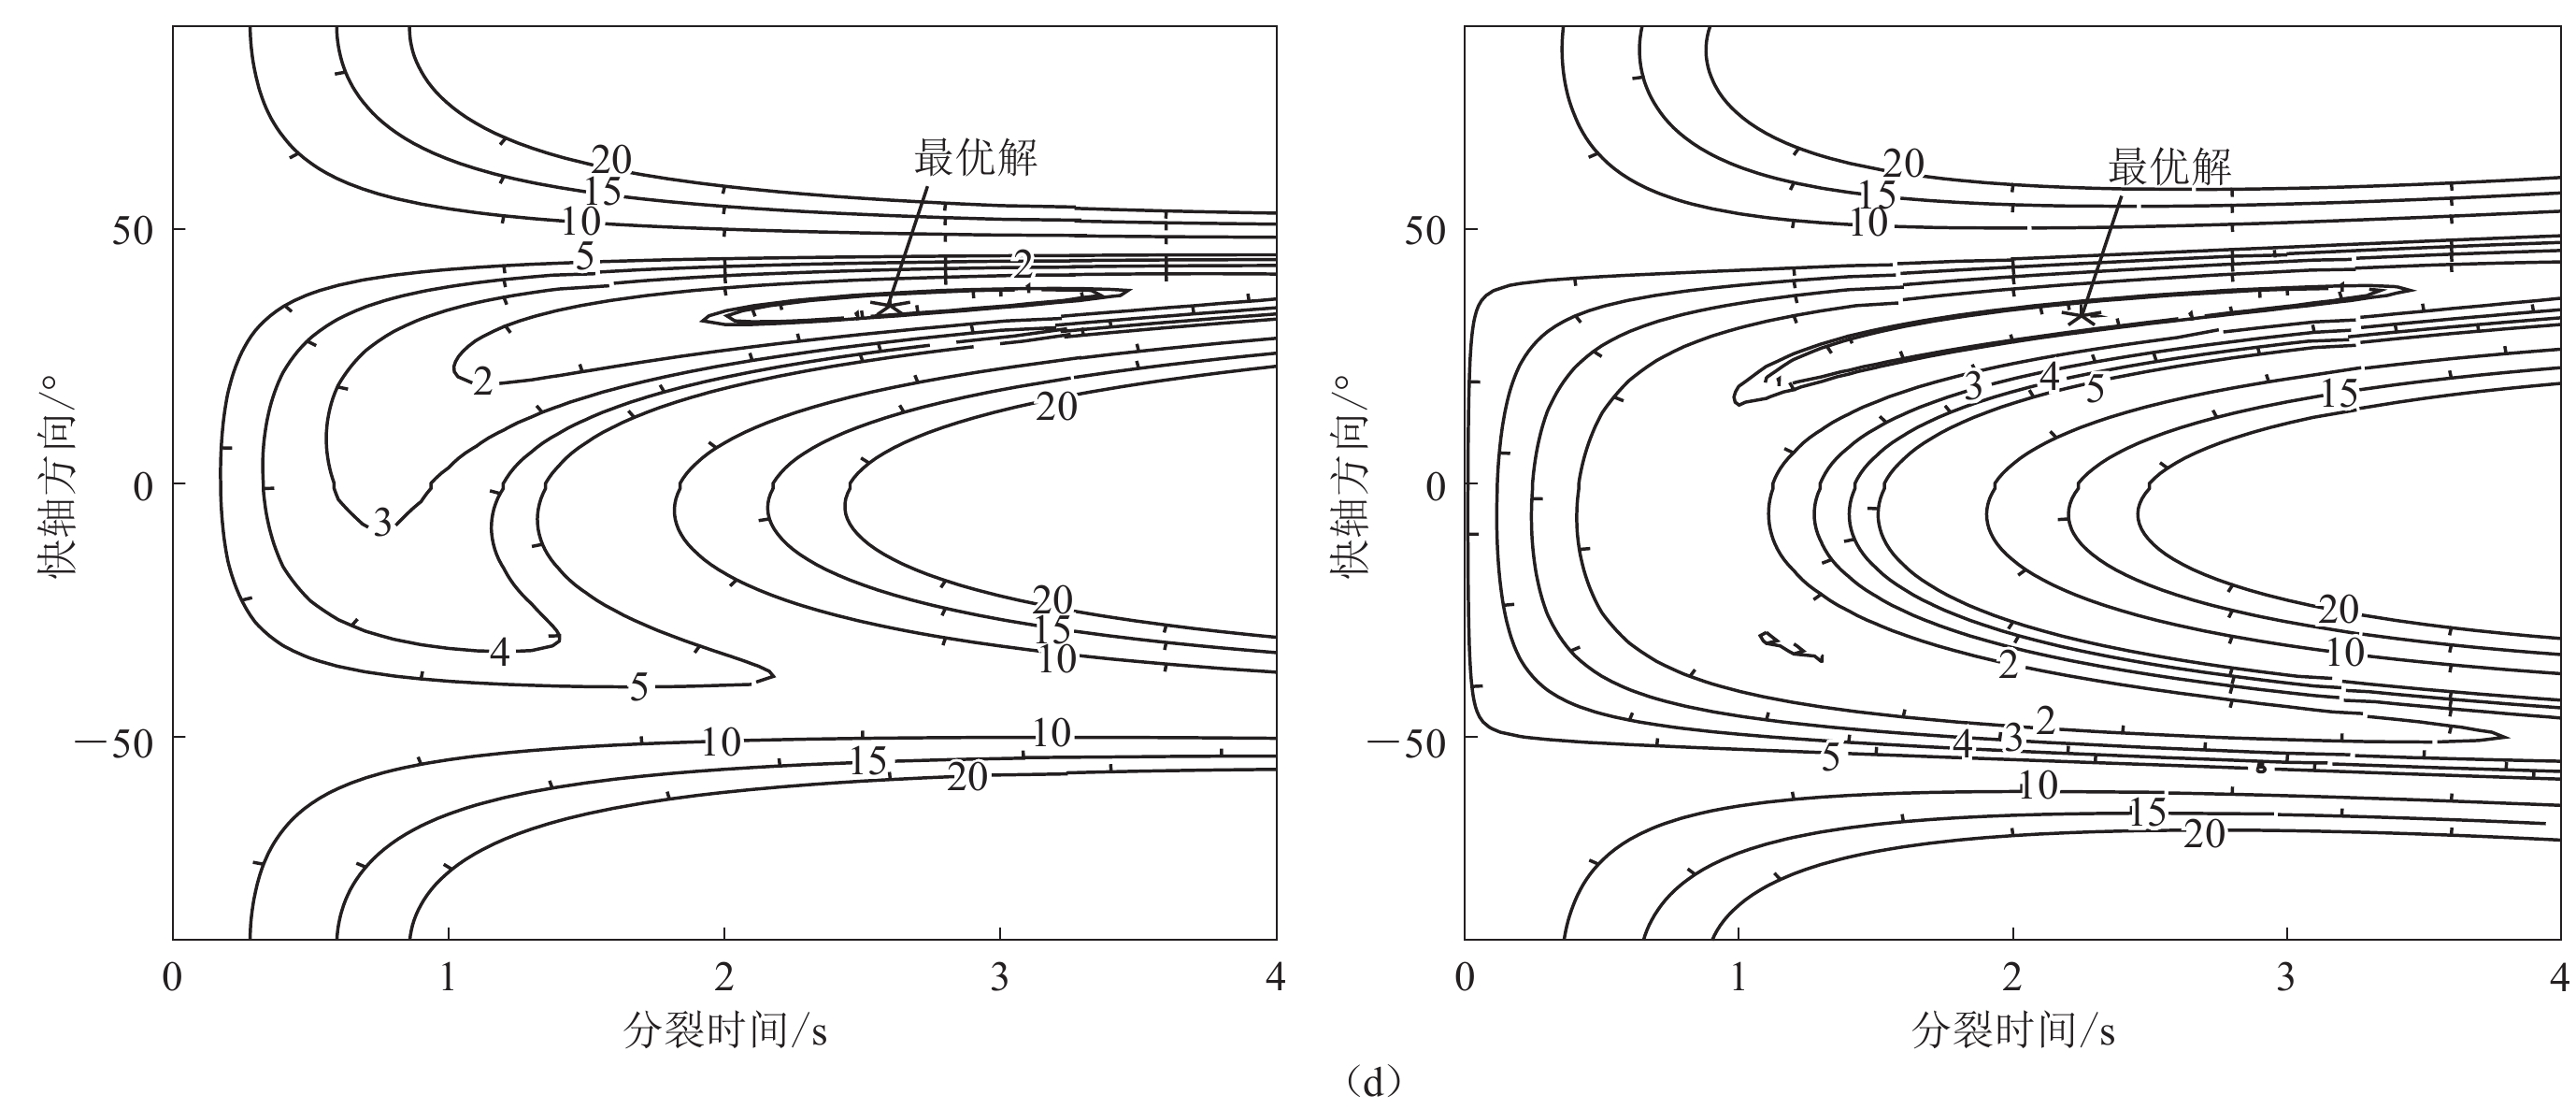
图 4 采用切向能量最小化(左)和最小特征值最小化(右)方法对HY16台站记录的2012年11月7日危地马拉沿海地震激发的PKS震相进行横波分裂分析
(d)能量等值线图,能量被校正到最小的那个点即为最优解(星号)
Figure 4. Shear wave splitting analysis on the PKS phase excited by the Guatemalan coastal earthquake on November 7,2012 recorded at station HY16 using the tangential energy minimization (left) and the minimum eigenvalue minimization (right) methods
(d) Contours of energy and the point where the energy corrected to the minimum is the optimal solution (asterisk)
![]()
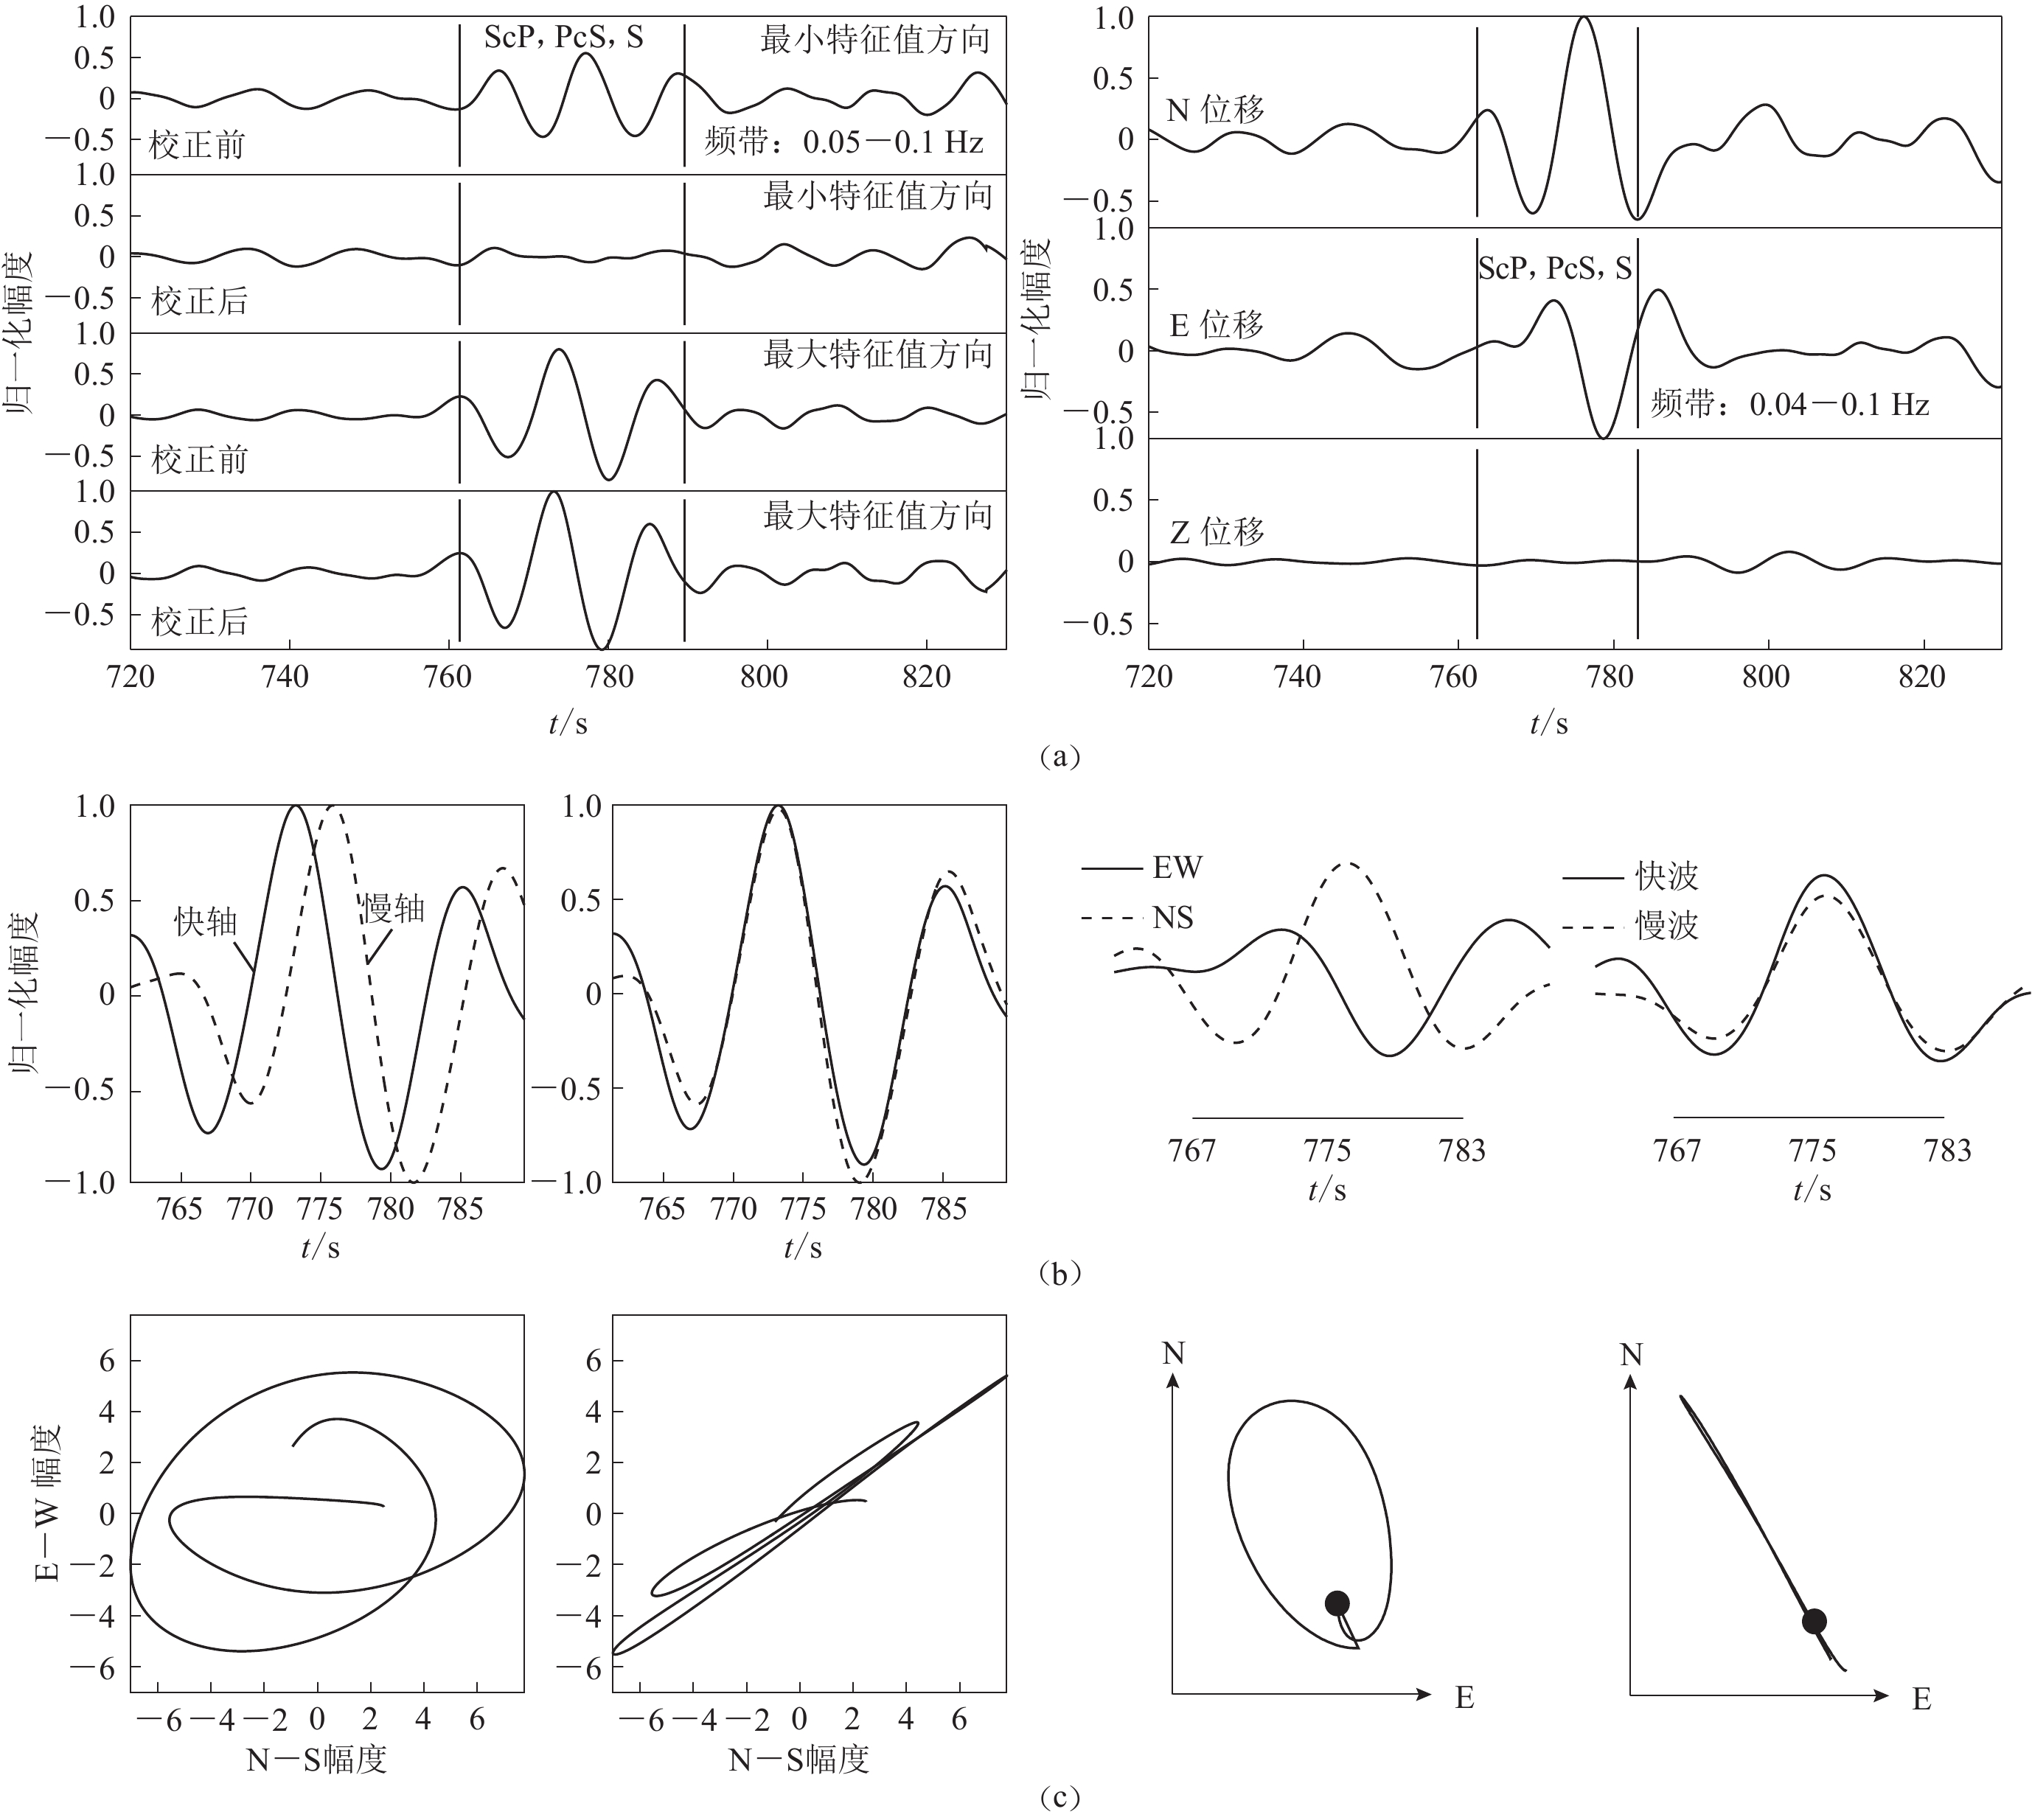
图 6 采用最小特征值最小化(左)和波形旋转互相关(右)方法分析HY08台站记录的2012年8月14日日本本州东部区域M7.7地震激发的区域S震相的横波分裂结果
(a)—(c)为横波分裂校正前后PKS震相的地震波形、投影到快慢轴的波形及质点振动图(原始的椭圆状线性化),其中右侧图采用的是质点的位移而非质点的振动速度,下同
Figure 6. The S-phases are triggered by the M7.7 earthquake in the eastern region of Honshu,Japan on August 14,2012 recorded at station HY08,and a comparison is also made between the shear wave splitting methods of the minimum eigenvalue minimization (left) and the cross-correlation (right)
(a)−(c) The filtered seismic waveforms,waveforms projected onto the fast /slow axis and the particle motions which are linearized from the original elliptical shape of the PKS phase before and after correcting anisotropy,figures in the right column use displacements rather than vibration velocities of the ground,the same below
![]()
图 6 采用最小特征值最小化(左)和波形旋转互相关(右)方法分析HY08台站记录的2012年8月14日日本本州东部区域M7.7地震激发的区域S震相的横波分裂结果
(d) 等值线图,能量和相关系数分别被校正到最小和最大的那个点即为最优解
Figure 6. The S-phases are triggered by the M7.7 earthquake in the eastern region of Honshu,Japan on August 14,2012 recorded at station HY08,and a comparison is also made between the shear wave splitting methods of the minimum eigenvalue minimization (left) and the cross-correlation (right)
(d) Contour maps. The point where the energy and correlation coefficient are corrected to the minimum and maximum,respectively,is the optimal solution (asterisk)
![]()
图 5 采用最小特征值最小化(a-b)和互相关横波分裂(c-e)方法分析HY17台站记录到的2012年11月7日危地马拉沿海地震激发的SKS震相得到的空解特征
(a)表示SKS震相投影到最大及最小特征值方向的波形图;(b)为最小特征值方向能量的等值线图;(c)代表N-S和E-W向地震波位移记录;(d)表示质点运动图;(e)表示互相关方法得到的快慢波相关系数等值线图,两种方法的空解特征均为等值线图沿两个候选的快轴方向呈条带状分布
Figure 5. Examples of null results obtained through shear wave splitting analysis of the SKS phase excited by the November 7,2012 Guatemalan coastal earthquake recorded at HY17 station,and a comparison of the null results,obtained using two shear wave splitting methods of the minimum eigenvalue minimization (a-b) and the cross-correlation methods (c-e)
(a) The SKS phases projected onto the directions of the maximum and minimum eigenvector;(b) The contours of the energy in the direction of the minimum eigenvector;(c) Seismic wave displacements in the N-S and E-W directions;(d) The particle motion diagram;(e) The contours of the cross-correlation coefficients between candidate fast and slow waves. Note that the common features of both methods for null results are that the contours are distributed in strips along the two candidate fast directions
![]()
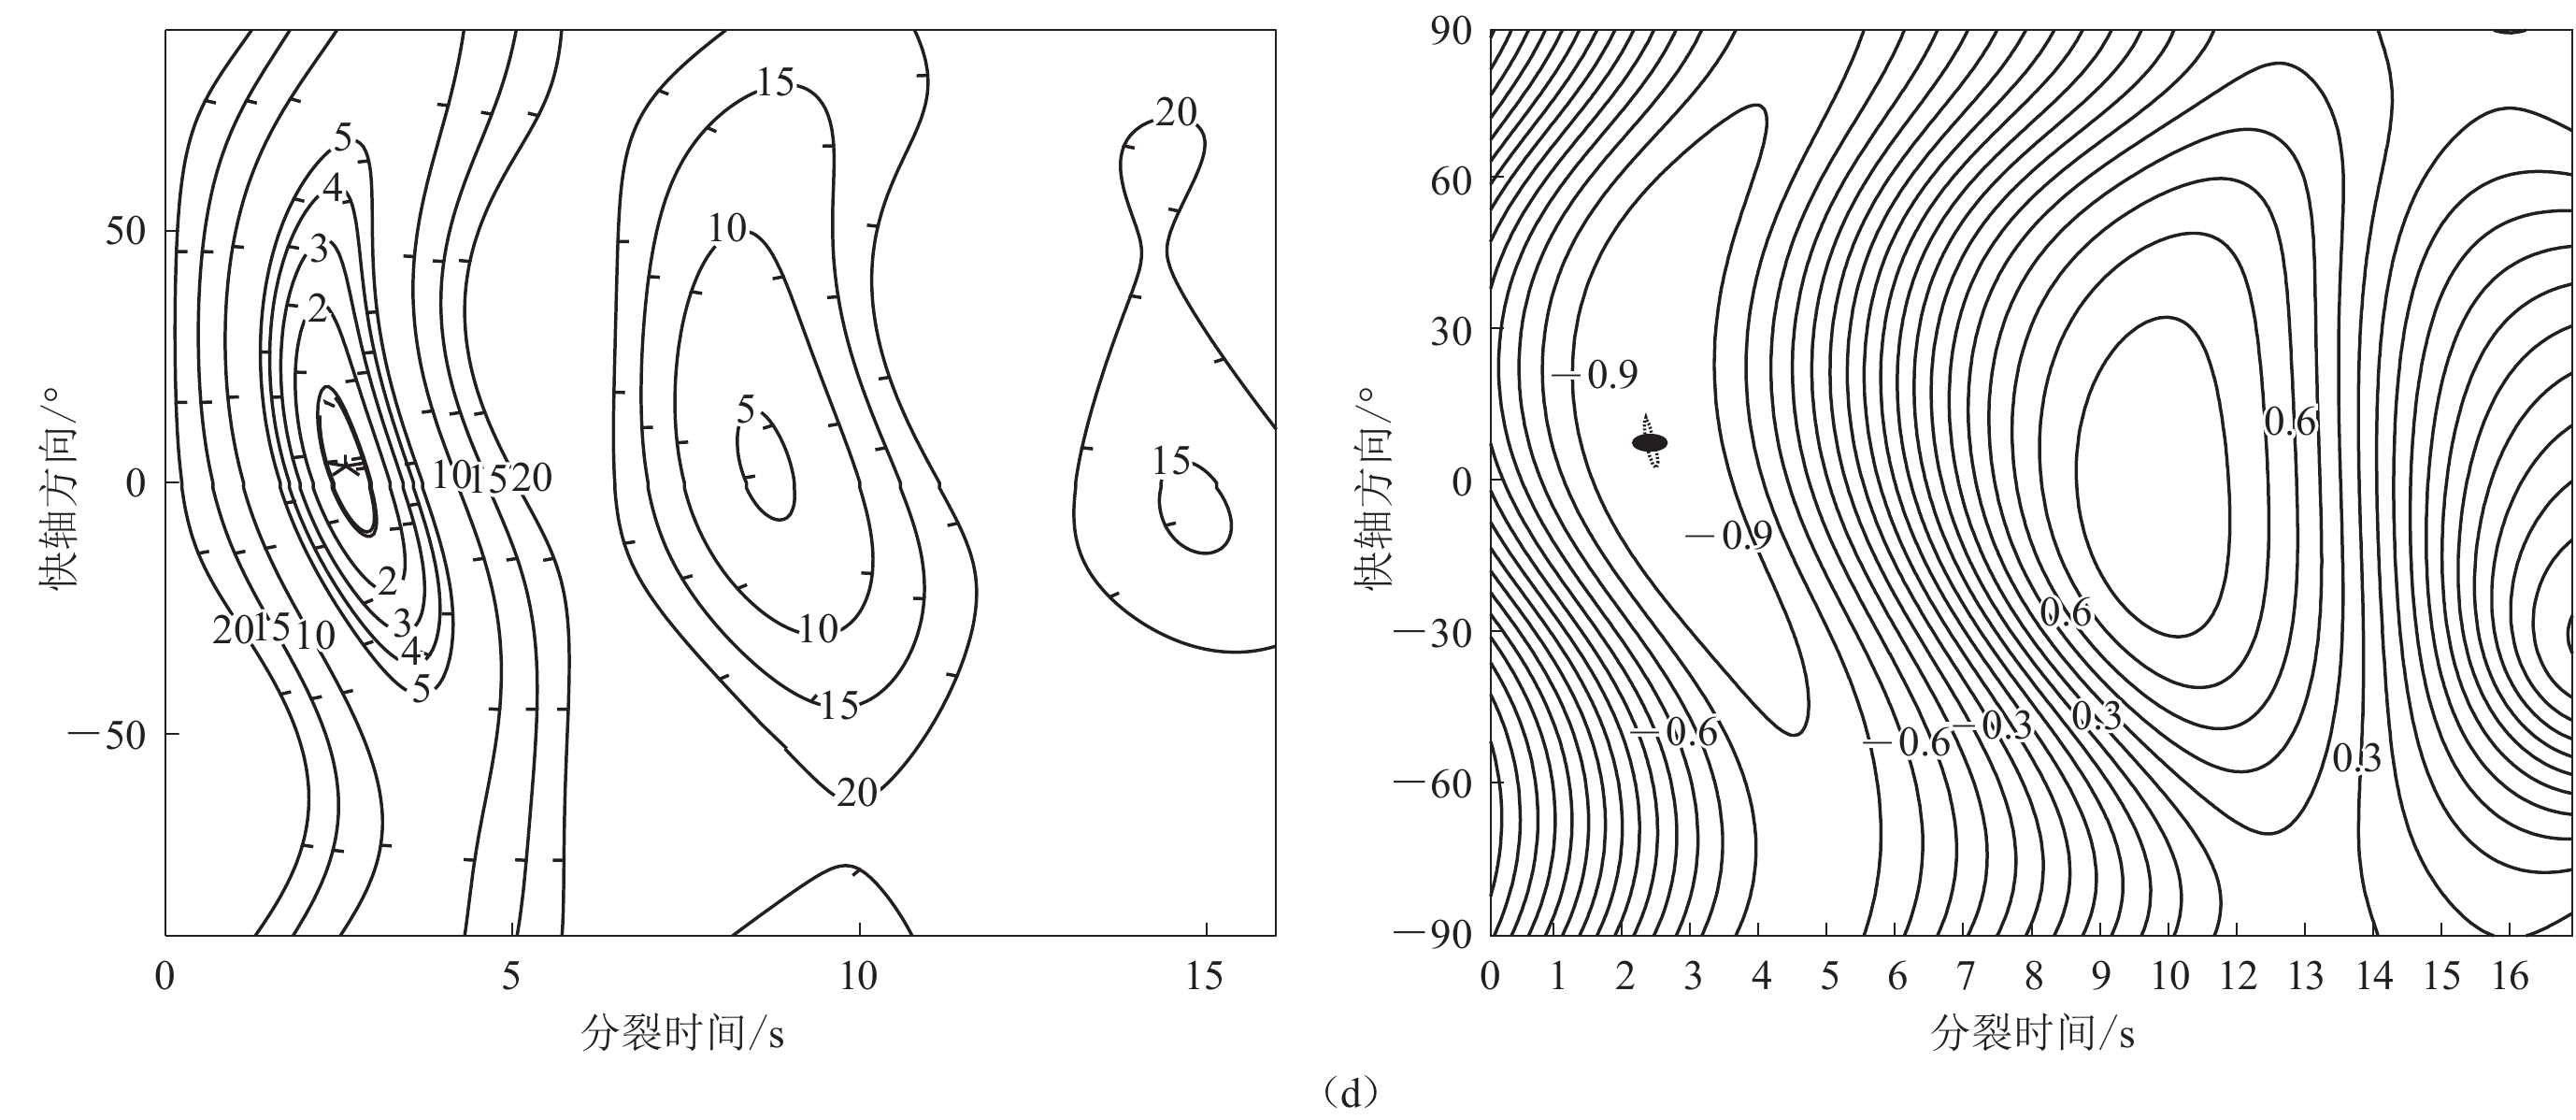
图 7 HY08地震−台站对采用最小特征值最小化方法的横波分裂结果进行聚类分析实例
(a-b)为图6所示的在0.05—0.1 Hz滤波频段针对不同横波分裂时窗得到的快轴方向和分裂时间;(c-d)为针对不同滤波频段获得的最优快轴方向和分裂时间;(e-f)为0.05-0.1 Hz和不同滤波频段的聚类分析结果,其中相同颜色的解表示通过聚类分析后划分为同一类的解
Figure 7. An example of clustering analysis on shear wave splitting results obtained using the minimum eigenvalue minimization method for the earthquake-station HY08 pair
(a-b) The fast directions and splitting times obtained at different splitting windows for the frequency band of 0.05−0.1 Hz in fig. 6;(c-d) The optimum fast directions and splitting times obtained at different filtering frequency bands;(e-f) The corresponding clustering analysis results for the frequency band of 0.05−0.1 Hz and for different frequency bands,where solutions with the same color represent solutions that are classified into the same class after clustering analysis
![]()
图 8 南海中央海盆SKS分裂结果
Figure 8. The SKS splitting results in the eastern sub-basin of the South China Sea
![]()
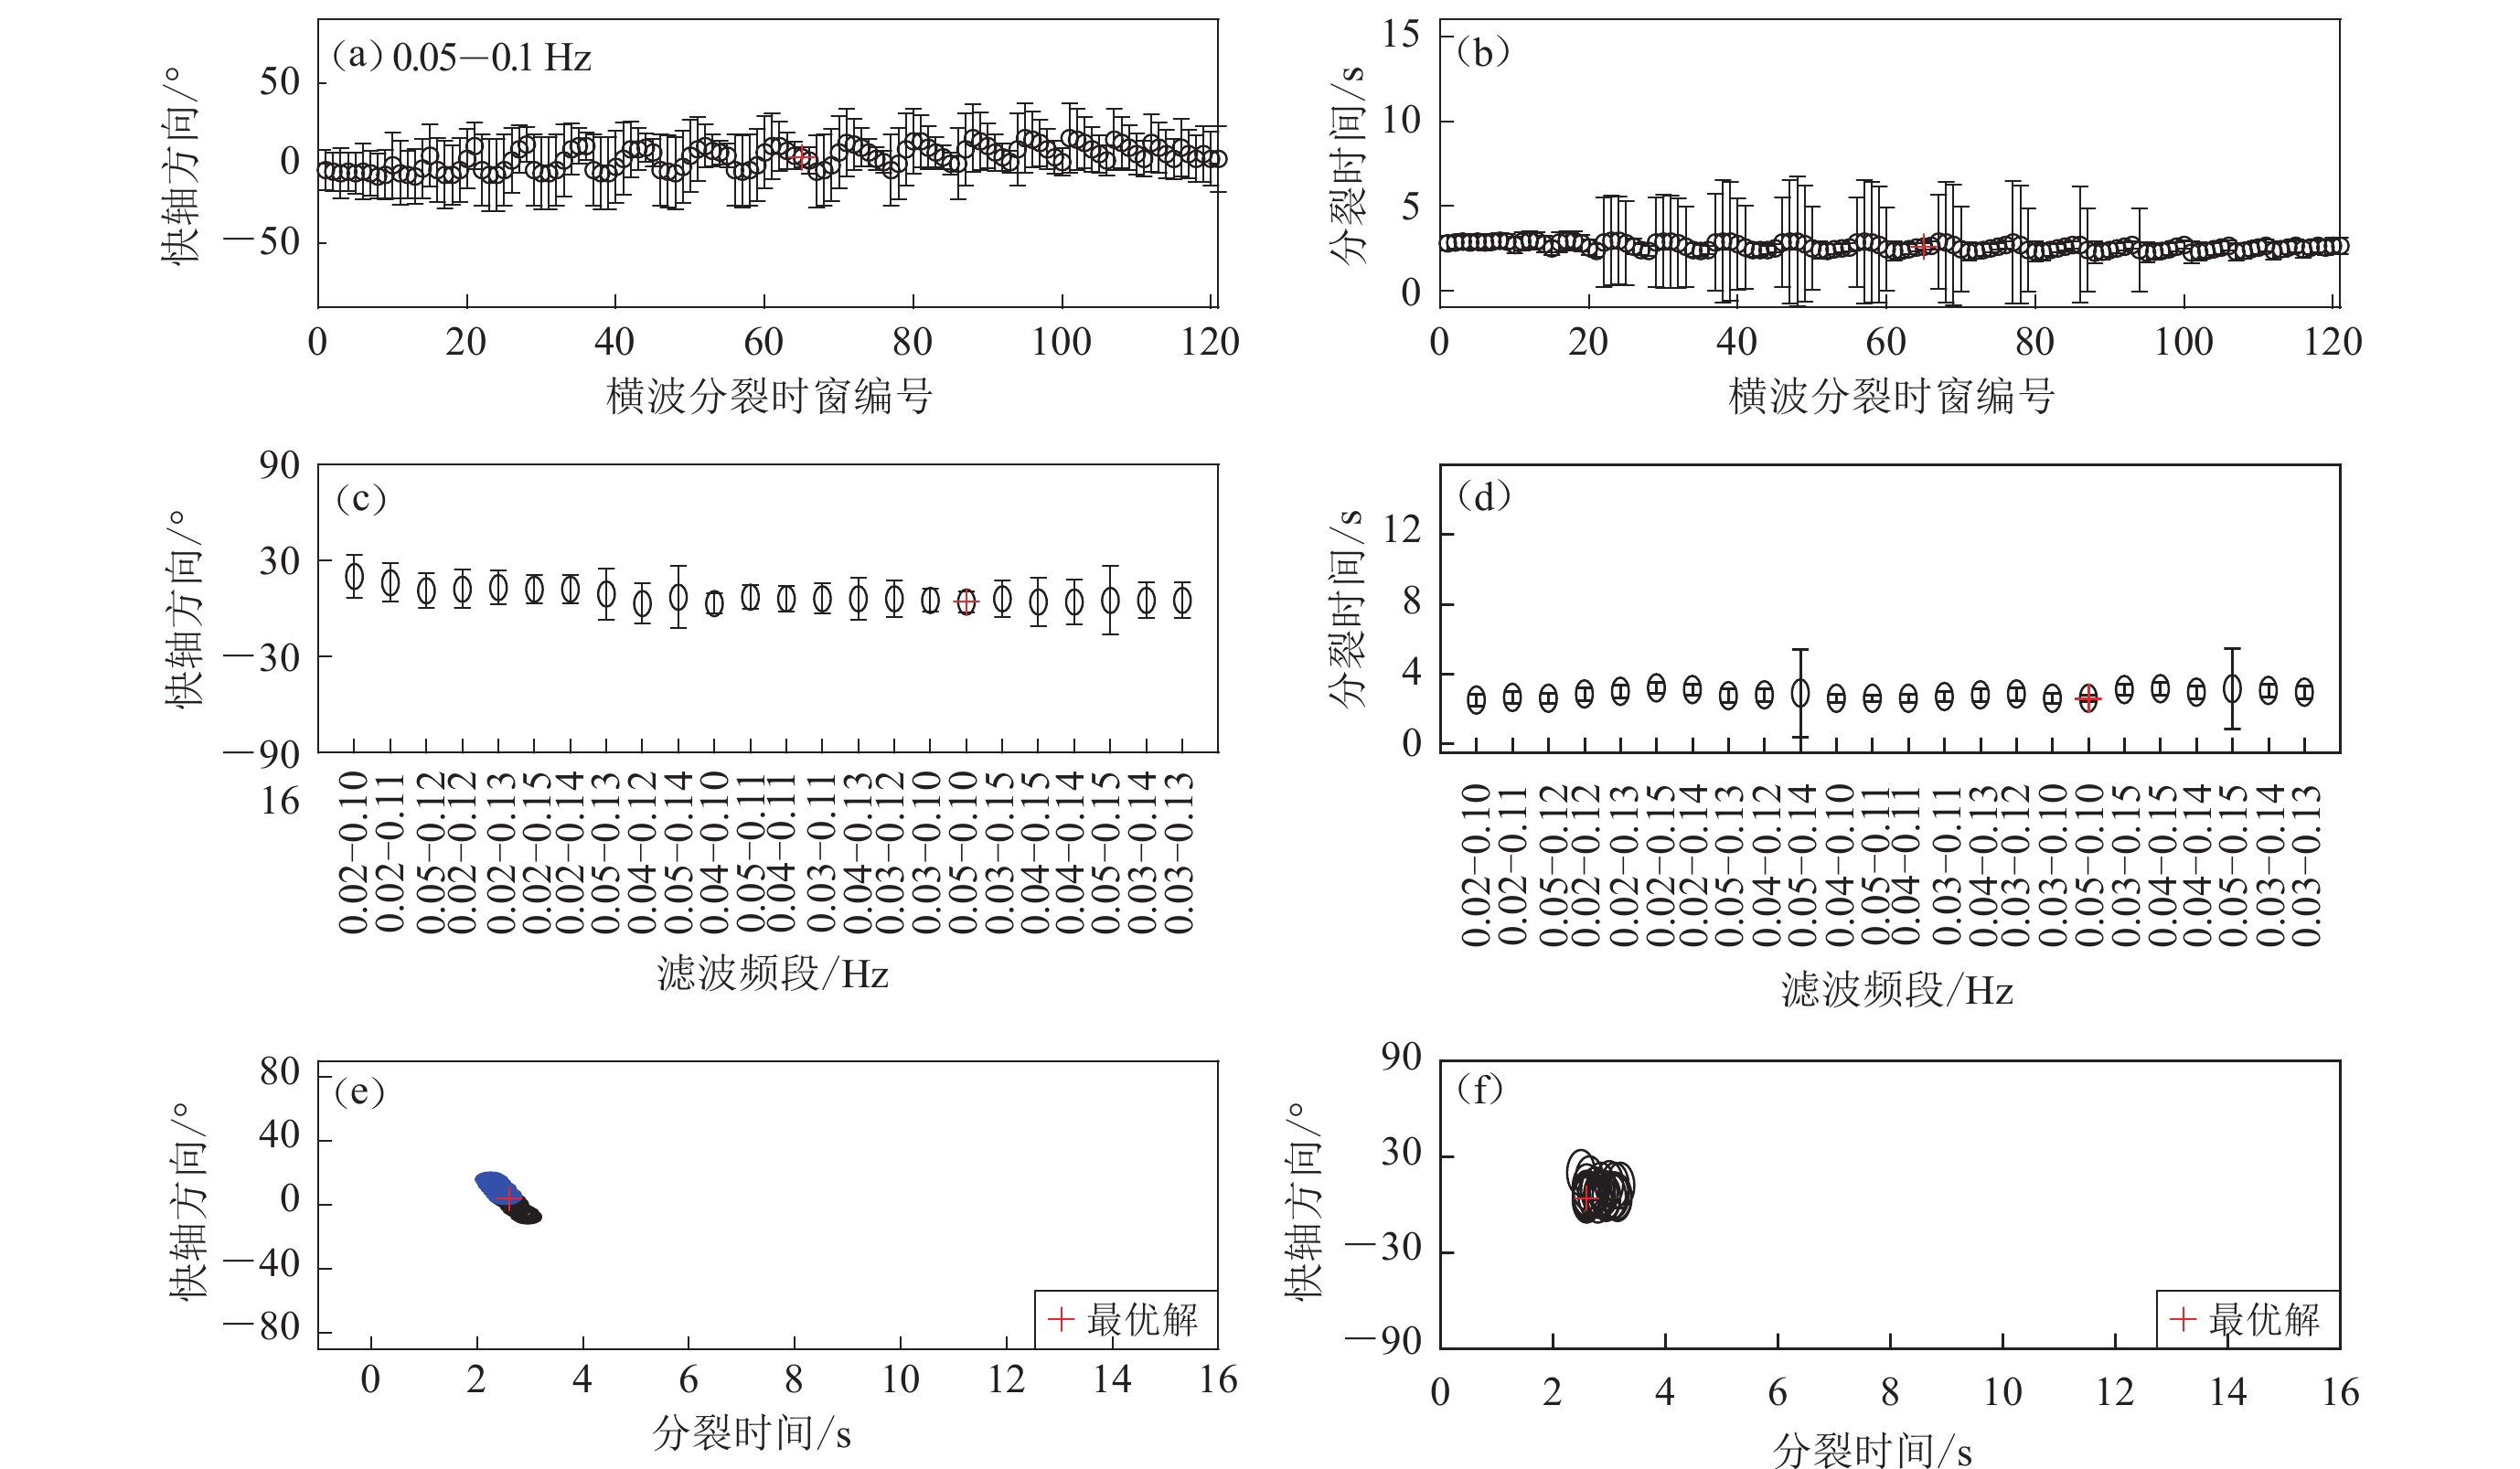
图 10 南海海盆及周边横波分裂及P波各向异性结果比较
黄色双箭头表示本研究得到的SKS分裂解;蓝色和蓝绿色双箭头分别为采用互相关方法和最小特征值最小化方法针对区域地震激发的S震相得到的横波分裂解;针对SKS震相在不同台站获得单个分裂解以及台站叠加解来自文献(Bai et al,2009; Hammond et al,2010;Huang et al,2011;Xue et al,2013;Yu et al,2018;Song et al,2021);P波各向异性结果来自Huang等(2015),其走向和长短分别代表快波的极化方向和各向异性的强度。台站东南方位马鲁古海区域根据横波分裂结果预期的该区域的地幔对流模型:黑色渐变粗实线代表Singihe板块下方与海沟平行的地幔流,板块两侧则是与板缘有关的偏转流,红色渐变粗实线则代表地幔楔里的角流,箭头指向流动方向
Figure 10. Comparisons of shear wave splitting results from this study with previous ones as well as the P-wave anisotropy results in the South China Sea Basin and its surrounding areas
The yellow double arrows represent the SKS splits obtained in this study;the blue and blue-green double arrows represent the splits obtained using the cross correlation method and the minimum eigenvalue minimization method for the S-phase excited by regional earthquakes,respectively;the individual SKS splits and stacked SKS splits are from previous studies (Bai et al,2009;Hammond et al,2010;Huang et al,2011;Xue et al,2013;Yu et al,2018;Song et al,2021);the P-wave anisotropy at different depths are from Huang et al (2015),and the direction and length of the short solid lines represent fast directions and anisotropic intensities respectively. The mantle convection model of the Molucca Sea region in the southeast of the OBSs consistent with most shear wave splitting results obtained in this study: the black gradient thick solid lines represent the trench-parallel flow under the Sangihe plate and the deflection flow related to the plate edge is on both sides of the plate,and the red gradient thick solid line represents the corner flow in the mantle wedge,and the arrows indicate the flow directions
![]()
图 9 南海周边区域地震的S震相分裂结果
蓝色短实线和蓝绿色短实线分别代表采用互相关方法和最小特征值最小化方法得到的横波分裂解
Figure 9. The S-wave splitting results for regional earthquakes surrounding the South China Sea
Blue solid lines and light blue solid lines represent splitting results obtained by the cross-correlation method and the smallest eigenvalue minimization method,respectively. The lengths of the lines are proportional to their splitting time,as shown in the lower left corner of the figure
表 1 提供有用数据的OBS信息
Table 1 The information of OBSs used
台站 东经/° 北纬/° 水深/m 记录起止日期 钟漂/s 水平分量方位角/° 倾斜/° 倾斜方向/° (年-月-日—年-月-日) HY02 116.306 1 16.203 3 3 750 2012-04-21—2012-12-03 86.53 20 3.5 160 HY08 117.796 5 13.800 4 4 104 2012-04-22—2012-08-19 0 218 0.7 285 HY10 116.998 3 14.598 9 4 276 2012-04-23—2012-12-09 193.2 166 0.8 215 HY15 117.537 0 16.503 3 3 753 2012-04-25—2012-12-19 0.74 154 16.3 5 HY16 118.213 4 16.451 3 3 920 2012-04-25—2012-12-13 −0.51 26 0.3 91 HY17 118.803 7 16.201 0 3 870 2012-04-25—2012-12-10 −10.54 330 2.0 131 B04 117.011 0 14.024 3 4 246 2014-07-11—2014-11-23 0 185 6.5 280 B19 116.499 0 14.500 6 4 301 2014-07-11—2014-11-23 0 350 6.5 110 B32 117.999 0 14.396 5 3 859 2014-07-13—2014-11-24 0 110 0 N/A 注:台站钟漂的误差在2—3 s之间,水平分量方位角误差约为8°;倾斜指OBS的垂直分量偏离垂向的角度(刘晨光等,2014; Le et al,2018 ;Hung et al,2021 ) 下载: 导出CSV
表 2 挑选后可用于横波分裂的地震事件信息
Table 2 The information of selected events used for shear wave splitting
事件序号 年-月-日 儒略日 发震时刻 纬度 经度 震源深度/km MW 注释 1 2012-08-27 240 043719.43 12.139°N 88.590°W 28.0 7.3 远震 2 2012-11-07 312 163546.69 13.963°N 91.854°W 24.0 7.4 远震 3 2012-04-29 120 015751.90 3.059°S 136.109°E 18.4 5.2 区域震 4 2012-05-23 144 150225.31 41.335°N 142.082°E 46.0 5.9 区域震 5 2012-06-01 153 065620.24 0.720°S 133.269°E 25.0 5.8 区域震 6 2012-06-29 181 210733.86 43.433°N 84.700°E 18.0 6.3 区域震 7 2012-07-16 198 163310.08 1.296°S 137.053°E 13.1 5.6 区域震 8 2012-07-25 207 002745.26 2.707°N 96.045°E 22.0 6.4 区域震 9 2012-08-12 225 104706.45 35.661°N 82.518°E 13.0 6.2 区域震 10 2012-08-14 227 025938.46 49.800°N 145.064°E 583.2 7.7 区域震 11 2012-09-03 247 182305.23 10.708°S 113.931°E 14.0 6.1 区域震 12 2012-09-07 251 031942.53 27.575°N 103.983°E 10.0 5.5 区域震 13 2012-10-08 282 114331.42 4.472°S 129.129°E 10.0 6.1 区域震 14 2012-10-17 291 044230.40 4.232°N 124.520°E 32.6 6.0 区域震 15 2012-11-27 332 025906.52 2.952°S 129.219°E 11.2 5.7 区域震 16 2014-07-11 192 192200.82 37.005°N 142.452°E 20.0 6.5 区域震 17 2014-07-20 201 183247.79 44.642°N 148.784°E 61.0 6.2 区域震 18 2014-08-03 215 083013.57 27.189°N 103.409°E 12.0 6.2 区域震 19 2014-08-06 218 114522.68 7.274°S 128.036°E 10.0 6.2 区域震 20 2014-09-10 253 051653.21 18.400°N 125.125°E 30.0 5.9 区域震 21 2014-09-17 260 061445.41 13.764°N 144.429°E 130.0 6.7 区域震 22 2014-11-18 322 044716.63 1.869°N 126.475°E 30.0 5.8 区域震
下载: 导出CSV
表 3 远震的横波分裂结果
Table 3 The shear-wave splitting results for teleseismic earthquakes
台站 事件 后方位角/° 震中距/° 震相 ϕ/° δt/s 方法 HY02 1 46.2 142.6 SKKS 46.2;−43.8 空解 切向能量 46.2;−43.8 空解 最小特征值 46.2;−43.8 空解 互相关 HY10 2 46.5 139.7 PKS 46.5;−43.5 空解 切向能量 46.5;−43.5 空解 最小特征值 46.5;−43.5 空解 互相关 HY15 2 45.5 138.1 SKKS 45.5;−44.5 空解 切向能量 45.5;−44.5 空解 最小特征值 45.5;−44.5 空解 互相关 PKS 45.5;−44.5 空解 切向能量 45.5;−44.5 空解 最小特征值 45.5;−44.5 空解 互相关 HY16 2 46.2 137.6 PKS 35±1.5 2.6±0.35 切向能量 33±6.5 2.25±0.55 最小特征值 46.2;−43.8 空解 互相关 SKKS 46.2;−43.8 空解 切向能量 46.2;−43.8 空解 最小特征值 46.2;−43.8 空解 互相关 HY17 2 47.1 137.3 SKS 47.1;−42.9 空解 切向能量 空解 最小特征值 空解 互相关 空解 切向能量 PKS 47.1;−42.9 空解 最小特征值 空解 互相关
下载: 导出CSV
表 4 区域性地震的横波分裂结果
Table 4 The shear-wave splitting results obtained for regional earthquakes
台站 事件 后方位角/° 震中距/° 震相 (φ±σφ)/° (δt±σδt)/s 方法 HY02 6 321.9 38.2 S,pS,sS −42±17.0 9.75±0.96 互相关 9 309.2 35.8 S,pS,sS,PS 28±4.5 2.8±0.4 最小特征值 11 185.2 26.8 S,pS,sS −47±13.0 0.75±0.23 最小特征值 −48±24.0 0.75±0.60 互相关 12 316.8 16.1 S,sS,Sn,SS −1±8.5 1.8±0.375 最小特征值 −36±25.0 0.75±0.42 互相关 HY08 3 131.4 24.7 S,pS,sS,PS −47±5 2.72±0.5 最小特征值 −11±21 1.2±0.50 互相关 4 33.0 34.6 S 50±7 2.8±0.575 最小特征值 11±22 1.15±0.39 互相关 5 132.0 21.1 S,pS,sS −34±7 1.0±0.23 最小特征值 −48;42 空解 互相关 6 322.6 41.0 S,pS,sS,PS −46±5.0 9.6±0.375 最小特征值 −49±8.0 9.85 ±0.45 互相关 7 126.7 24.3 S,pS,sS,PS 27±15.5 2.65±0.83 最小特征值 59±24.0 1.5±0.55 互相关 10 26.2 42.3 S 4±6.5 2.6±0.2 最小特征值 8±7 2.35±0.17 互相关 HY15 6 320.8 38.7 S,pS,sS,PS −38±4.5 9.6±0.28 最小特征值 −46±7.0 9.75 ±0.41 互相关 8 239.3 25.2 S,pS,sS,PS 69±9.5 6.6±1.35 最小特征值 58±6.0 7.4±0.56s 互相关 10 27.8 40.0 S 36±4.0 7.65±0.35 最小特征值 −42;48 空解 互相关 HY16 6 320.4 39.1 S,pS,sS −64±4.0 8.85±0.25 最小特征值 −63±3.0 9.0 ±0.14 互相关 11 189.2 27.3 S,pS,sS,PS −79±4.5 2.85±0.7 最小特征值 −69±2 4.65±0.24 互相关 13 151.6 23.4 S,pS,sS,PS 20±9.5 1.9±0.275 最小特征值 17±18 1.75±0.27 互相关 14 152.3 13.6 S,Sn 14±1.5 2.2±0.2 最小特征值 −67;23 空解 互相关 15 149.6 22.1 S,pS,sS,PS 42±5.0 3.25±0.85 最小特征值 54±3.0 4.9±0.43 互相关 HY17 6 320.2 39.8 S,pS,sS,PS −44±5.0 8.80±0.23 最小特征值 −45±5.0 8.95 ±0.22 互相关 B04 16 40.2 32.2 S,pS,sS,PS −67±9.0 3.55±0.775 最小特征值 −80±11 4.25±0.65 互相关 22 141.4 15.3 S,Sn,sS −79±20 2.05±0.61 互相关 B19 17 35.8 40.6 S,pS,sS,PS −34±5.5 3.1±0.15 最小特征值 18 318.0 17.6 S,Sn,sS,SS −7±2.0 3.65±0.3 最小特征值 19 151.4 24.5 S,pS,sS,PS −41±1.5 8.95±0.25 最小特征值 −41±2 9.1±0.18 互相关 20 148.9 16.9 S,Sn,sS,SS −36±3 8.05±1.0 最小特征值 −41;49 空解 互相关 21 88.1 27.1 S,sS 5±3.5 4.1±0.325 最小特征值 −12±9.0 4.85±0.35 互相关 B32 17 34.7 39.9 S,sS −26±2.0 3.65±0.2 最小特征值 19 154.5 23.7 S,pS,sS,PS −75±2.5 3.7±0.4 最小特征值 −75;15 空解 21 88.1 25.6 S,sS 7±5 2.95±0.2 最小特征值 2±10 2.95±0.4
下载: 导出CSV
-
陈立,薛梅,Phon L K,杨挺. 2012. 南海瑞雷面波群速度层析成像及其地球动力学意义[J]. 地震学报,34(6):754–772. doi: 10.3969/j.issn.0253-3782.2012.06.003 Chen L,Xue M,Phon L K,Yang T. 2012. Group velocity tomography of Rayleigh waves in South China Sea and its geodynamic implications[J]. Acta Seismologica Sinica,34(6):754–772 (in Chinese).
李家彪,金翔龙,高金耀. 2002. 南海东部海盆晚期扩张的构造地貌研究[J]. 中国科学:D辑,32(3):239–249. Li J B,Jin X L,Gao J Y. 2002. A study on the tectonic geomorphology of the late expansion of the Eastern sub-basin of South China Sea[J]. Science in China:Series D,32(3):239–249 (in Chinese).
李家彪,金翔龙,阮爱国,吴世敏,吴自银,刘建华. 2004. 马尼拉海沟增生楔中段的挤入构造[J]. 科学通报,49(10):1000–1008. Li J B,Jin X L,Ruan A G,Wu S M,Wu Z Y,Liu J H. 2004. Intrusion structures in the middle of the accretionary wedge of the Manila Trench[J]. Chinese Science Bulletin,49(10):1000–1008 (in Chinese).
李琳. 2016. 利用OBS数据反演南海海盆的各向异性结构[D]. 上海: 同济大学: 68. Li L. 2016. The Anisotropic Structure of South China Sea Constrained by OBS Data Geophysics[D]. Shanghai: Tongji University: 68 (in Chinese).
李思田,林畅松,张启明,杨士恭,吴培康. 1998. 南海北部大陆边缘盆地幕式裂陷的动力过程及10Ma以来的构造事件[J]. 科学通报,43(8):797–810. Li S T,Lin C S,Zhang Q M,Yang S G,Wu P K. 1998. Dynamic process of episodic rifting in the northern continental margin basin of the South China Sea and tectonic events since 10 Ma[J]. Science Bulletin,43(8):797–810 (in Chinese).
刘晨光,华清峰,裴彦良,杨挺,夏少红,薛梅,黎伯孟,霍达,刘芳,黄海波. 2014. 南海海底天然地震台阵观测实验及其数据质量分析[J]. 科学通报,59(16):1542–1552. Liu C G,Hua Q F,Pei Y L,Yang T,Xia S H,Xue M,Le B M,Huo D,Liu F,Huang H B. 2014. Passive-source ocean bottom seismograph (OBS) array experiment in South China Sea and data quality analyses[J]. Chinese Science Bull,59(16):1542–1552 (in Chinese).
任建业,李思田. 2000. 西太平洋边缘海盆地的扩张过程和动力学背景[J]. 地学前缘,7(3):203–213. Ren J Y,Li S T. 2000. Spreading and dynamic setting of marginal basins of the western Pacific[J]. Earth Science Frontiers,7(3):203–213 (in Chinese).
谢建华,夏斌,张宴华,王喜臣. 2005. 南海形成演化探究[J]. 海洋科学进展,23(2):212–218. Xie J H,Xia B,Zhang Y H,Wang X C. 2005. Study on formation and evolution of the South China Sea[J]. Advances in Marine Science,23(2):212–218 (in Chinese).
胥颐,李志伟,郝天珧,刘建华,刘劲松. 2007. 南海东北部及其邻近地区的Pn波速度结构与各向异性[J]. 地球物理学报,50(5):1473–1479. Xu Y,Li Z W,Hao T Y,Liu J H,Liu J S. 2007. Pn wave velocity and anisotropy in the northeastern South China Sea and adjacent region[J]. Chinese Journal of Geophysics,50(5):1473–1479 (in Chinese).
薛梅. 2008. 横波分裂方法研究[C]//中国地球物理学会第二十四届年会. 北京: 中国大地出版社: 390. Xue M. 2008. Study on shear-wave splitting [C]//The 24th Annual Meeting of the Chinese Geophysical Society. Beijing: China Land Press: 390 (in Chinese).
鄢全树,石学法. 2007. 海南地幔柱与南海形成演化[J]. 高校地质学报,13(2):311–322. Yan Q S,Shi X F. 2007. Hainan mantle plume and the formation and evolution of the South China Sea[J]. Geological Journal of China Universities,13(2):311–322 (in Chinese).
张健,熊亮萍,汪集旸. 2001. 南海深部地球动力学特征及其演化机制[J]. 地球物理学报,44(5):602–610. Zhang J,Xiong L P,Wang J Y. 2001. Characteristics and mechanism of geodynamic evolution of the South China Sea[J]. Chinese Journal of Geophysics,44(5):602–610 (in Chinese).
张亮. 2012. 南海构造演化模式及其数值模拟[D]. 青岛: 中国科学院研究生院(海洋研究所):1−185. Zhang L. 2012. Tectonic Evolution of South China Sea and A Numerical Modeling[D].Qingdao: Graduate University of Chinese Academy of Sciences (Institute of Oceanography):1−185 (in Chinese).
钟广见,林珍,高红芳,金华峰. 2006. 南海南北缘的构造特征对比[J]. 南海地质研究,(1):30–40. Zhong G J,Lin Z,Gao H F,Jin H F. 2006. Comparison of the tectonic characteristic between north margin and south margin of the South China Sea[J]. Geological Research of South China Sea,(1):30–40 (in Chinese).
周蒂,陈汉宗,吴世敏,俞何兴. 2002. 南海的右行陆缘裂解成因[J]. 地质学报,76(2):180–190. Zhou D,Chen H Z,Wu S M,Yu H X. 2002. Opening of the South China Sea by dextral splitting of the East Asian continental margin[J]. Acta Geologica Sinica,76(2):180–190 (in Chinese).
Bai L,Iidaka T,Kawakatsu H,Morita Y,Dzung N Q. 2009. Upper mantle anisotropy beneath Indochina block and adjacent regions from shear-wave splitting analysis of Vietnam broadband seismograph array data[J]. Phys Earth Planet Inter,176(1/2):33–43.
Bell S W,Forsyth D W,Ruan Y Y. 2015. Removing noise from the vertical component records of ocean-bottom seismometers:Results from year one of the cascadia initiative[J]. Bull Seismol Soc Am,105(1):300–313. doi: 10.1785/0120140054
Ben-Avraham Z,Uyeda S. 1973. The evolution of the China Basin and the mesozoic paleogeography of Borneo[J]. Earth Planet Sci Lett,18(2):365–376. doi: 10.1016/0012-821X(73)90077-0
Bowman J R,Ando M. 1987. Shear-wave splitting in the upper-mantle wedge above the Tonga subduction zone[J]. Geophys J Roy Astron Soc,88(1):25–41. doi: 10.1111/j.1365-246X.1987.tb01367.x
Briais A,Patriat P,Tapponnier P. 1993. Updated interpretation of magnetic anomalies and seafloor spreading stages in the South China Sea:Implications for the tertiary tectonics of Southeast Asia[J]. J Geophys Res:Solid Earth,98(B4):6299–6328. doi: 10.1029/92JB02280
Cao L M,He X B,Zhao L,Lü C C,Hao T Y,Zhao M H,Qiu X L. 2021. Mantle flow patterns beneath the junction of multiple subduction systems between the Pacific and Tethys Domains,SE Asia:Constraints from SKS-wave splitting measurements[J]. Geochem Geophys Geosyst,22(9):e2021GC009700.
Chevrot S. 2000. Multichannel analysis of shear wave splitting[J]. J Geophys Res:Solid Earth,105(B9):21579–21590. doi: 10.1029/2000JB900199
Clift P,Lee G H,Anh Duc N,Barckhausen U,Van Long H,Zhen S. 2008. Seismic reflection evidence for a Dangerous Grounds miniplate:No extrusion origin for the South China Sea[J]. Tectonics,27(3):TC3008.
Crampin S,Gao Y. 2006. A review of techniques for measuring shear-wave splitting above small earthquakes[J]. Phys Earth Planet Inter,159(1/2):1–14.
Crotwell H P,Owens T J,Ritsema J. 1999. The Taup ToolKit:Flexible seismic travel-time and ray-path utilities[J]. Seismo Res Lett,70(2):154–160. doi: 10.1785/gssrl.70.2.154
Di Leo J F,Wookey J,Hammond J O S,Kendall J M,Kaneshima S,Inoue H,Yamashina T,Harjadi P. 2012a. Mantle flow in regions of complex tectonics:Insights from Indonesia[J]. Geochem Geophys Geosyst,13(12):Q12008.
Di Leo J F,Wookey J,Hammond J O S,Kendall J M,Kaneshima S,Inoue H,Yamashina T,Harjadi P. 2012b. Deformation and mantle flow beneath the Sangihe subduction zone from seismic anisotropy[J]. Phys Earth Planet Inter,194-195:38–54. doi: 10.1016/j.pepi.2012.01.008
Dziewonski A M,Chou T A,Woodhouse J H. 1981. Determination of earthquake source parameters from waveform data for studies of global and regional seismicity[J]. Journal of Geophysical Research:Solid Earth,86(B4):2825–2852. doi: 10.1029/JB086iB04p02825
Eakin C M,Long M D,Scire A,Beck S L,Wagner L S,Zandt G,Tavera H. 2016. Internal deformation of the subducted Nazca slab inferred from seismic anisotropy[J]. Nat Geosci,9(1):56–59. doi: 10.1038/ngeo2592
England P,Houseman G. 1986. Finite strain calculations of continental deformation 2:Comparison with the India-Asia collision zone[J]. J Geophys Res:Solid Earth,91(B3):3664–3676. doi: 10.1029/JB091iB03p03664
England P,Molnar P. 1990. Right-lateral shear and rotation as the explanation for strike-slip faulting in eastern Tibet[J]. Nature,344(6262):140–142. doi: 10.1038/344140a0
Gripp A E,Gordon R G. 2002. Young tracks of hotspots and current plate velocities[J]. Geophys J Int,150(2):321–361. doi: 10.1046/j.1365-246X.2002.01627.x
Hall R,Spakman W. 2015. Mantle structure and tectonic history of SE Asia[J]. Tectonophysics,658:14–45. doi: 10.1016/j.tecto.2015.07.003
Hammond J O S,Wookey J,Kaneshima S,Inoue H,Yamashina T,Harjadi P. 2010. Systematic variation in anisotropy beneath the mantle wedge in the Java-Sumatra subduction system from shear-wave splitting[J]. Phys Earth Planet Inter,178(3/4):189–201.
Holtzman B K,Kohlstedt D L,Zimmerman M E,Heidelbach F,Hiraga T,Hustoft J. 2003. Melt segregation and strain partitioning:Implications for seismic anisotropy and mantle flow[J]. Science,301(5637):1227–1230. doi: 10.1126/science.1087132
Huang Z C,Wang L S,Zhao D P,Mi N,Xu M J. 2011. Seismic anisotropy and mantle dynamics beneath China[J]. Earth Planet Sci Lett,306(1/2):105–117.
Huang Z C,Zhao D P,Wang L S. 2015. P wave tomography and anisotropy beneath Southeast Asia:Insight into mantle dynamics[J]. J Geophys Res:Solid Earth,120(7):5154–5174. doi: 10.1002/2015JB012098
Huang C Y,Wang P X,Yu M M,You C F,Liu C S,Zhao X X,Shao L,Zhong G F,Yumul G P Jr. 2019. Potential role of strike-slip faults in opening up the South China Sea[J]. Natl Sci Rev,6(5):891–901. doi: 10.1093/nsr/nwz119
Hung T D,Yang T,Le B M,Yu Y Q. 2019. Effects of failure of the ocean-bottom seismograph leveling system on receiver function analysis[J]. Seismol Res Lett,90(3):1191–1199. doi: 10.1785/0220180276
Hung T D,Yang T,Le B M,Yu Y Q,Xue M,Liu B H,Liu C G,Wang J,Pan M H,Huong P T,Liu F,Morgan J P. 2021. Crustal structure across the extinct mid-ocean ridge in South China Sea from OBS receiver functions:Insights into the spreading rate and magma supply prior to the ridge cessation[J]. Geophys Res Lett,48(3):e2020GL089755.
Jiang X,Wang Z C. 2021. A critical review of existing models for the origin of the South China Sea and a new proposed model[J]. J Asian Earth Sci:X,6:100065.
Karig D E. 1971. Origin and development of marginal basins in the Western Pacific[J]. J Geophys Res,76(11):2542–2561. doi: 10.1029/JB076i011p02542
Kennett B L N,Engdahl E R. 1991. Traveltimes for global earthquake location and phase identification[J]. Geophys J Int,105(2):429–465. doi: 10.1111/j.1365-246X.1991.tb06724.x
Kuo B Y,Chen C C,Shin T C. 1994. Split S waveforms observed in northern Taiwan:Implications for crustal anisotropy[J]. Geophys Res Lett,21(14):1491–1494. doi: 10.1029/94GL01254
Le B M,Yang T,Chen Y J,Yao H J. 2018. Correction of OBS clock errors using Scholte waves retrieved from cross-correlating hydrophone recordings[J]. Geophys J Int,212(2):891–899. doi: 10.1093/gji/ggx449
Li C F,Song T R. 2012. Magnetic recording of the Cenozoic oceanic crustal accretion and evolution of the South China Sea basin[J]. China Science Bulletin,57(24):3165–3181. doi: 10.1007/s11434-012-5063-9
Li L, Xue M, Yang T, Liu C, Hua Q, Le B M, Xia S, Huang H, Pan M, Huo D. 2016. A comparison of various methods of determining the horizontal orientation of Ocean Bottom Seismometers (OBS): Applying to South China Sea OBS data[C]//AGU Fall Meeting. San Francisco: American Geophysical Union: 2016AGUFMOS51C2090L
Long M D,Silver P G. 2008. The subduction zone flow field from seismic anisotropy:A global view[J]. Science,319(5861):315–318. doi: 10.1126/science.1150809
Long M D,Becker T W. 2010. Mantle dynamics and seismic anisotropy[J]. Earth Planet Sci Lett,297(3-4):341–354. doi: 10.1016/j.jpgl.2010.06.036
Mainprice D,Tommasi A,Couvy H,Cordier P,Frost D J. 2005. Pressure sensitivity of olivine slip systems and seismic anisotropy of Earth’s upper mantle[J]. Nature,433(7027):731–733. doi: 10.1038/nature03266
Miyashiro A. 1986. Hot regions and the origin of marginal basins in the western Pacific[J]. Tectonophysics,122(3/4):195–216.
Morley C K. 2002. A tectonic model for the Tertiary evolution of strike–slip faults and rift basins in SE Asia[J]. Tectonophysics,347(4):189–215. doi: 10.1016/S0040-1951(02)00061-6
Rangin C,Klein M,Roques D,Le Pichon X,Van Trong L. 1995. The Red River fault system in the Tonkin Gulf,Vietnam[J]. Tectonophysics,243(3/4):209–222.
Savage M K. 1999. Seismic anisotropy and mantle deformation:What have we learned from shear wave splitting?[J]. Rev Geophys,37(1):65–106. doi: 10.1029/98RG02075
Shen Z K,Zhao C K,Yin A,Li Y X,Jackson D D,Fang P,Dong D N. 2000. Contemporary crustal deformation in East Asia constrained by global positioning system measurements[J]. J Geophys Res:Solid Earth,105(B3):5721–5734. doi: 10.1029/1999JB900391
Silver P G,Chan W W. 1988. Implications for continental structure and evolution from seismic anisotropy[J]. Nature,335(6185):34–39. doi: 10.1038/335034a0
Silver P G,Chan W W. 1991. Shear wave splitting and subcontinental mantle deformation[J]. J Geophys Res:Solid Earth,96(B10):16429–16454. doi: 10.1029/91JB00899
Silver P G. 1996. Seismic anisotropy beneath the continents:Probing the depths of geology[J]. Annu Rev Earth Planet Sci,24:385–432. doi: 10.1146/annurev.earth.24.1.385
Song W K,Yu Y Q,Gao S S,Liu K H,Fu Y F. 2021. Seismic anisotropy and mantle deformation beneath the central Sunda Plate[J]. J Geophys Res:Solid Earth,126(3):e2020JB021259.
Sun Z,Lin J,Qiu N,Jian Z M,Wang P X,Pang X,Zheng J Y,Zhu B D. 2019. The role of magmatism in the thinning and breakup of the South China Sea continental margin[J]. Natl Sci Rev,6(5):871–876. doi: 10.1093/nsr/nwz116
Tapponnier P,Molnar P. 1976. Slip-line field theory and large-scale continental tectonics[J]. Nature,264(5584):319–324. doi: 10.1038/264319a0
Tapponnier P,Peltzer G,Le Dain A Y,Armijo R,Cobbold P. 1982. Propagating extrusion tectonics in Asia:New insights from simple experiments with plasticine[J]. Geology,10(12):611–616. doi: 10.1130/0091-7613(1982)10<611:PETIAN>2.0.CO;2
Tapponnier P, Peltzer G, Armijo R. 1986. On the mechanics of the collision between India and Asia[C]//Collision Tectonics. London: Geological Society, Special Publications, 19: 113–157.
Tapponnier P,Lacassin R,Leloup P H,Schärer U,Zhong D L,Wu H W,Liu X H,Ji S H,Zhang L S,Zhong J Y. 1990. The Ailao Shan/Red River metamorphic belt:Tertiary left-lateral shear between Indochina and South China[J]. Nature,343(6257):431–437. doi: 10.1038/343431a0
Taylor B, Hayes D E. 1983. Origin and history of the South China Sea basin[C]//The Tectonic and Geologic Evolution of Southeast Asian Seas and Islands: Part 2. Washington D C: AGU: 27: 23–56.
Teanby N A,Kendall J M,van der Baan M. 2004. Automation of shear-wave splitting measurements using cluster analysis[J]. Bull Seismol Soc Am,94(2):453–463. doi: 10.1785/0120030123
Wang C Y,Yang J M,Zhu W L,Zheng M L. 1995. Some problems in understanding basin evolution[J]. Earth Sci Front,2(3/4):29–44.
Wang L L,He X B. 2020. Seismic anisotropy in the Java-Banda and philippine subduction zones and its implications for the mantle flow system beneath the Sunda Plate[J]. Geochem Geophys Geosyst,21(4):e2019GC008658.
Wang P X,Huang C Y,Lin J,Jian Z M,Sun Z,Zhao M H. 2019. The South China Sea is not a mini-Atlantic:Plate-edge rifting vs intra-plate rifting[J]. Natl Sci Rev,6(5):902–913. doi: 10.1093/nsr/nwz135
Wu J,Suppe J. 2018. Proto-South China Sea plate tectonics using subducted slab constraints from tomography[J]. J Earth Sci,29(6):1304–1318. doi: 10.1007/s12583-017-0813-x
Xue M,Allen R. 2005. Asthenospheric channeling of the Icelandic upwelling:Evidence from seismic anisotropy[J]. Earth Planet Sci Lett,235(1/2):167–182.
Xue M,Le K P,Yang T. 2013. Seismic anisotropy surrounding South China Sea and its geodynamic implications[J]. Mar Geophys Res,34(3/4):407–429.
Yang T,Liu F,Harmon N,Le K P,Gu S Y,Xue M. 2015. Lithospheric structure beneath Indochina block from Rayleigh wave phase velocity tomography[J]. Geophys J Int,200(3):1582–1595. doi: 10.1093/gji/ggu488
Yu Y Q,Gao S S,Liu K H,Yang T,Xue M,Le K P,Gao J Y. 2018. Characteristics of the mantle flow system beneath the Indochina Peninsula revealed by teleseismic shear wave splitting analysis[J]. Geochem Geophys Geosyst,19(5):1519–1532. doi: 10.1029/2018GC007474
Zhao M H,Sibuet J C,Wu J. 2019. Intermingled fates of the South China Sea and Philippine Sea plate[J]. Natl Sci Rev,6(5):886–890. doi: 10.1093/nsr/nwz107
-
期刊类型引用(6)
1. 张志宏,侯作亮,杨士超,李梦莹,黄明威. 基于AMT的地电阻率观测场地优化选择研究——以辽宁新城子深井地电阻场地为例. 大地测量与地球动力学. 2025(04): 436-440 .  百度学术
百度学术
2. 王丽,李伟,沈红会,孙君嵩,李鸿宇. 地电阻率受高压输电线路架线施工干扰的判定. 华北地震科学. 2024(02): 102-108 . 百度学术
3. 曹原. 高导电率地质区间地铁杂散电流控制技术研究. 机电信息. 2024(11): 85-89 . 百度学术
4. 张宇,王兰炜,胡哲,张世中,张兴国,娄晓宇. 加权平均算法在地电阻率日均值计算中的应用. 地震. 2023(02): 25-37 . 百度学术
5. 李雪浩,何思源,李国超,刘华姣,廖绍欢,赵乃千. 成都地震监测中心站地电阻率交、直流观测系统对比分析. 地震地磁观测与研究. 2023(05): 118-124 . 百度学术
6. 刘建波,雷生学,张明东,刘文兵,刘金城,马义山. 用自然电位估算地铁干扰大小——以天津塘沽地震台为例. 地震地磁观测与研究. 2023(05): 107-117 . 百度学术
其他类型引用(1)


计量
- 文章访问数: 406
- HTML全文浏览量: 139
- PDF下载量: 158
- 被引次数: 7
