

Seismicity of the Antarctic Great Wall Station area during 2015−2017
-
摘要:
基于交错网格搜索的单台定位方法对长城站地震台2015—2017年期间记录的宽频带三分量波形数据进行了单台地震定位研究,定位了112个高信噪比的近震,获得了此期间南设得兰群岛及其周边地区的地震分布图。结果显示,地震主要沿NE向展布于南设得兰群岛及邻区,最大震级为ML4.8,最小震级为ML1.3,震源深度范围为2—134 km。相对于稳定的南极大陆内部,长城站地区的地震活动性较强,在靠近南设得兰海沟的弧前区域和布兰斯菲尔德海峡弧后区域发现了可能与俯冲和岩浆活动有关的地震事件,弧前中源深度的地震事件说明该区域可能存在俯冲作用,这直接给出了菲尼克斯板块的俯冲活动仍在继续的地震学证据。
Abstract:The South Shetland Islands are located at the northern part of the Antarctic Peninsula in the West Antarctica. The region is subject to the direct or indirect influences from the Pacific Plate, the Antarctic Plate, the South American Plate, the Scotia Plate and the Phoenix Plate, which has resulted in significant tectonic activities, including subduction, rifting and volcanic magmatism. The global earthquake catalog shows that this region exhibits a higher level of seismicity in comparison to the stable Antarctic continent interior. The extreme climatic conditions of the Antarctic continent present significant challenges to seismic observation, and the level of seismological research conducted on the continent is limited. The distribution of seismic stations in the South Shetland Islands region is relatively sparse, which limits the seismic monitoring capacity of the region and consequently affects our understanding of the seismicity in the region. The Chinese Antarctic Great Wall Seismic Station (CCZ) is located on King George Island in the South Shetland Islands. Following the reconstruction and resumption of observation in 2010, the quality of seismic observation has been remarkably enhanced, thereby considerably improving the monitoring capability of small earthquakes in the Great Wall Station area and providing data support for a comprehensive understanding of the seismicity in the South Shetland Islands region.
We used the single station location method of interlaced grid search to obtain earthquake catalog based on the broadband three-component waveform data recorded at CCZ during 2015−2017. Firstly, the P wave and S wave arrivals of the local seismic events are identified through visual analysis, and the events with clear Pg and Sg waves are selected for amplitude measurements. The arrival time difference, incidence angle and back azimuth of the events can be calculated. The interlaced grid search method initially establishes a set of grids for searching and location, and searching for three elements of arrival time difference, incidence angle, and back azimuth, respectively. Then subsequently spatially translates the grids to obtain the location results of searching different grids. Finally, it evaluates the location results by calculating the standard deviation of the results obtained by the same set of data in the search of different grids. This method effectively overcomes the limitations of single set grid searching and location by a spatial intersection of multiple sets of grids. It has the potential to enhance the spatial sampling rate of earthquake location while simultaneously ensure the reliability and precision of the outcomes through the integration of multiple grid systems in space.
In this study, 1 452 local seismic events were identified, and 112 events with high signal-to-noise ratios were located, of which 87% of the events have an epicentral distance standard deviation and a depth standard deviation smaller than the grid division size of 1.0 km, indicating that the differences of grid models have less influence on the results in the location method of interlaced grid search, and the location results are stable and reliable. In this study, the earthquake catalog of CCZ and the events distribution in South Shetland Islands and its surrounding areas are obtained. During this period, the comparison between the CCZ catalog and the ANSS catalog in terms of magnitude, focal depth, and the number of located events suggests that CCZ effectively improves the seismic monitoring capability of the area, and that the use of direct P wave initial amplitude for calculating the angle of incidence better constrains the focal depth of local seismic events. The distribution of events shows that the events mainly spread along the NE direction in the South Shetland Islands region, with the maximum magnitude of ML4.8, the minimum magnitude of ML1.3, and the focal depth ranging from 2 to 134 km. The seismicity in the Antarctic Great Wall Station area is stronger than that of the stable interior of the Antarctic continent. The spreading of the Bransfield Strait was accompanied by extensive volcanism, and this study identifies clusters of earthquakes on Deception Island and its eastern flanks, as well as in the southern part of Greenwich Island, that may be related to the volcanic magmatism caused by subduction. Eleven events with focal depths exceeding 100 km, which have occurred beneath the lithosphere, were detected in the forearc region close to the South Shetland Trench. The locations of these events suggest that the subduction may have occurred in this region, which provides direct seismological evidence that the subduction of the Phoenix Plate is still continuing.
-
引言
需求和满意度研究是公共服务研究的重要内容,许多政府部门通过抽样调查开展需求和满意度测评,例如:国务院发展研究中心开展的中国民生满意度调查(国务院发展研究中心“中国民生调查”课题组,2019);中国气象局开展的全国公众气象服务评价调查(中国气象局,2022)等。近年来,防震减灾公共服务快速发展,亟需社会和公众的需求和反馈,相关研究正在起步(郭媛等,2019;连尉平等,2021a,b)。防震减灾公共服务主要有日常的公共服务和地震灾害发生后的抗震救灾、恢复重建等公共服务两大类,差别较大,本文主要研究日常防震减灾公共服务。不同于医疗教育等其它公共服务,日常的防震减灾公共服务有自身特点,主要以地震信息服务和咨询服务为主,对于一般公众来说,并不是日常生活不可或缺的紧要服务,而是一类可选择的服务,而且公众接受地震信息服务的频次较低,相比于公共气象服务等同类型公共服务要低得多。因此,对于防震减灾公共服务来说,在研究公众需求和反馈时,服务的公众触达情况也是必要的研究内容之一。公共服务需求和满意度研究在其它领域已经有较多讨论(姚秀萍等,2014),防震减灾领域的相关研究很少,地震预警和误报的社会影响、公众对地震预警的需求、误报接受程度等方面研究较多(郭凯等,2012;陈琳,张力文,2016;袁洁等,2019)。2018年,我们与国家统计局社情民调中心合作开展了一次全国范围的防震减灾公共服务需求和满意度研究,提出了防震减灾公共服务公众知晓度、公众满意度等指标,并获取了年度调查研究成果(董丽娜等,2020)。在2018年研究的基础上,中国地震局发展研究中心对其进行改进并形成防震减灾公共服务公众接触率、公众满意度调查指标体系,应用于2020年中国地震局开展的首次防震减灾公共服务需求调查和满意度评估,研究分析得到现阶段防震减灾公共服务公众触达和反馈的特点,以及全国公众地震预警需求的特点。
1. 研究方法
2018年的调查中,我们通过地震应急演练知晓度和参与度、防震减灾知识科普接触度、应急避难场所知晓度、防灾减灾日知晓度、农居地震安全工程知晓度、防震减灾示范城市知晓度等方面来研究防震减灾公共服务公众触达,通过地震应急演练公众满意度、防震减灾知识科普公众满意度、地震信息获取便利度和地震部门信息发布权威认可程度等来研究防震减灾公共服务公众满意度。调查过程和研究结果显示:由于公众触达和公众满意度对应的公共服务项目不一致,涉及服务项目过多,给公众调查造成了一定困难;有些服务项目如防震减灾示范城市,其自身的持续性不好,不利于今后调查数据的连续性;公众满意度测量维度不够细致全面,获取的公众反馈缺乏针对性。
2020年调查中,我们以地震速报信息、防震减灾知识科普、各级地震部门门户平台、自建房抗震咨询、震后灾区应急服务等当前面向公众的主要地震信息服务作为服务项目代表,研究服务的公众触达,获取公众更有针对性的满意度反馈。由于近年来地震灾害平缓,2020年调查中获取的全国公众震后灾区应急服务有效样本仅212个,本文不再介绍。
1.1 防震减灾公共服务公众触达的度量
公众日常与地震信息服务接触的多少,一方面与公众的防震减灾意识有关,另一方面,也依赖于相关部门和组织的工作效率提升。因此,需要准确了解防震减灾公共服务在公众中的触达情况。
在2018年调查指标(董丽娜等,2020)的基础上,设计防震减灾公共服务公众接触率指标(表1),用接触率指标衡量防震减灾公共服务的公众接触情况,量化评价防震减灾公共服务在公众中的触达现状,用于分析防震减灾公共服务的公众接触总体情况、人群与区域特征,以及各分项服务的公众接触情况。
表 1 防震减灾公共服务公众接触率指标Table 1. Index table of public reach of earthquake disaster mitigation services指标名称 指标赋值和计算方法 地震速报信息接触率 接触过地震速报信息人数占全部有效样本的比例 防震减灾知识科普接触率 接触过防震减灾知识科普人数占全部有效样本的比例 各级地震部门门户平台接触率 接触过至少一种门户平台的人数占全部有效样本的比例 自建房抗震咨询服务接触率 知晓自建房抗震咨询服务人数占居住地在农村有效样本的比例 1.2 防震减灾公共服务满意程度的度量
目前度量满意程度的方法主要有满意率、满意度和满意度指数模型(刘武,2009)等。防震减灾公共服务是典型的公共产品,通常意义下的满意程度的评价思路和方法均可适用。满意率相对更定性,满意度更量化,波动更小,满意度指数侧重从总体和综合的角度进行评价。因此,我们采用带五级量表的满意度来量化测量公众对防震减灾公共服务的满意程度。
防震减灾公共服务公众满意度评价不仅要给出服务反馈的总体特征,还要对服务工作的具体环节和不同属性特征进行评价,以便找出优势环节和不足之处,有针对性地改进工作。因此,需要开展多维度的满意度评价,形成防震减灾公共服务公众满意度测评指标体系(表2)。指标体系运用层次化结构设定评价指标,以防震减灾公共服务公众总体满意度为一级指标,设有二级评价指标3个,包括地震速报信息服务、防震减灾知识科普和各级地震部门门户平台,作为影响公众满意度的最主要因素。针对这3个二级指标,又分别选取了对其满意度影响最大的因素作为三级评价指标,共计10个。
表 2 防震减灾公共服务公众满意度测评三级指标表Table 2. Three-level index table for public satisfaction evaluation of earthquake disaster mitigation services一级指标 二级指标 三级指标 防震减灾
公共服务
公众总体
满意度地震速报信息满意度
(50%权重)信息发布及时性(50%权重) 获取渠道便捷性(50%权重) 防震减灾知识科普
满意度 (30%权重)内容通俗易懂性(1/3权重) 内容实用性(1/3权重) 渠道便捷性(1/3权重) 各级地震部门门户平台
满意度 (20%权重)地震速报微博满意度(20%权重) 12322咨询电话满意度(20%权重) 各级地震部门相关微信公众号满意度(20%权重) 各级地震部门相关微博满意度(20%权重) 各级地震部门相关网站满意度(20%权重) 在指标体系中,单项服务单维度满意度为三级指标,直接在调查中测量,由接触过某项防震减灾服务的公众对该服务的某个方面进行量化打分。满意度评价题目由5级李克特量表构成,计分原则为“非常满意”5分、“比较满意”4分、“一般”3分、“不太满意”2分、“非常不满意”1分,再将加权算术平均值转化成百分制,具体转换方式为,末级指标满意度得分为P1×100+P2×80+P3×60+P4×40+P5×20,其中,P1为“非常满意”占比,P2为“比较满意”占比,P3为“一般”占比,P4为“不太满意”占比,P5为“非常不满意”占比。一级指标和二级指标不能在调查中直接测量,二级指标的满意度得分要根据三级指标的评价结果计算得出,一级指标也就是防震减灾公共服务公众总体满意度,则要根据二级指标的评价结果计算得出。
指标权重方面,综合考量地震速报信息、防震减灾科普和各级地震门户平台的公众触达情况以及在服务工作中的重要性,通过专家调查法确定二级指标计算一级指标的最终权重。三级指标集合计算二级指标的权重,通过专家调查法设计为等权。
1.3 地震预警公众需求的度量
围绕地震预警必要性、预警误报接受程度设置五级打分题,询问公众需求,对有需求的公众,进一步了解其期待的地震预警形式。根据地震预警必要性评价和误报接受程度两个变量的组合特征,研究公众对地震预警的需求强度。
1.4 受访者背景变量
除了采集受访者年龄、性别、居住地点、学历和职业等5个维度信息外,还进行东、中、西部地区(安树伟,2018)和地震多发区、地震少发区的比较,用于深入分析不同地区、不同群体公众的差异性特征。把发生地震灾害频次较高的省份,如新疆、四川、云南、西藏、青海、甘肃、河北、山东、福建、宁夏、辽宁、陕西和河南等归为地震灾害多发区,将浙江、贵州、广西、广东、江西、海南、湖南、湖北、江苏、黑龙江和内蒙古等地震灾害发生频次较低的区域归为地震灾害少发区(杨格格等,2011)。
1.5 2020年防震减灾公共服务需求调查和满意度评估
2020年7—11月,中国地震局开展了首次防震减灾公共服务需求调查和满意度评估,针对全国31个省份18—75周岁城乡居民开展随机电话调查和在线调查,同期还开展了全国公众防震减灾知识普及调查和科普满意度调查(连尉平等,2021b)。本文选取电话调查结果。电话调查以全国城乡居民为总体,以31个省(区、市)居民为子总体进行抽样设计,采用分层多阶段随机抽样方法抽选调查对象,利用计算机辅助电话调查。参考国家统计局2018年人口数据(国家统计局,2019),对样本性别、年龄、居住地采样结构进行了设计和配比控制。居住地的城乡属性,按照受访对象在接受问卷调查时常住在城镇还是农村来判断。
调查共拨打180万5 343个电话,获取1万8 083个成功样本,访问成功率约为1%。经审核清理,最终获得有效样本1万8 007个,样本有效率为99.6%。样本的性别(表3)、城乡结构分布(表4)、年龄(表5)与国家人口性别、城乡统计数据(国家统计局,国务院第七次全国人口普查领导小组办公室,2021a,b)、年龄统计数据(国家统计局,2019)相应结构分布的差值最大约为7%,一致性较好。其中,年龄人口数据来源于《中国统计年鉴(2019)》,人口比例统计数据为各年龄段人口统计数据占20—74岁人口统计总数的比例,由于调查年龄设置与人口统计数据年龄分段不一致,因此,18—24岁样本占比与人口统计的20—24岁数据相对应,65—75岁样本占比与人口统计的65—74岁数据相对应,作为参考。如表6—9列出了东、中、西部地区和地震多发及少发区、职业、学历等方面的样本分布结构情况。
表 3 调查样本性别结构及与总体的比较Table 3. Gender structure of survey samples and comparison with overall population性别 样本量 样本占比 人口比例统计数据 与总体差值 男 8 864 49.2% 51.2% 2% 女 9 143 50.8% 48.8% −2% 表 4 调查样本城乡结构及与总体的比较Table 4. Urban and rural structure of survey samples and comparison with overall population城乡 样本量 样本占比 人口比例统计数据 与总体差值 城镇 12 563 69.8% 63.9% −5.9% 农村 5 444 30.2% 36.1% 5.9% 表 5 调查样本年龄结构及与总体的比较Table 5. Age structure of survey samples and comparison with overall population年龄 样本量 样本占比 人口比例统计数据 与总体差值 18—24 1 806 10.0% 8.0% (20—24) 2.0% 25—29 2 167 12.0% 11.0% 1.0% 30—34 3 156 17.5% 11.0% 6.5% 35—39 2 280 12.7% 9.7% 3.0% 40—44 2 206 12.3% 9.9% 2.4% 45—49 1 536 8.5% 12.1% −3.6% 50—54 1 586 8.8% 11.4% −2.6% 55—59 1 847 10.3% 8.3% 2.0% 60—64 799 4.4% 8.0% −3.6% 65—75 624 3.5% 10.6% (65—74) −7.1% 表 6 调查样本东、中、西部结构Table 6. Proportion of survey samples in eastern,central and western regions地区 样本量 样本占比 东部地区 6 624 36.8% 中部地区 4 832 26.8% 西部地区 6 551 36.4% 表 7 调查样本地震多发区、地震少发区结构Table 7. Proportion of survey samples in earthquake prone areas and less prone areas地区 样本量 样本占比 地震多发区 7 421 41.2% 地震少发区 6 556 36.4% 表 8 调查样本职业结构Table 8. Occupational structure of survey samples职业 样本量 样本占比 职业 样本量 样本占比 机关、社会团体、事业单位人员 2 409 13.4% 务农农民 1 805 10.0% 企业人员 4 280 23.8% 务工/经商农民 687 3.8% 个体经营者 2 426 13.5% 学生 838 4.7% 自由职业者 1 798 10.0% 离退休人员 998 5.5% 无业/失业/待业/下岗 1 188 6.6% 拒答 420 2.3% 专业技术人员(律师/医生/会计等) 1 158 6.4% 表 9 调查样本学历结构Table 9. Education level structure of survey samples学历 样本量 样本占比 学历 样本量 样本占比 小学及以下 1 561 8.7% 大学本科 4 816 26.7% 初中 2 586 14.4% 硕士及以上 525 2.9% 高中/中专/技校 3 693 20.5% 拒答 724 4.0% 大学专科 4 102 22.8% 2. 数据分析与研究
单因素方差分析显示,各项防震减灾服务公众接触在城乡、东中西部地区、地震多发区和少发区、年龄、学历、职业等群体上存在显著性差异,P值均小于等于0.001。
2.1 防震减灾公共服务公众触达
调查结果显示,分别有80.7%,56.2%和29.5%的受访者接触过地震速报信息服务、防震减灾知识科普和自建房抗震咨询服务。需要说明的是,自建房抗震咨询服务的计算总体为居住地在农村的样本总量(5 444个)。地震速报信息服务公众接触率远高于其它类型服务。
公众对各级地震部门门户平台的整体接触率为26.7%,即26.7%的公众接触过至少一种地震门户平台。公众对各级地震部门相关微信公众号的接触率(11.6%)最高,其它依次是各级地震部门相关微博(9.7%)、各级地震部门相关网站(9.0%)、地震速报微博(4.7%)、12322咨询电话(3.5%)。
各项防震减灾公共服务公众接触率总体呈现出以下区域特征(表10):西部地区显著高于中部、东部地区;地震多发区显著高于地震少发区;城镇地区接触率高于农村地区,防震减灾知识科普的城乡差异尤为明显。中青年、机关事业单位人员、学生、高学历者为主要接触群体,低学历群体、农民群体和老年人是触达难点。
表 10 不同区域公众的各项防震减灾公共服务接触率差异率Table 10. Differences in public reach to various earthquake disaster mitigation services in different regions不同区域 地震速报
信息组内差值 防震减灾
知识科普组内差值 各级地震部门
门户平台组内差值 自建房抗震
咨询服务组内差值 东部地区 ↓77.9 5.4 ↓52.2 7.6 ↓25.3 5.5 ↓25.1 8.5 中部地区 →80.9 →56.9 ↓24.4 →30.2 西部地区 ↑83.4 ↑59.8 ↑29.9 ↑33.6 城镇 ↑84.2 11.6 ↑61.7 17.9 ↑28.5 5.8 农村 ↓72.6 ↓43.7 ↓22.7 地震多发区 ↑84.1 7.0 ↑61.7 11.1 →28.2 3.0 →30.7 2.5 地震少发区 ↓77.2 ↓50.6 →25.2 →28.2 注:组内差值是指在同一分组内,不同区域的最大接触率与最小接触率的差值;自建房抗震咨询服务仅针对农村地区,故不作城乡比较;同一分类维度中,↑代表接触率相对较高,→代表差异不大,↓代表接触率相对较低 电视依然是公众接触地震速报信息的首要渠道(图1a)。电视、微信(含小程序和公众号)、咨询类APP是公众接触地震速报信息的主要渠道,48.6%的受访者通过电视接触地震速报信息,与2018年调查显示的64.4%相比,已经有大幅下降。移动互联网(68.3%)成为公众获取防震减灾知识的主要来源,电视(53.4%)位列第二,两者显著高于其它获取渠道(图1b)。
![]() 图 1 公众地震速报信息(N=14 533)(a)及公众防震减灾知识(N=10 127)(b)获取渠道Figure 1. Public access to earthquake quick report (N=14 533)(a) and earthquake knowledge (N=10 127)(b)
图 1 公众地震速报信息(N=14 533)(a)及公众防震减灾知识(N=10 127)(b)获取渠道Figure 1. Public access to earthquake quick report (N=14 533)(a) and earthquake knowledge (N=10 127)(b)2.2 防震减灾公共服务公众满意度
接触过某项服务的公众,才会对该服务进行评价。因此各项服务评价的样本数量不同,地震速报信息服务、防震减灾知识科普和各级地震部门门户平台评价的样本量分别为14 533,10 127,4 815,调查结果显示,2020年全国公众对防震减灾公共服务的总体满意度为88.65分,较2018年调查中防震减灾公共服务公众总体满意度得分81.22分有较大幅度上升。其中,各级地震部门门户平台的满意度(90.54分)超过90分,防震减灾知识科普(88.60分)和地震速报信息公众满意度评价(87.92分)相对略低。
公众对地震速报信息及时性(86.90分)的满意度评价显著低于获取渠道便利性(88.95分),值得关注。近年来地震速报的时效性和精准性不断提升(刘杰,侯建民,2020),但是公众显然没有感受到这种已经发展到亚分钟级的进步。结合上一节公众触达的调查结果分析,我们认为,问题很可能出在地震速报信息传播的“最后一公里”。地震速报微博是面向公众的地震速报信息快速传播渠道,接触过的公众非常认可,满意度高达91.52分,但是仅有4.7%的公众接触过地震速报微博,大量公众是通过电视接收地震速报信息,通过电视接收信息是相对被动的一种信息服务接受方式,接收到地震速报信息的及时性自然会受到影响。
公众对防震减灾知识科普的内容实用性(88.98分)和获取渠道便利性(88.96分)的评价高于内容通俗易懂性(87.86分),部分公众群体对知识科普的通俗易懂有较高的需求。
2.3 地震预警公众需求
88.3%的公众认为地震预警信息“有必要”,其中,77.0%的公众认为“非常有必要”,11.3%的公众认为“比较有必要”。对地震预警信息必要性选择一般及以上的受访者(17 249人),进一步追问其对地震预警误报的接受程度时,83.7%的公众对地震预警误报的接受度为“比较接受”和“完全接受”,与2011年的研究结果基本一致(郭凯等,2012),显示公众对地震预警误报的接受程度长时间保持在一个较高水平,比较稳定。
根据公众在“地震预警必要性评价”和“误报接受程度”两个变量高低组合上反映出的特征,可以将公众对地震预警的需求强度划分为3类:① 强需求群体,占比56.8%。群体需求特征为“即使不精准,也需要地震预警”,具体表现为两个变量双高,地震预警必要性评价和误报接受度选择均为“非常有必要”和“完全接受”;② 需求摇摆群体,占比25.4%。此类群体两个变量一高一低,包括两种情况,第一种是地震预警必要性评价为“非常有必要”,但对地震预警误报的接受度处于“比较接受”及以下,第二种是地震预警必要性评价处于“比较有必要”及以下,误报接受度为“完全接受”;③ 弱需求群体,占比17.8%。群体需求特征为“地震预警可以没有,但如果有则需要尽量精准”。具体表现为两个变量双低,地震预警必要性评价和误报接受度均处于“比较有必要”和“比较接受”及以下。
将北京、上海、四川和云南等地公众的地震预警需求和对地震预警误报的接受度与全国公众相应的总体水平进行比较(图2),可以看到,北京、上海、四川和云南等地公众的地震预警需求分别比全国公众总体水平高1.8%,3.1%,1.5%和2.8%,对地震预警误报的接受程度分别比全国公众总体水平高4.8%,2.1%,3.8%和1.5%。对比结果显示,经济发达、人口密集的大城市和地震多发区的公众对地震预警的需求和对地震预警误报的接受程度都明显更高。
![]() 图 2 北京、上海、四川、云南等地公众的地震预警需求水平和对地震预警误报的接受度总样本量为18 007,北京、上海、四川、云南的样本量分别为576,572,648,576Figure 2. The earthquake early warning needs of the public and their tolerance for false alarm in Beijing,Shanghai,Sichuan,YunnanThe total sample size is 18 007,and the sample sizes of Beijing,Shanghai,Sichuan and Yunnan are 576,572,648 and 576,respectively
图 2 北京、上海、四川、云南等地公众的地震预警需求水平和对地震预警误报的接受度总样本量为18 007,北京、上海、四川、云南的样本量分别为576,572,648,576Figure 2. The earthquake early warning needs of the public and their tolerance for false alarm in Beijing,Shanghai,Sichuan,YunnanThe total sample size is 18 007,and the sample sizes of Beijing,Shanghai,Sichuan and Yunnan are 576,572,648 and 576,respectively公众期待的地震预警方式主要为警报(大喇叭、村村响)(47%)、电话提醒(手机弹窗、铃声等)(36%)、微博、微信等手机软件弹窗(30.4%)和短信(28.3%),值得注意的是,仅12%的公众选择电视弹窗来接受地震预警信息,相对比较低。
3. 讨论与结论
本文设计的防震减灾公共服务公众接触率、公众满意度调查指标体系通过2020年的调查实践验证了其有效性,为后续的防震减灾公共服务公众触达和公众满意度研究奠定了合理可行的调查指标框架基础。2020年的调查获取了现阶段防震减灾公共服务的全国公众触达现状、反馈评价和地震预警需求的全面量化数据,可以为今后的防震减灾公共服务研究提供很好的参考。另一方面,本文防震减灾公共服务公众接触率计算方法还没有把调查方式、问卷回收率和访问成功率等影响因素考虑在内,后续需要在这方面开展相应研究。
调查研究结果显示,2020年防震减灾公共服务公众触达和公众满意度有显著的特点。在各项防震减灾公共服务中,东部地区、农村地区公众、低学历群体、农民群体、老年群体的接触率相对较低。地震速报信息服务公众接触率最高,但是满意度评价得分却相对较低,需要重视。公众反馈评价总体较好,可能与防震减灾服务在平时对于大部分公众来说是非必要和非高频服务有一定关系,公众了解不深,期待不多,在对政府整体满意的情况下容易作出礼貌性评价。这其中,地震速报信息公众接触最多,相对而言也最有期待,因此其满意度评价最有意义,但这一项评价却最低,这种相对低分实际上侧面反映了公众的想法。在进一步的分项评价中,地震速报信息及时性评价又显著低于获取渠道便利性,显示公众对地震速报信息发布时效性近年来取得的进步缺乏感受。各级地震部门信息门户平台公众接触率一般,但是满意度评价得分较高。有必要根据这些特点采取针对性的策略,如:推广地震速报信息公众订阅定制,通过APP通知或短信等方式,让有需求的公众用户能够有快捷接收信息的方式;注册运营音频、短视频、视频、直播等直观化的新媒体门户平台,进一步提升地震部门信息门户平台的公众触达等。
当前全国公众的地震预警需求也特点鲜明。大部分的公众认为地震预警有必要,公众对地震预警误报的接受程度在十年时间里也保持在较高水平,超过半数的公众对地震预警信息有强烈需求,即使不精准也需要地震预警,大城市和地震多发区公众的地震预警需求水平和对地震预警误报接受程度都显著更高。但是也应该看到,有高达17.8%的公众认为“地震预警可以没有,如果有就必须精准”,那么一旦发生误报、虚报等情况,负面舆论可能就会比较强烈。推进地震预警公众服务需要考虑这些情况,采取更稳妥的策略,比如更多地采用按需定制的方式推送警报,以及加强宣传教育,让更多公众理解地震预警原理中快和准的矛盾、预警盲区等问题。
-
![]()
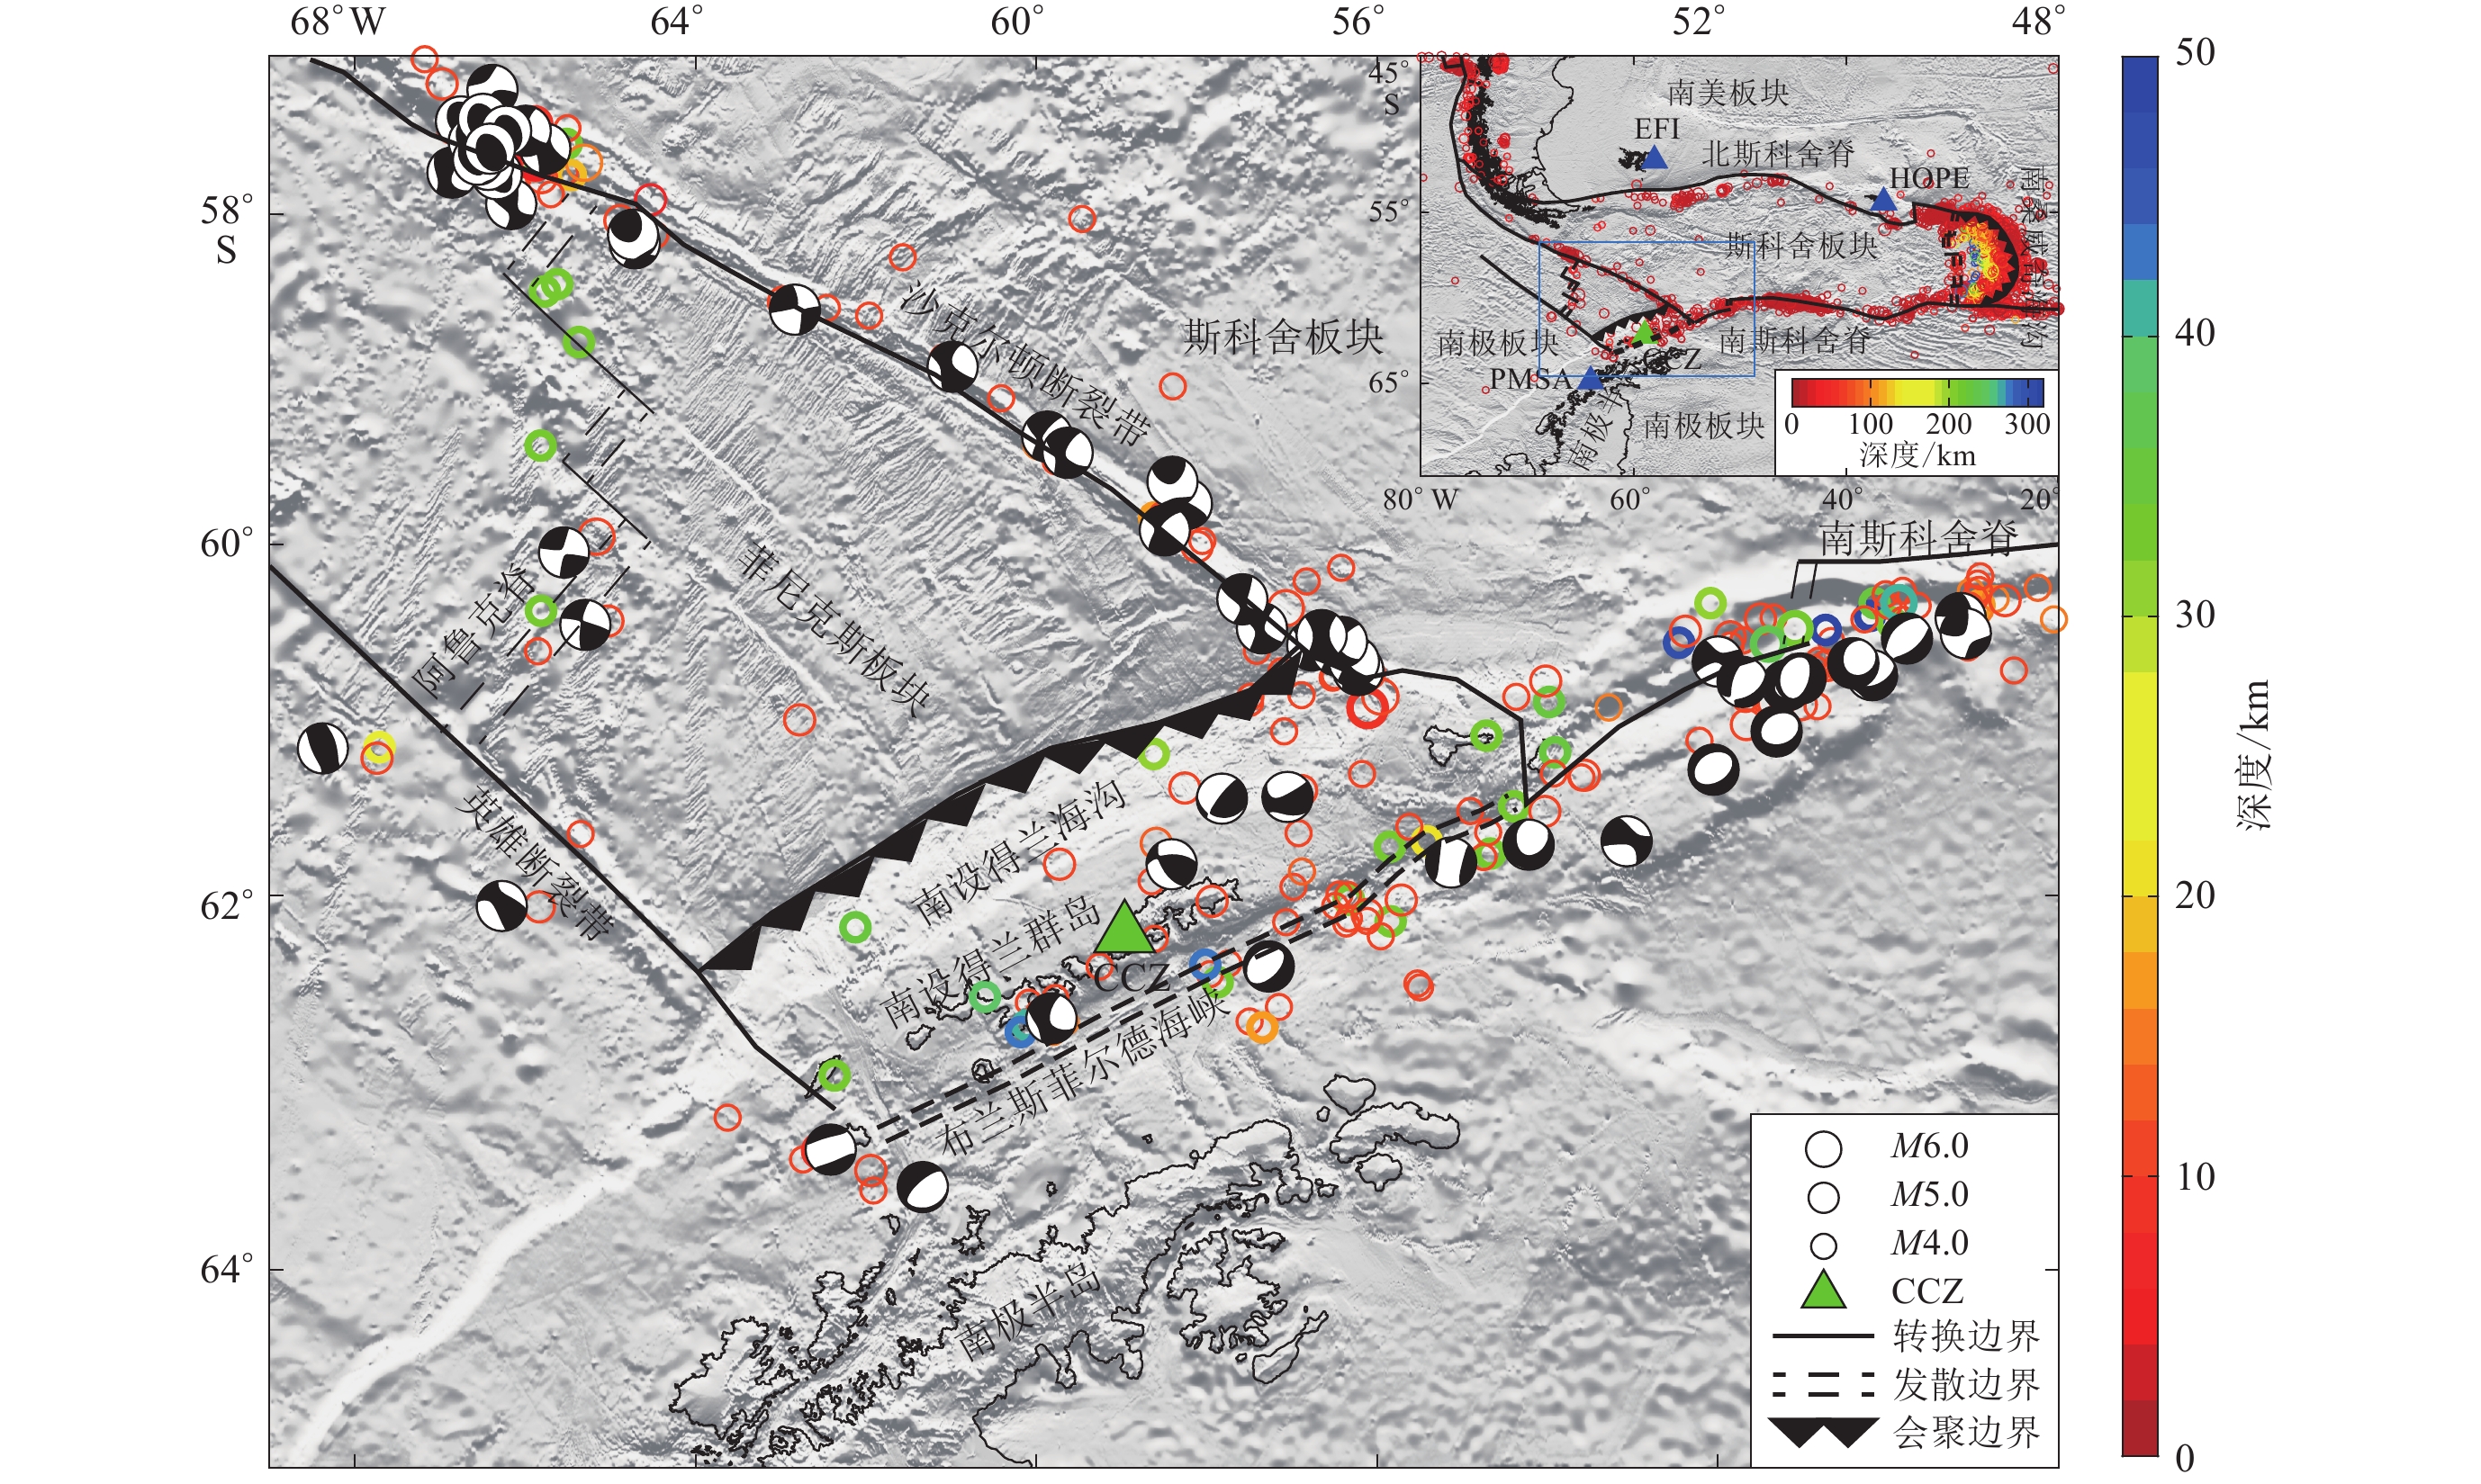
图 1 研究区构造背景
图中绿色三角形是中国南极长城站(CCZ)地震台的位置,地震数据来自美国国家地质调查局地震信息中心提供的1990—2017年的美国国家地震监测台网系统(Advanced National Seismic System,缩写为ANSS)综合地震目录(USGS,Earthquake Hazards Program,2017),震源机制解来自全球质心矩张量项目提供的1990—2017年的全球质心矩张量(Centroid-moment tensors,缩写为CMT)目录(Erik et al,2013),断层数据来自德克萨斯大学地球物理研究所的UTIG数据库(Institute of Geophysics,University of Texas,2015)和Dziak等(2010)。右上角插图为斯科舍板块及其周边的地震与台站分布,其中蓝色三角形是全球地震台网(GSN)的台站,蓝色方框代表主图的位置
Figure 1. Tectonic setting of studied area
The green triangle is the location of Chinese Great Wall Seismic Station (CCZ),Antarctic. The seismic data is from the ANSS Comprehensive Earthquake Catalog between 1990 and 2017,provided by USGS National Earthquake Information Center (USGS,Earthquake Hazards Program,2017). The focal mechanism solution is from CMT catalog between 1990 and 2017 provided by the Global Centroid-Moment-Tensor Project (Erik et al,2013). The fault data is from the University of Texas Institute for Geophysics database (Institute of Geophysics,University of Texas,2015) and Dziak et al (2010). The insert in the upper right is the distribution of earthquakes and seismic stations in and around the Scotia Plate,the blue triangles are Global Seismographic Network Stations,and the blue rectangle represents the location of the main figure
![]()
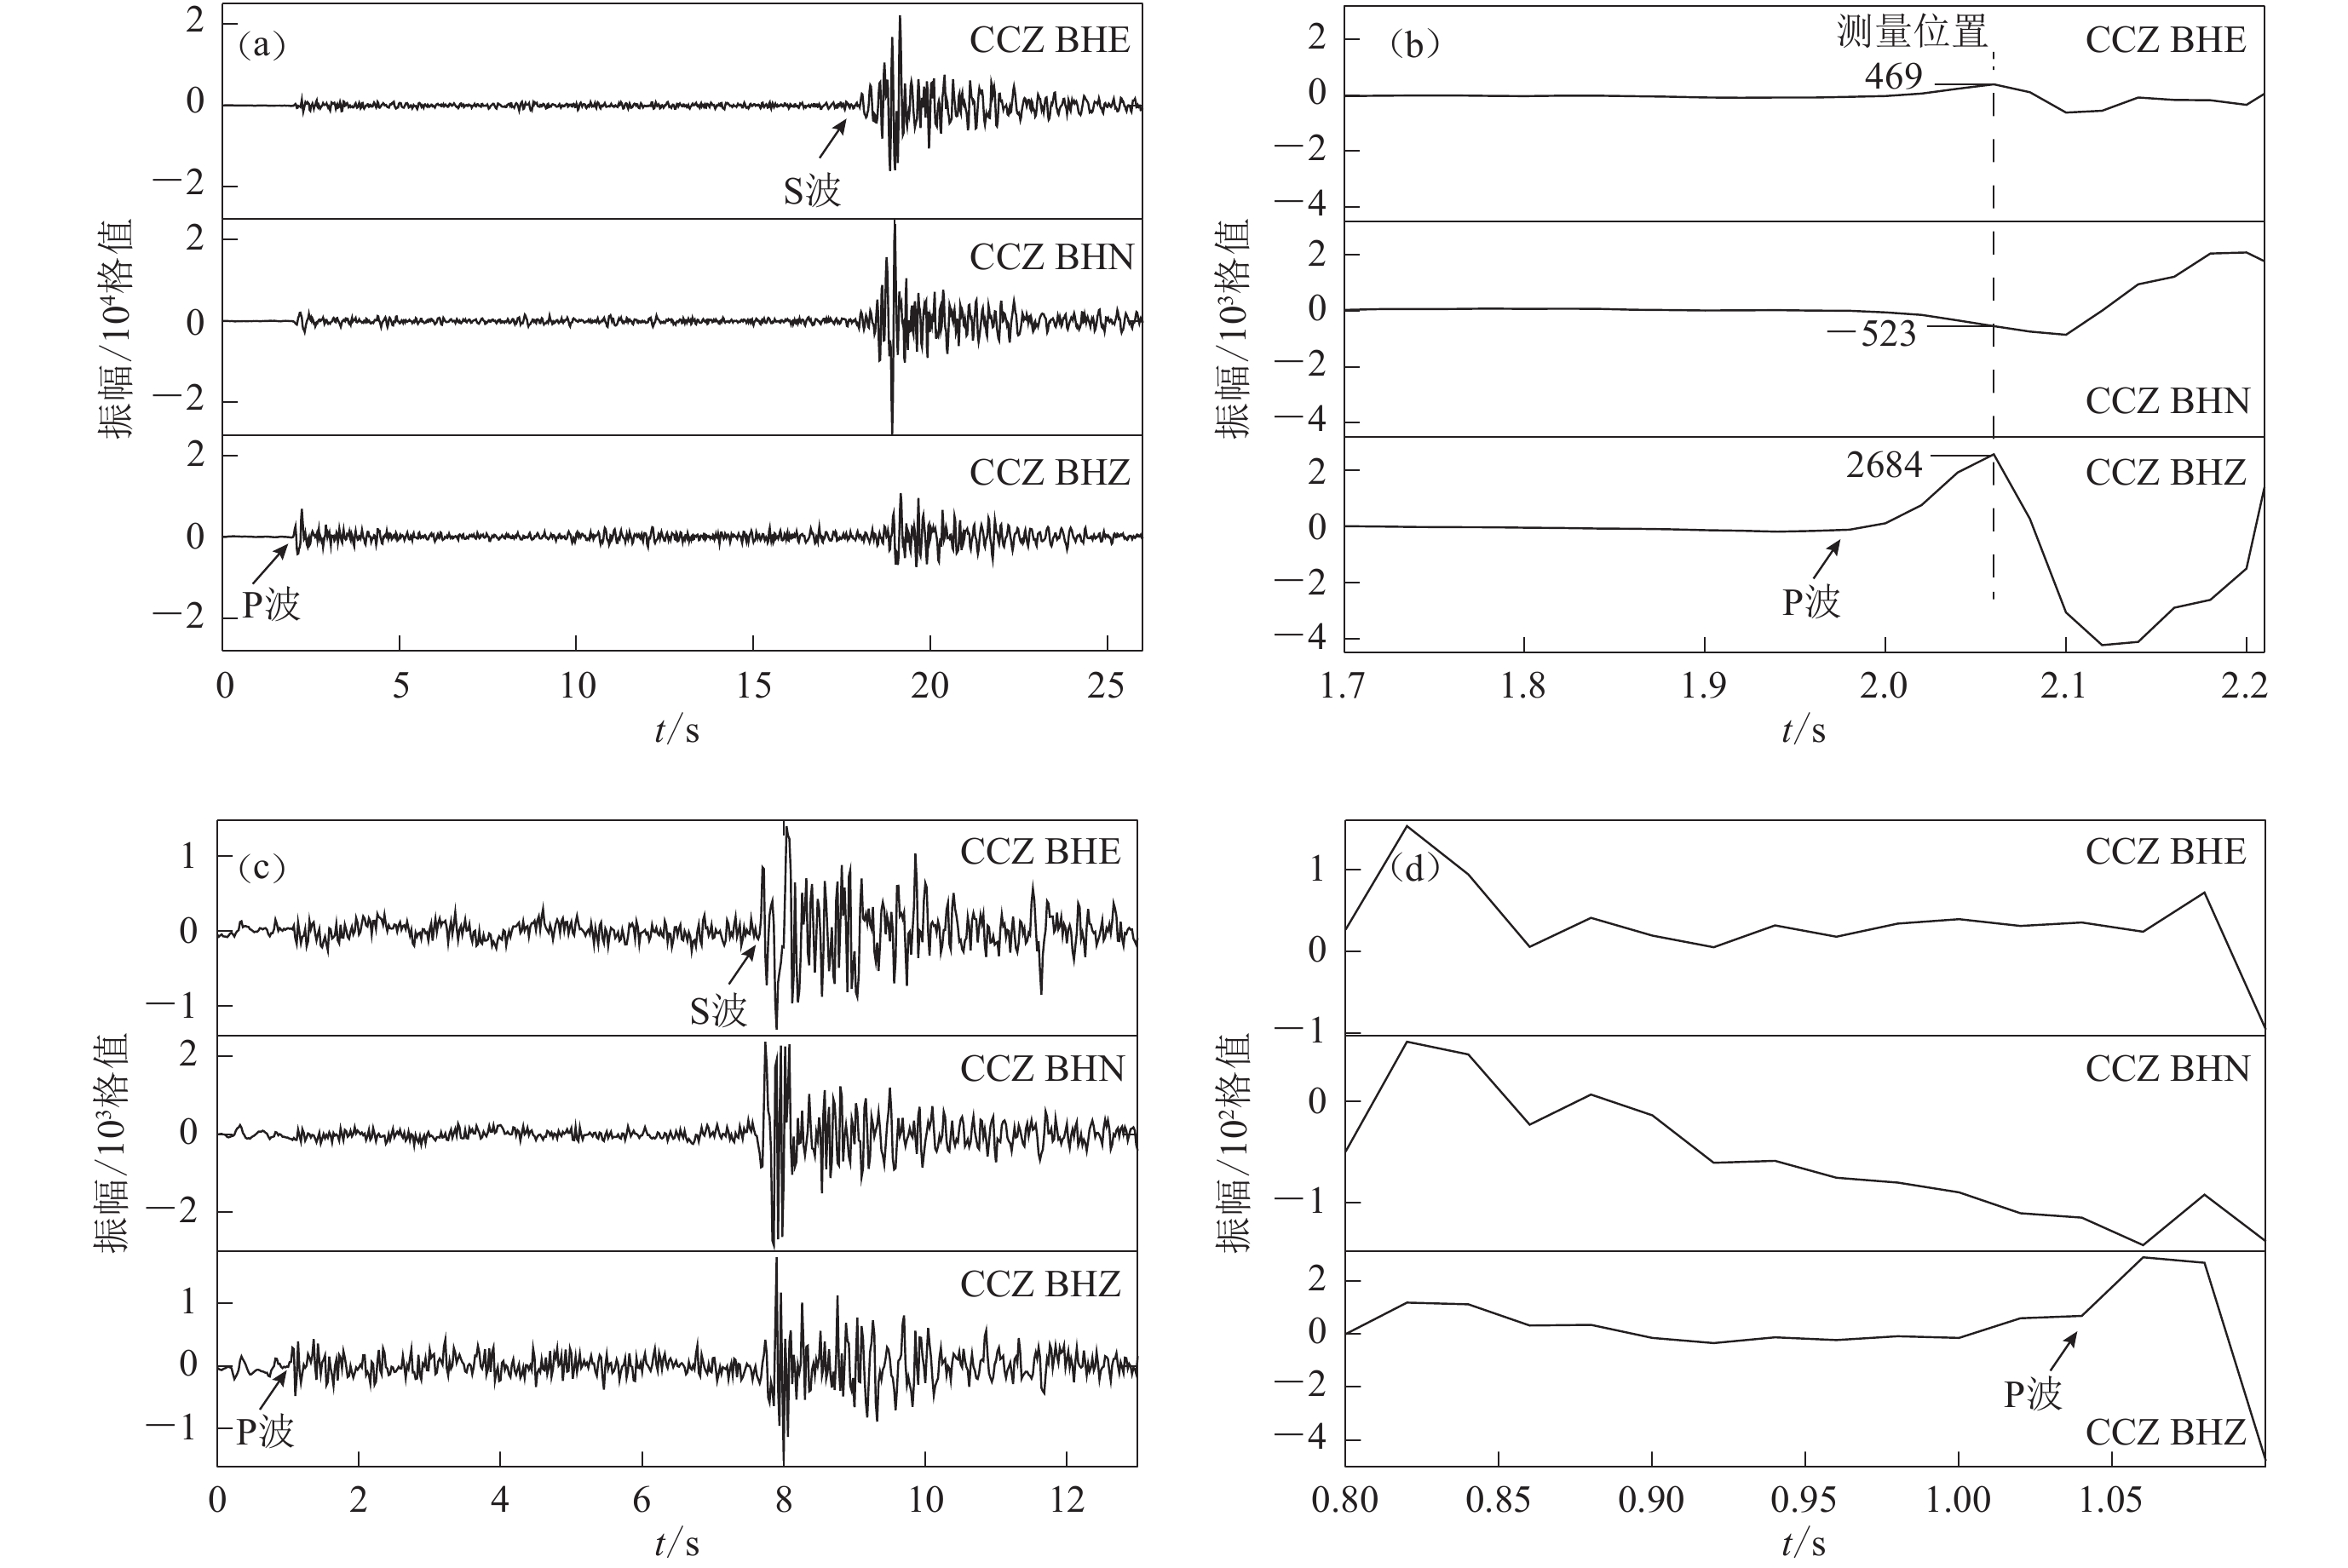
图 2 中国南极长城站地震台的近震波形记录
(a) 可定位地震事件的三分量波形记录;(b) 可定位地震事件的P波初动信号三分量记录;(c) 不可定位地震事件的三分量波形记录;(d) 不可定位地震事件的P波初动信号三分量记录
Figure 2. Near earthquake waveforms recorded at CCZ Station
(a) Three-component waveform recordings of a locatable seismic event;(b) Three-component recordings of P wave initial motion signal of a locatable seismic event;(c) Three-component waveform recordings of an unlocatable seismic event; (d) Three-component recordings of P wave initial motion signal of an unlocatable seismic event
![]()
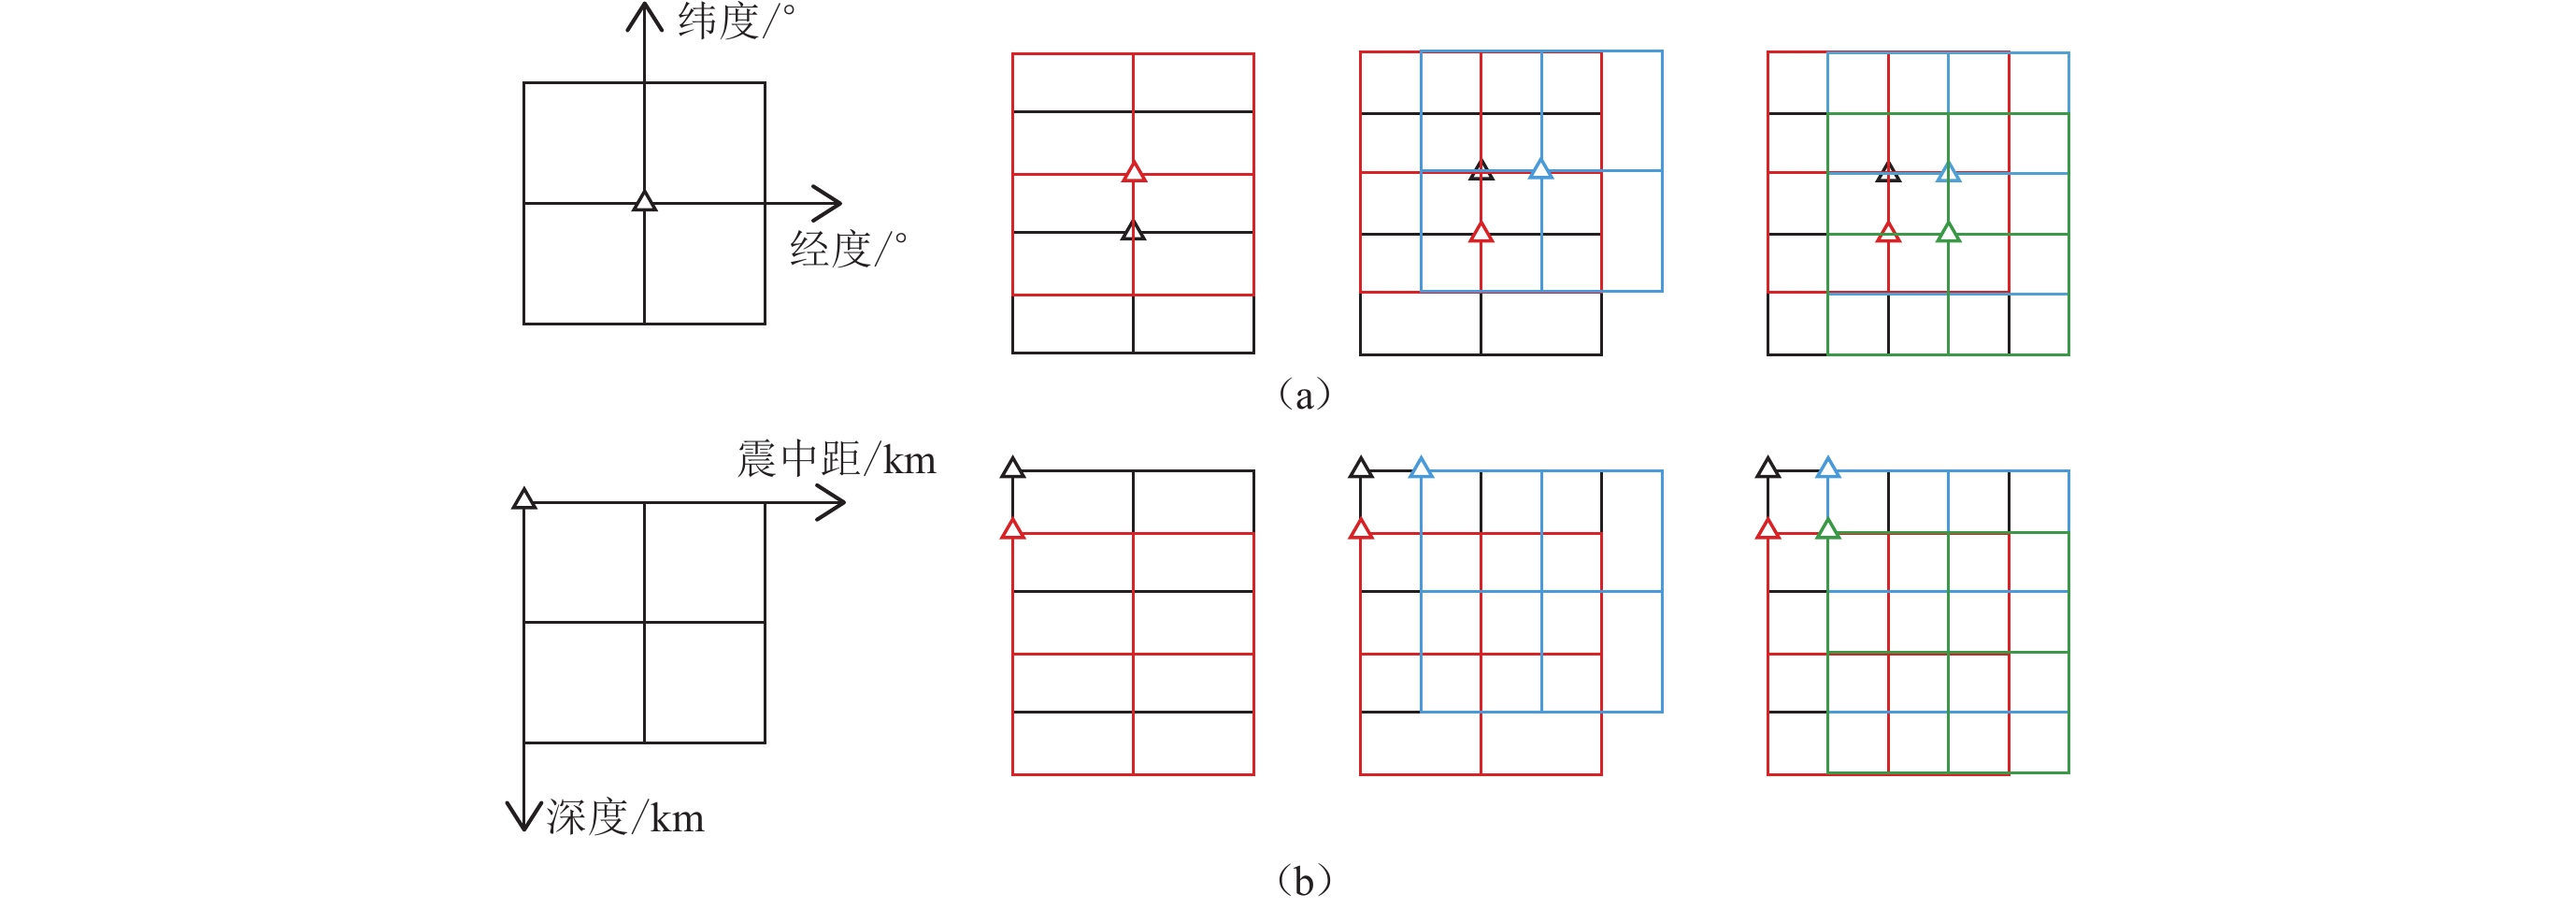
图 3 交错网格的构建
(a) 经度-纬度网格的平移过程;(b) 震中距-深度网格的平移过程黑色网格表示起始网格位置,红色、蓝色和绿色网格分别表示每一次移动后的网格位置,三角形表示台站。此示意图按小格尺寸的1/2为步长进行平移
Figure 3. The construction of interlaced gird
(a) The translation process of the longitude-latitude grid;(b) The translation process of the epicentral distance-depth grid The black grid represents initial grid position,the red,blue and green grids represent the grid position after each move respectively. The triangle represents seismic station. This diagram is translated by 1/2 of the small lattice size per step
![]()
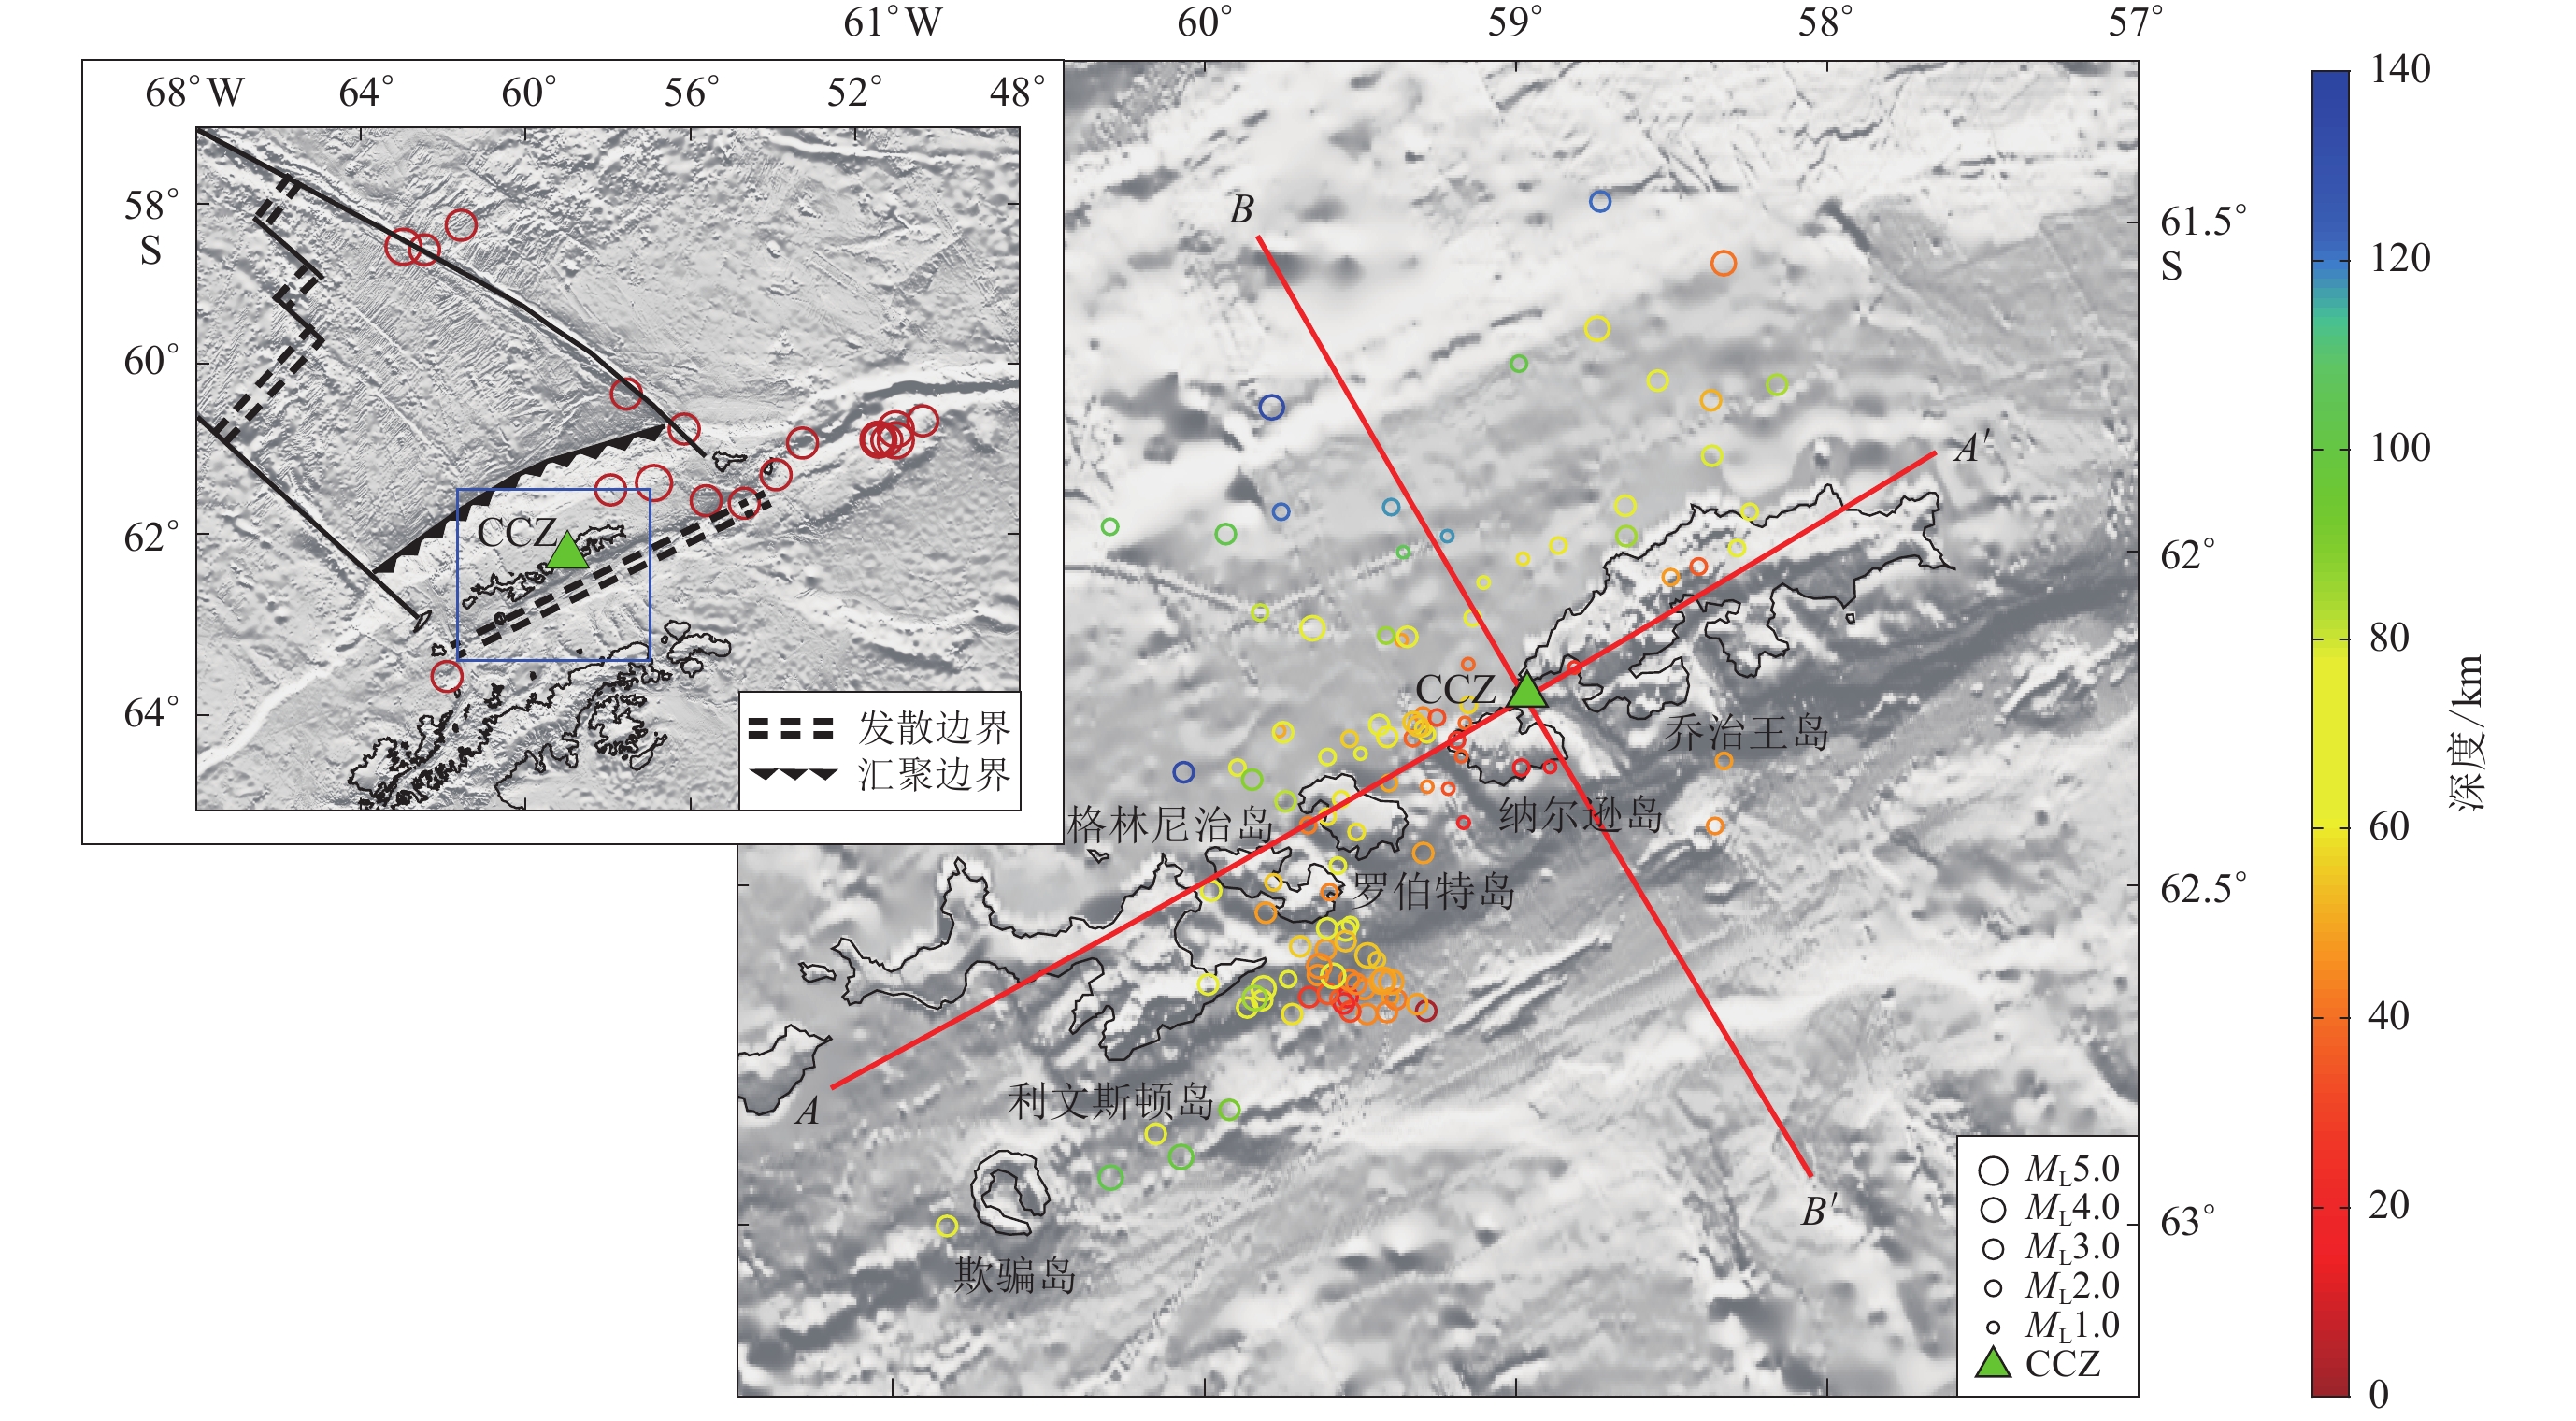
图 4 长城站地区2015—2017年地震分布情况
左上角插图给出了2015—2017年ANSS目录中在CCZ台500 km范围内的地震分布,蓝色方框为主图区域
Figure 4. Earthquake distribution in the Great Wall Station area from 2015 to 2017
The insert at the upper left corner shows the distribution of earthquakes within 500 km from the Great Wall Seismic Station in the ANSS catalog from 2015 to 2017. The blue rectangle is the area of the main figure
![]()
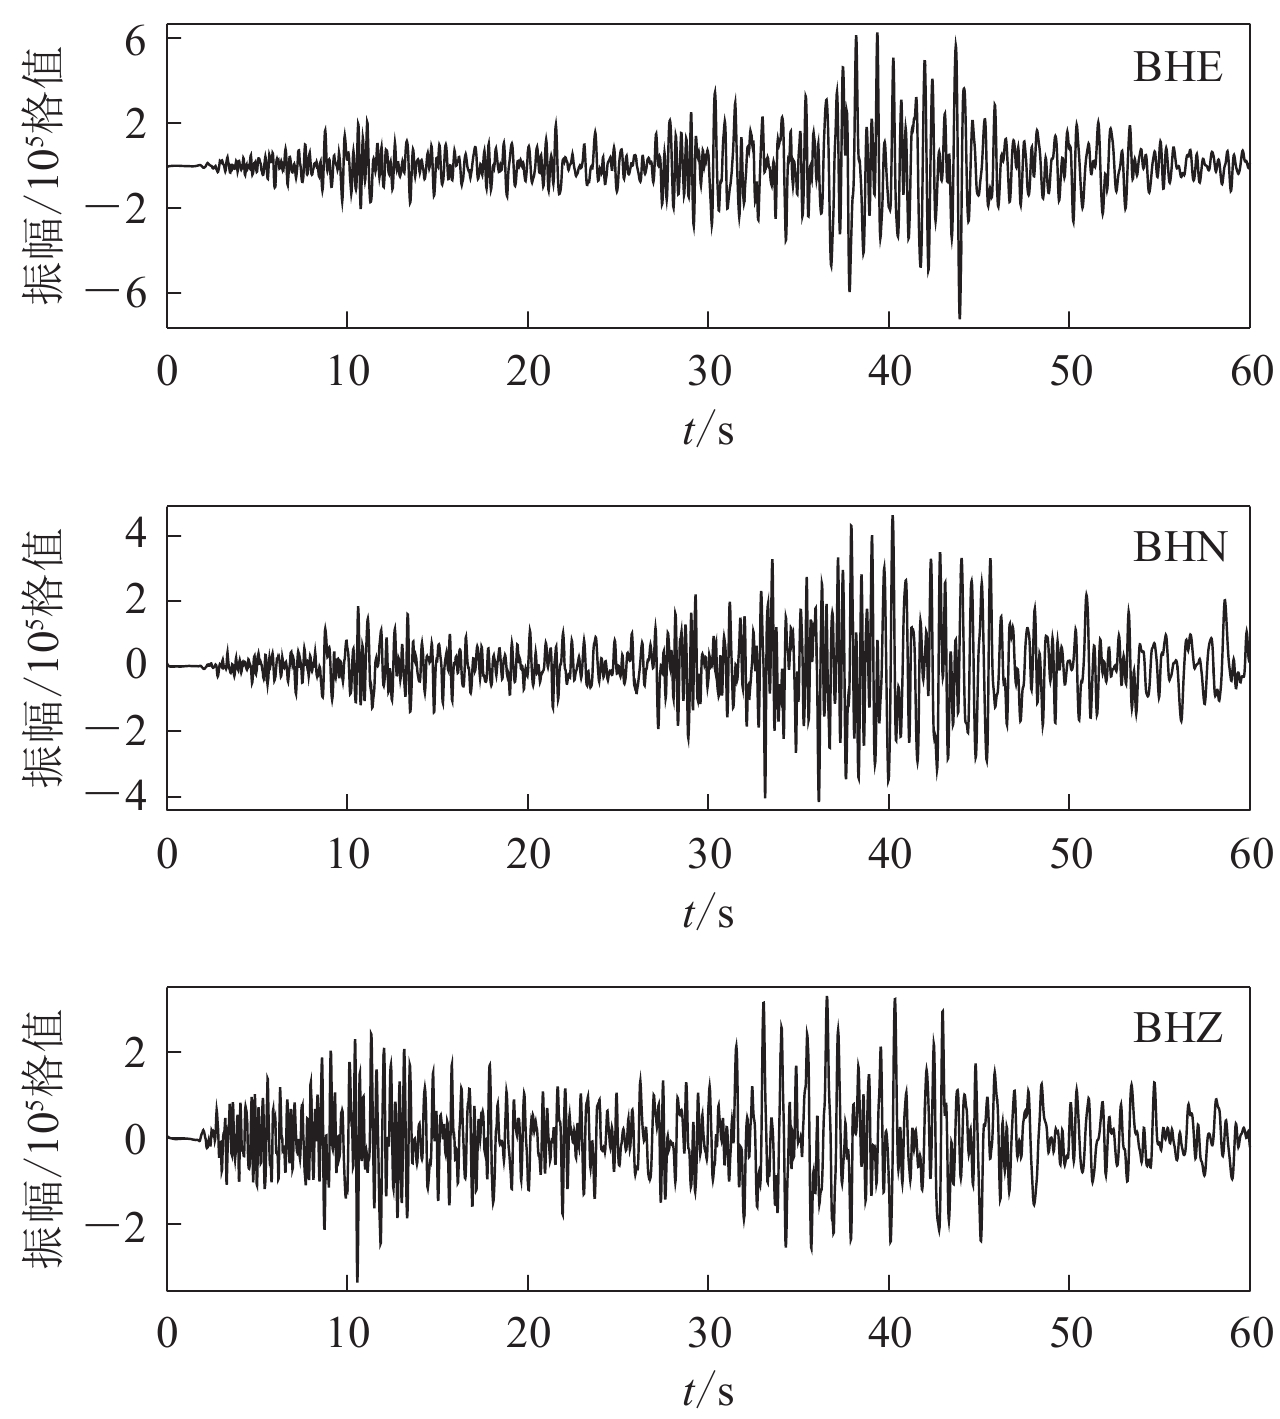
图 5 ANSS目录中2016−05−30 15:35:09.08发生的地震在CCZ台的记录
Figure 5. CCZ waveform record,which is in the ANSS catalog at 15:35:09.08 on May 30,2016
![]()
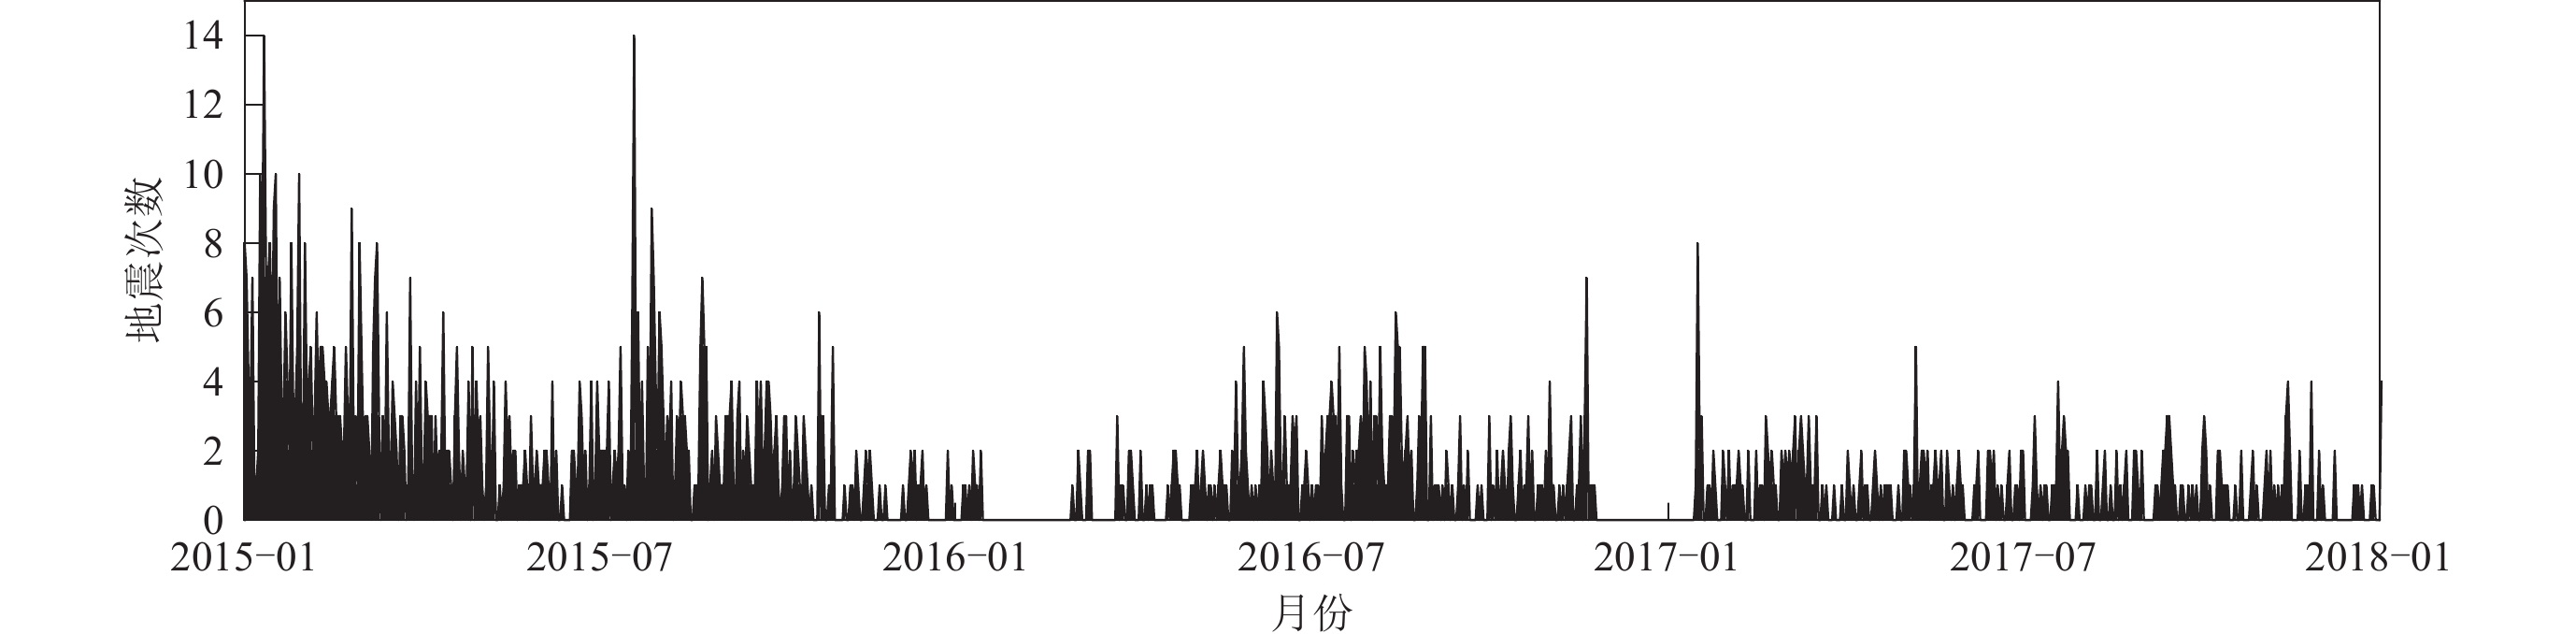
图 6 2015—2017年长城站地区地震频次
Figure 6. Earthquake frequency in the Great Wall Station area during 2015−2017
![]()
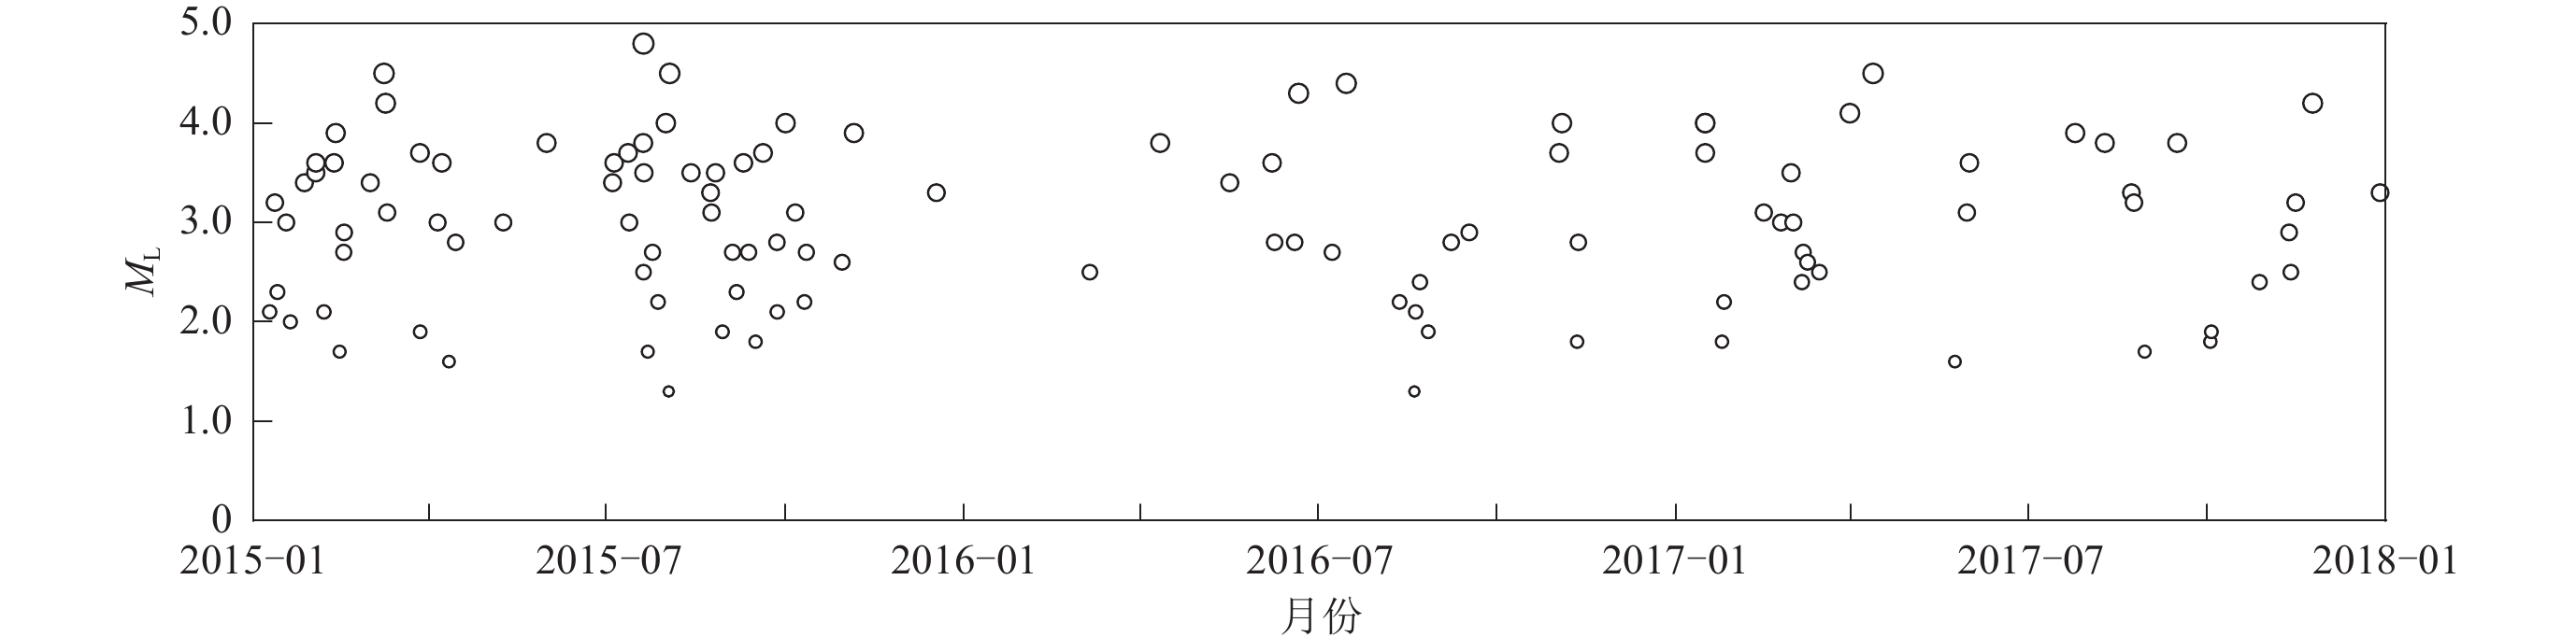
图 7 2015—2017年长城站地区可定位地震震级随时间变化的情况
Figure 7. The change of locatable earthquake magnitude with time in the Great Wall Station area during 2015−2017
![]()
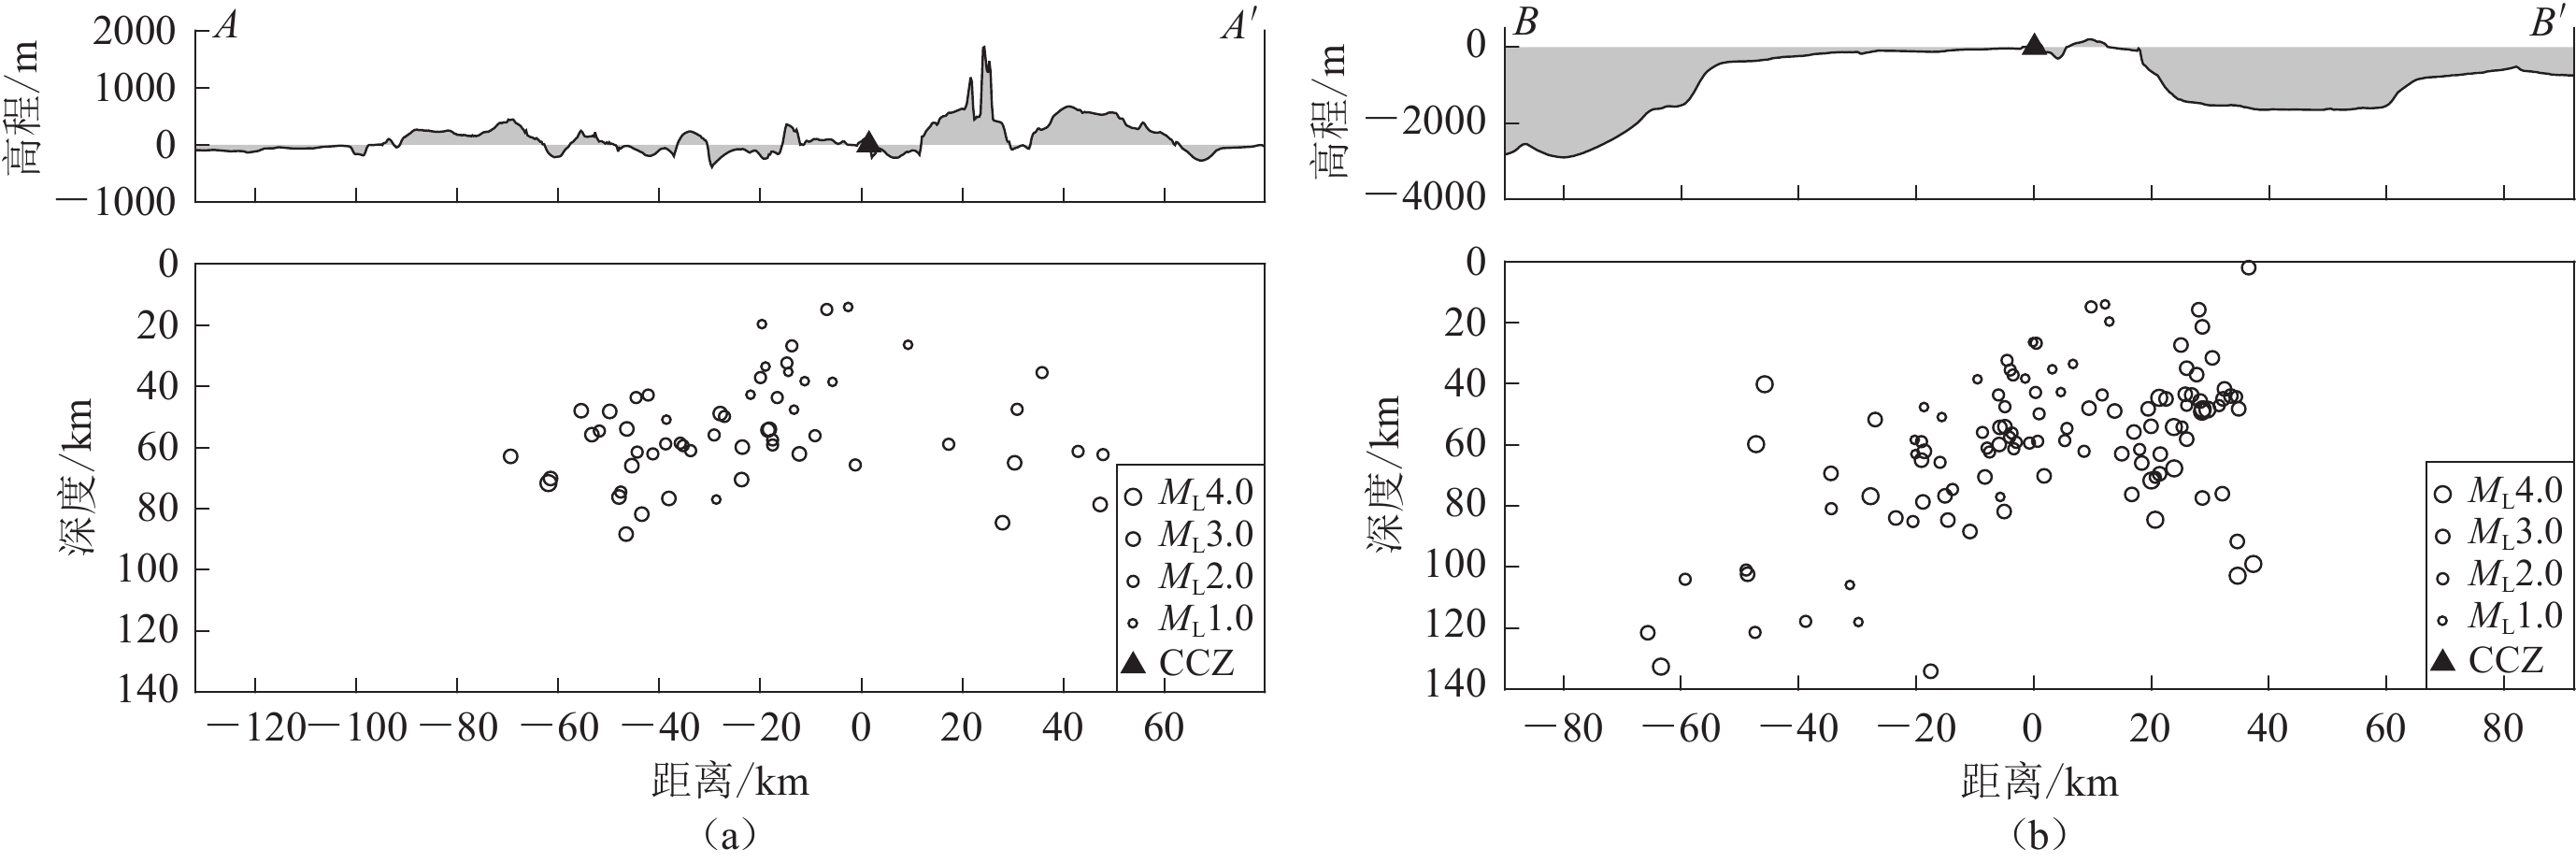
图 8 测线AA′ (a)和BB′ (b)的震源深度分布剖面图
图a,b上部为AA′和BB’测线纵截面测线位置的地形高程变化,剖面上投影了AA′测线南北20 km范围内地震和BB′测线所有可定位地震,横轴表示地震到测线的垂线与CCZ台的距离,以台站为原点,向西(北)为负,向东(南)为正
Figure 8. Focal depths distribution along profile of survey lines AA′ (a) and BB′ (b)
The upper part of the figure is the topographic elevation change along the longitudinal section of the survey lines. The earthquakes within 20 km from the north to the south of AA′ survey line and all locatable earthquakes of BB′ survey line are projected on the profile. The horizontal axis represents the distance between the vertical line of the earthquake to the survey line and the CCZ Station,with the station as the origin,negative to the west (north) and positive to the east (south)
表 1 中国南极长城站地区速度模型
Table 1 The velocity model of the Chinese Antarctic Great Wall Station area
深度/km vP/(km·s−1) vS/(km·s−1) 0 4.10 2.20 2 5.70 3.10 9 6.65 3.59 20 7.28 3.94 30 8.05 4.43 50 8.30 4.52  下载: 导出CSV
表 2 ANSS目录震级和本方法计算结果的对比
Table 2 The magnitude comparison of ANSS catalog and calculation result of this method
发震时刻(UTC) 南纬/° 西经/° 深度/km Mb ML (本文震级) 年−月−日 时:分:秒 2 016−05−30 15:35:09.080 61.65 54.70 10.0 4.6 4.9 2 016−07−02 20:02:00.060 61.35 53.93 10.0 4.6 4.9 2 016−07−16 17:30:40.090 60.36 57.56 16.5 4.3 4.7 2 016−10−17 00:13:56.420 63.29 61.91 10.0 4.9 4.9
下载: 导出CSV
表 3 2015—2017年CCZ台单台定位结果
Table 3 Single station location results of CCZ Station during 2015−2017
发震时刻(UTC) 南纬/° 西经/° 深度/km ML 震中距标准差/km 深度标准差/km 年−月−日 时:分:秒 2 015−01−09 02:52:57.142 62.32 58.33 47.0 2.1 0.6 0.8 2 015−01−11 18:55:35.171 62.65 59.49 46.6 3.2 0.3 0.5 2 015−01−13 02:26:02.496 62.41 58.36 44.3 2.3 0.4 0.6 2 015−01−17 15:08:20.536 62.69 59.48 44.9 3.0 0.4 0.5 2 015−01−19 18:21:52.508 62.25 59.30 43.6 2.0 1.0 0.3 2 015−01−26 23:24:17.910 62.67 59.56 36.9 3.4 0.3 0.6 2 015−02−01 19:15:40.762 62.69 59.29 2.1 3.5 0.9 1.4 2 015−02−01 21:56:40.560 62.67 59.54 15.7 3.6 0.4 2.2 2 015−02−06 00:16:49.919 62.33 58.98 14.8 2.1 2.4 1.1 2 015−02−22 05:07:40.639 62.33 59.64 45.0 3.6 0.3 0.5 2 015−02−12 01:23:56.584 62.67 59.66 27.3 3.9 0.3 1.4 2 015−02−14 01:52:26.810 62.35 59.29 42.7 1.7 0.7 0.4 2 015−02−16 04:36:05.947 62.61 59.45 54.1 2.7 0.4 0.5 2 015−02−16 09:37:06.332 62.67 59.40 47.1 2.9 0.4 0.5 2 015−03−01 19:38:22.289 62.26 59.44 70.4 3.4 0.8 0.3 2 015−03−08 21:29:07.408 62.64 59.40 48.4 4.5 0.4 0.5 2 015−03−09 17:03:42.891 62.64 59.42 49.1 4.2 0.4 0.5 2 015−03−10 12:17:11.868 62.69 59.53 31.5 3.1 0.3 1.1 2 015−03−27 08:49:32.449 62.67 59.38 41.6 3.7 0.4 0.5 2 015−03−27 11:50:30.010 62.30 59.50 77.1 1.9 0.6 0.3 2 015−04−05 10:38:31.014 62.60 59.61 48.1 3.0 0.4 0.5 2 015−04−07 15:01:46.761 62.69 59.41 43.9 3.6 0.4 0.6 2 015−04−11 07:13:53.799 62.05 59.10 62.9 1.6 0.8 0.3 2 015−04−14 17:24:41.493 62.35 59.41 49.9 2.8 0.6 0.3 2 015−05−09 05:12:09.465 62.45 59.30 48.9 3.0 1.0 0.8 2 015−05−31 11:24:33.141 62.68 59.55 21.4 3.8 0.4 1.5 2 015−07−04 09:14:21.220 62.87 60.16 75.9 3.4 0.3 0.5 2 015−07−05 04:30:40.211 62.83 59.92 91.6 3.6 0.4 0.5 2 015−07−12 08:00:12.972 62.33 60.07 134.1 3.7 0.6 0.3 2 015−07−12 23:11:11.567 62.51 59.98 70.2 3.0 0.4 0.6 2 015−07−20 03:05:51.509 62.64 59.54 43.4 3.8 0.4 0.5 2 015−07−20 05:59:45.273 62.64 59.43 48.4 4.8 0.4 0.5 2 015−07−20 07:04:04.974 62.04 58.50 47.6 2.5 0.9 0.6 2 015−07−20 11:23:14.377 62.68 59.32 48.1 3.5 0.4 0.5 2 015−07−22 11:32:19.363 62.00 59.36 105.8 1.7 0.6 0.3 2 015−07−24 22:09:27.906 62.42 59.51 58.6 2.7 0.6 0.4 2 015−07−27 18:10:25.901 62.28 59.19 26.7 2.2 0.9 0.4 2 015−07−31 18:27:09.665 62.90 60.08 98.9 4.0 0.4 0.5 2 015−08−02 05:54:17.571 61.98 59.22 117.9 1.3 0.7 0.3 2 015−08−02 17:53:21.228 62.12 59.65 76.8 4.5 0.5 0.3 2 015−08−13 17 07:03.185 61.74 58.54 69.3 3.5 0.4 0.5 2 015−08−23 18:01:25.544 62.65 59.51 43.6 3.3 0.4 0.5 2 015−08−24 05:33:26.643 62.66 59.60 34.9 3.1 0.3 0.8 2 015−08−26 07:21:16.635 61.47 58.73 121.4 3.5 0.9 0.6 2 015−08−29 21:02:32.865 62.01 58.98 58.3 1.9 2.0 0.3 2 015−09−04 01:00:05.695 61.72 58.99 100.9 2.7 0.6 0.4 2 015−09−06 03:22:49.571 62.28 59.33 37.1 2.3 0.7 0.3 2 015−09−09 15:43:45.491 61.86 58.37 78.6 3.6 0.5 0.3 2 015−09−12 08:08:14.483 62.28 59.29 59.2 2.7 0.8 0.3 2 015−09−15 21:15:24.730 62.32 58.89 14.0 1.8 1.0 0.7 2 015−09−19 17:37:15.264 62.59 59.69 55.8 3.7 0.3 0.5 2 015−09−26 21:19:39.555 61.99 58.86 59.0 2.8 0.7 0.3 2 015−09−27 00:13:48.033 62.13 59.42 85.1 2.1 0.7 0.3 2 015−10−01 07:15:24.196 62.63 59.59 67.7 4.0 0.4 0.6 2 015−10−06 07:04:50.301 61.75 58.16 83.8 3.1 0.6 0.8 2 015−10−11 00:24:17.187 62.23 59.15 56.2 2.2 1.8 0.3 2 015−10−12 00:09:00.274 61.94 58.25 62.3 2.7 0.7 0.9 2 015−10−30 09:02:58.971 61.93 59.40 117.7 2.6 0.6 0.3 2 015−11−05 10:50:09.692 62.56 59.61 76.2 3.9 0.8 0.5 2 015−12−17 20:10:02.746 62.67 59.86 69.4 3.3 0.3 0.5 2 016−03−05 17:48:06.327 62.28 59.53 55.9 2.5 0.6 0.3 2 016−04−10 21:07:44.857 62.57 59.55 65.9 3.8 0.4 0.5 2 016−05−16 15:46:42.359 62.28 59.41 59.9 3.4 0.7 0.3 2 016−06−07 09:39:09.115 61.77 58.37 51.6 3.6 0.3 0.5 2 016−06−08 16:44:36.534 62.09 59.82 80.8 2.8 0.6 0.4 2 016−06−19 00:34:16.557 62.47 59.57 62.1 2.8 0.4 0.3 2 016−06−21 00:53:16.317 62.65 59.81 71.7 4.3 0.5 0.6 2 016−07−08 06:59:53.855 62.56 59.53 61.6 2.7 0.4 0.4 2 016−07−15 12:52:28.546 62.56 58.33 40.1 4.4 0.3 0.8 2 016−08−11 22:37:06.427 62.27 59.30 57.6 2.2 0.9 0.3 2 016−08−19 13:08:28.771 62.41 59.17 19.6 1.3 0.6 0.6 2 016−08−20 04:48:49.164 62.31 59.61 61.1 2.1 0.6 0.4 2 016−08−22 10:08:51.241 62.00 58.29 61.3 2.4 0.4 0.3 2 016−08−26 16:11:27.861 62.27 59.76 50.9 1.9 0.5 0.5 2 016−09−07 11:30:14.309 61.94 59.75 121.3 2.8 0.6 0.3 2 016−09−16 18:31:24.635 62.51 59.60 43.6 2.9 0.4 0.5 2 016−11−01 23:20:23.770 62.34 59.85 88.4 3.7 0.6 0.4 2 016−11−03 09:46:21.038 62.67 59.84 84.5 4.0 0.3 0.4 2 016−11−11 04:42:38.088 62.36 59.22 33.5 1.8 0.8 0.4 2 016−11−11 20:06:48.364 62.40 59.61 58.8 2.8 0.5 0.3 2 017−01−16 00:38:56.890 62.60 59.48 54.1 4.0 0.4 0.5 2 017−01−16 01:18:34.637 62.62 59.63 44.6 4.0 0.4 0.6 2 017−01−16 01:19:41.900 62.58 59.55 53.9 3.7 0.4 0.5 2 017−01−24 16:03:04.799 62.13 59.37 47.6 1.8 0.8 0.3 2 017−01−25 17:45:15.526 62.25 59.25 32.4 2.2 1.0 0.3 2 017−02−15 04:07:15.207 62.13 59.35 62.1 3.1 0.7 0.3 2 017−02−24 00:32:35.366 61.93 58.65 64.9 3.0 0.6 0.4 2 017−03−01 04:29:05.009 62.54 59.80 47.9 3.5 0.4 0.5 2 017−03−02 08:12:21.446 61.97 59.93 102.3 3.0 0.5 0.3 2 017−03−06 17:54:49.262 62.02 58.41 35.4 2.4 0.4 0.5 2 017−03−07 10:27:33.329 62.33 59.89 74.6 2.7 0.5 0.3 2 017−03−09 16:07:42.708 62.64 59.73 70.6 2.6 0.5 0.6 2 017−03−15 17:59:53.782 62.41 59.67 42.9 2.5 0.4 0.5 2 017−03−31 10:05:30.533 61.78 59.78 132.6 4.1 0.5 0.3 2 017−04−12 08:25:59.180 61.66 58.74 59.7 4.5 0.4 0.5 2 017−05−24 09:54:32.085 62.18 58.81 26.4 1.6 1.5 0.3 2 017−05−30 13:34:00.388 62.27 59.75 76.7 3.1 0.5 0.3 2 017−05−31 20:40:08.639 61.98 58.65 84.6 3.6 0.6 0.3 2 017−07−25 05:34:31.746 62.67 59.82 63.0 3.9 0.3 0.5 2 017−08−09 11:22:15.439 63.00 60.83 77.4 3.8 0.4 0.5 2 017−08−23 03:36:11.790 62.38 59.74 81.8 3.3 0.5 0.3 2 017−08−24 10:41:36.910 62.69 59.72 58.1 3.2 0.3 0.5 2 017−08−29 22:47:54.601 62.31 59.18 35.3 1.7 1.3 0.3 2 017−09−15 16:14:20.470 62.65 59.99 62.9 3.8 0.4 0.5 2 017−10−02 17:14:29.735 62.26 59.16 38.2 1.8 1.0 0.3 2 017−10−03 05:40:27.856 62.17 59.15 38.5 1.9 1.1 0.3 2 017−10−28 00:51:54.113 62.37 59.56 59.3 2.4 0.7 0.4 2 017−11−12 04:58:43.418 62.10 59.14 65.7 2.9 0.9 0.3 2 017−11−13 02:23:55.693 61.96 60.30 103.8 2.5 0.6 0.4 2 017−11−15 13:24:29.718 62.26 59.33 54.3 3.2 0.8 0.3 2 017−11−24 07:37:47.287 62.93 60.30 102.8 4.2 0.4 0.6 2 017−12−28 23:20:23.074 62.26 59.32 53.9 3.3 0.9 0.3
下载: 导出CSV
-
彼得·鲍曼. 2002. 新地震观测实践手册[M]. 中国地震局监测预报司,译. 北京:地震出版社:584−585. Borman P. 2002. New Manual of Seismological Observatory Practice[M]. Monitoring and Forecasting Department of China Earthquake Administration,trans. Beijing:Seismological Press:584−585 (in Chinese).
常利军,丁志峰,孙为国. 2012. 第27次南极科学考察度夏期间长城站地震观测[J]. 极地研究,24(1):95–100. Chang L J,Ding Z F,Sun W G. 2012. Seismological observation at the Great Wall Station during the 27th Chinese Antarctic expedition in the summer[J]. Chinese Journal of Polar Research,24(1):95–100 (in Chinese).
常利军. 2013. 我国近期南极地震科考进展[J]. 科学,65(2):17–20. Chang L J. 2013. Advances in Chinese Antarctic earthquake expedition[J]. Science,65(2):17–20 (in Chinese).
陈圣源,刘方兰,梁东红. 1997. 南极布兰斯菲尔德海域地球物理场与地质构造[J]. 海洋地质与第四纪地质,17(1):77–86. Chen S Y,Liu F L,Liang D H. 1997. Geophysical field and geologic structure of the Bransfield sea area in the Antarctic circle[J]. Marine Geology &Quaternary Geology,17(1):77–86 (in Chinese).
何高文,付少英,邓希光,赵庆献,王力峰,王海峰,关晓春,刘胜旋,庞云天,陈玺,柴祎,罗贤虎,朱本铎,朱振华,李强,苏丕波,何赵,吴聪,黄宁,何发光,蓝明华. 2018. 南极南设得兰群岛海域地质新进展:“海洋六号”南极科考初步成果[J]. 地球学报,39(6):643–656. He G W,Fu S Y,Deng X G,Zhao Q X,Wang L F,Wang H F,Guan X C,Liu S X,Pang Y T,Chen X,Chai Y,Luo X H,Zhu B D,Zhu Z H,Li Q,Su P B,He Z,Wu C,Huang N,He F G,Lan M H. 2018. New geological progress in offshore area of South Shetland Islands,Antarctic:Preliminary results of R/V “Hai Yang Liu Hao” expedition[J]. Acta Geoscientica Sinica,39(6):643–656 (in Chinese).
林云芳,贾国强. 1989. 中国南极长城地震台与地磁台的建立[J]. 地震学报,11(2):213–219. Lin Y F,Jia G Q. 1989. Establishment of China’s Antarctic seismological and geomagnetic observatories[J]. Acta Seismologica Sinica,11(2):213–219 (in Chinese).
刘瑞丰,陈翔,沈道康,郑秀芬,杨辉,陈宏峰. 2014. 宽频带数字地震记录震相分析[M]. 北京:地震出版社:51−59. Liu R F,Chen X,Shen D K,Zheng X F,Yang H,Chen H F. 2014. Seismic Phase Analysis of Broadband Digital Seismic Records[M]. Beijing:Seismological Press:51−59 (in Chinese).
刘小汉,郑祥身,鄂莫岚. 1991. 南极洲大地构造区划和冈瓦纳运动[J]. 南极研究,3(2):1–9. Liu X H,Zheng X S,E M L. 1991. Review on the geotectonic division and Gondwana movement,Antarctica[J]. Antarctic Research,3(2):1–9 (in Chinese).
吕文正,吴水根. 1989. 布兰斯菲尔德海槽:新生代裂谷[J]. 南极研究,1(4):28–35. Lü W Z,Wu S G. 1989. The Bransfield trough:A Cenozoic rift[J]. Antarctic Research,1(4):28–35 (in Chinese).
马龙,邢健. 2020. 南极布兰斯菲尔德海峡及邻区地壳结构反演及构造解析[J]. 海洋与湖沼,51(2):265–273. Ma L,Xing J. 2020. Structure inversion and its tectonic interpretation in Bransfield Strait and the adjacent area,Antarctic[J]. Oceanologia et Limnologia Sinica,51(2):265–273 (in Chinese).
万永革. 2016. 地震学导论[M]. 北京:科学出版社:316−318. Wan Y G. 2016. Introduction to Seismology[M]. Beijing:Science Press:316−318 (in Chinese).
王公念,陶军,吴宣志. 1997. 南极布兰斯菲尔德海峡海磁异常和深部地质[J]. 极地研究,9(2):145–151. Wang G N,Tao J,Wu X Z. 1997. Marine magnetic anomalies and deep geology of the Bransfield Strait,Antarctica[J]. Chinese Journal of Polar Research,9(2):145–151 (in Chinese).
王改云,邓希光,刘金萍,杜民. 2013. 西南极南设得兰群岛中新生代地层特征[J]. 极地研究,25(2):161–166. Wang G Y,Deng X G,Liu J P,Du M. 2013. Stratigraphic characteristics of the Mesozoic-Cenozoic in the South Shetland Islands,Antarctica[J]. Chinese Journal of Polar Research,25(2):161–166 (in Chinese).
吴水根,吕文正. 1988. 德雷克海峡的扩张历史及其影响[J]. 南极研究,1(2):1–7. Wu S G,Lü W Z. 1988. The history of spreading of Darke Passage and its effects[J]. Antarctic Research,1(2):1–7 (in Chinese).
姚伯初,王光宇,陈邦彦,陈圣源. 1995. 南极布兰斯菲尔德海峡的地球物理场特征与构造发育史[J]. 南极研究(中文版),7(1):25–35. Yao B C,Wang G Y,Chen B Y,Chen S Y. 1995. The characteristics of geophysical field and tectonical evolution in the Bransfield Strait[J]. Antarctic Research (Chinese Edition),7(1):25–35 (in Chinese).
Almendros J,Carmona E,Jiménez V,Díaz-Moreno A,Lorenzo F. 2018. Volcano-tectonic activity at deception island volcano following a seismic swarm in the Bransfield Rift (2014−2015)[J]. Geophys Res Lett,45(10):4788–4798.
Almendros J,Wilcock W,Soule D,Teixidó T,Vizcaíno L,Ardanaz O,Granja-Bruña J L,Martín-Jiménez D,Yuan X,Heit B,Schmidt-Aursch M C,Geissler W,Dziak R,Carrión F,Ontiveros A,Abella R,Carmona E,Agüí-Fernández J F,Sánchez N,Serrano I,Davoli R,Krauss Z,Kidiwela M,Schmahl L. 2020. BRAVOSEIS:Geophysical investigation of rifting and volcanism in the Bransfield Strait,Antarctica[J]. J South Am Earth Sci,104:102834.
An M J,Wiens D A,Zhao Y,Feng M,Nyblade A,Kanao M,Li Y S,Maggi A,Lévêque J J. 2015. Temperature,lithosphere-asthenosphere boundary,and heat flux beneath the Antarctic Plate inferred from seismic velocities[J]. J Geophys Res:Solid Earth,120(12):8720–8742.
Barker P F. 1982. The Cenozoic subduction history of the Pacific margin of the Antarctic Peninsula:Ridge crest-trench interactions[J]. J Geol Soc,139(6):787–801.
Craddock C. 1982. Antarctic Geoscience[M]. Madison:University of Wisconsin Press:3−14.
Dziak R P,Park M,Lee W S,Matsumoto H,Bohnenstiehl D R,Haxel J H. 2010. Tectonomagmatic activity and ice dynamics in the Bransfield Strait back-arc basin,Antarctica[J]. J Geophys Res:Solid Earth,115(B1):B01102.
Erik L,Ekström G,Nettles M. 2013. Global CMT Catalog Search[DB/OL]. [2023−05−15]. https://www.globalcmt.org/CMTsearch.html.
González-Casado J M,Robles J L G,López-Martínez J. 2000. Bransfield Basin,Antarctic Peninsula:Not a normal backarc basin[J]. Geology,28(11):1043–1046.
González-Ferrán O. 1983. The Larsen Rift:An active extension fracture in West Antarctica[M]//Antarctic Earth Science. Cambridge:Cambridge University Press:344−346.
Institute for Geophysics,University of Texas. 2015. Institute for Geophysics[DB/OL]. [2023−05−15]. https://www-udc.ig.utexas.edu/external/plates/data.htm.
Janik T,Środa P,Grad M,Guterch A. 2006. Moho depth along the Antarctic Peninsula and crustal structure across the landward projection of the Hero Fracture Zone[M]//Antarctica:Contributions to Global Earth Sciences. Berlin,Heidelberg:Springer-Verlag:229−236.
Jiménez-Morales V,Almendros J,Carmona E. 2022. Long-Term evolution of the seismic activity preceding the 2015 seismic crisis at Deception Island Volcano,Antarctica (2008−2015)[J]. Surv Geophys,43(3):959–994.
Kaminuma K. 1995. Seismicity around the Antarctic Peninsula[C]//Proceedings of the NIPR Symposium on Antarctic Geosciences. Tokyo:National Institute of Polar Research:35−42.
Kaminuma K. 2006. Seismicity in the Antarctic and surrounding ocean[J]. J Ind Geophys Union,10(1):15–24.
Lawver L A,Sloan B J,Barker D H N,Ghidella M,von Herzen R P,Keller R A,Klinkhammer G P,Chin C S. 1996. Distributed,active extension in Bransfield Basin,Antarctic Peninsula:Evidence from multibeam bathymetry[J]. GSA Today,6(11):1–6.
Li W,Yuan X H,Heit B,Schmidt-Aursch M C,Almendros J,Geissler W H,Chen Y. 2021. Back-arc extension of the Central Bransfield Basin induced by ridge–trench collision:Implications from ambient noise tomography and stress field inversion[J]. Geophys Res Lett,48(21):e2021GL095032.
Olivet J L,Bettucci L S,Castro-Artola O A,Castro H,Rodríguez M,Latorres E. 2021. A seismic swarm at the Bransfield Rift,Antarctica[J]. J South Am Earth Sci,111:103412.
Parera-Portell J A,de Lis Mancilla F,Morales J,Almendros J,Jiménez-Morales V. 2021. Structure of the crust and upper mantle beneath the Bransfield Strait (Antarctica) using P receiver functions[J]. Tectonophysics,802:228744.
Pelayo A M,Wiens D A. 1989. Seismotectonics and relative plate motions in the Scotia Sea region[J]. J Geophys Res:Solid Earth,94(B6):7293–7320.
Poli P,Cabrera L,Flores M C,Báez J C,Ammirati J B,Vásquez J,Ruiz S. 2022. Volcanic origin of a long-lived swarm in the Central Bransfield Basin,Antarctica[J]. Geophys Res Lett,49(1):e2021GL095447.
USGS,Earthquake Hazards Program. 2017. Advanced National Seismic System (ANSS) Comprehensive Catalog of Earthquake Events and Products:Various[DB/OL].[2023−05−15]. https://doi.org/10.5066/F7MS3QZH.
Robertson Maurice S D,Wiens D A,Shore P J,Vcra E,DoRman L M. 2003. Seismicity and tectonics of the South Shetland Islands and Bransfield Strait from a regional broadband seismograph deployment[J]. J Geophys Res:Solid Earth,108(B10):2461.
-
期刊类型引用(8)
1. 邓月圆,谢斌,罗叶美,余志成,钟智东,赖智华,欧阳澍培,张义建. 少震地区公众防震减灾科普需求与认知的调查和分析——以江西省为例. 地震科学进展. 2025(01): 35-42 .  百度学术
百度学术
2. 冯然,周黎明,王晓玲. 滁州市数字化智慧防震减灾服务平台的建设. 地震科学进展. 2024(03): 203-209 . 百度学术
3. 翟颖,马秀丹,崔满丰. 地震信息公共服务需求调查分析. 地震地磁观测与研究. 2024(01): 165-173 . 百度学术
4. 张馨丹,冉小华. 新公共服务理论视阈下地级市科学普及公共服务现状研究——以南充市为例. 科技传播. 2024(08): 29-36 . 百度学术
5. 次仁巴宗. 西藏自治区防震减灾公共服务需求调查分析. 高原地震. 2024(04): 60-66 . 百度学术
6. 李玉梅,连尉平,朱林. 防震减灾公共服务公众需求和满意度调查指标体系构建及评估应用. 中国地震. 2024(04): 848-856 . 百度学术
7. 袁庆禄,孙瑞婷. 震灾保险素养水平对公共服务满意度的影响研究. 中国地震. 2023(02): 395-411 . 百度学术
8. 罗宾生,李延峰,白永祯,苏宁. 青海省民众防震减灾知识水平调查分析. 高原地震. 2023(03): 51-57 . 百度学术
其他类型引用(2)


计量
- 文章访问数: 207
- HTML全文浏览量: 63
- PDF下载量: 80
- 被引次数: 10
