

The spatio-temporal evolution characteristics of the MS6.0 Barkam earthquake sequence in Sichuan on June 10,2022
-
摘要:
2022年6月10日马尔康MS6.0震群序列发生在松岗断裂与龙日坝断裂交会处,呈震群型活动特征。本文以四川地震台网目录为基础,对马尔康地震序列的参数特征开展研究,取该序列三次MS5.0地震之后各一个小时,作为 Ⅰ , Ⅱ , Ⅲ 共计三个阶段,进行对比分析。由于较大地震后短时间内目录遗漏的余震较多,为增大研究所需的地震样本量,首先采用模板匹配法进行微小地震识别,以补充完备目录,并利用识别的地震目录及台网目录分别计算马尔康MS6.0地震序列的b值、p值等参数。计算结果显示,相比于第 Ⅱ 和 Ⅲ 阶段,第 Ⅰ 阶段具有显著的低b值(0.59),随着时间的推移,序列b值逐渐上升,后两个阶段分别为0.84和0.86。第 Ⅰ 阶段低b值的结果反映了此阶段孕震区应力水平较高。另外,第 Ⅰ 阶段序列的p值为0.76,明显低于后两个阶段的1.81和1.64,反映出第 Ⅰ 阶段序列频次衰减速度较慢,应力释放不充分,而后两个阶段刚好相反,表明不同阶段序列的时间演化特征存在差异。综合分析认为,MS5.8地震是MS6.0地震的前震。序列西支与东支的参数计算结果呈现不一样的特征,可能与MS5.8前震序列发生在西支有关。
-
关键词:
- 马尔康MS6.0震群 /
- 松岗断裂 /
- 序列参数 /
- 前震
Abstract:According to the China Earthquake Networks Center, at 00:03 on June 10, 2022, local time, an earthquake with MS5.8 (ML6.3) struck Barkam City (32.27°N, 101.82°E), Aba Prefecture, Sichuan Province, with a focal depth of 10 km. Subsequently, at 01:28 local time, another MS6.0 (ML6.5) earthquake occurred in the same location (32.25°N, 101.82°E), with a focal depth of 13 km. These two earthquakes were located in the southeast part of the Bayan Har block, approximately two kilometers apart. According to the definition of earthquake sequence type, the magnitude difference between the two earthquakes ΔM=0.2 constitutes a swarm type earthquake, which is hereinafter referred to as “MS6.0 Barkam earthquake swarm”. The MS6.0 Barkam earthquake swarm exhibited numerous minor earthquakes, up until 23:00 on June 30, 2022, a total of 4 821 earthquakes of magnitude 0 and above were recorded, including seven earthquakes with magnitude ranging from MS3.0 to MS3.9, three earthquakes with magnitude ranging from MS4.0 to MS4.9, two earthquakes with magnitude ranging from MS5.0 to MS5.9, and one MS6.0 earthquake. The largest aftershock recorded was an earthquake with MS5.2 (ML5.6) at 03:27 local time on June 10. Considering the significant event of an earthquake with MS5.8 preceding the occurrence of the main shock with MS6.0, it is important to investigate the characteristics of the MS5.8 earthquake sequence as a foreshock and the sequence features before and after the main shock. Existing seismological methods indicate that earthquake sequences can intuitively reflect differences in tectonic stress fields, seismic structures, and the seismogenic environment medium. Moreover, the rupturing properties of the main shock often influence the evolution of aftershock sequences. This study utilizes seismic data from the Sichuan regional seismic network, based on parameters such as the b-value and p-value of the sequence, in combination with regional structure and focal mechanism solution parameters of the strong aftershock, to investigate the spatio-temporal evolution characteristics of the Barkam MS6.0 earthquake swarm sequence and to explore the sequence evolution characteristics before major earthquakes in Barkam.
Regional geological settings and M≥5.0 historical earthquakes
The Barkam region is situated in the eastern part of the southeastern margin of the Bayan Har block within the Songpan-Garze orogenic belt. The Longriba fault in the studied area divides the eastern part of the Bayan Har block into two parts, including the secondary Longmenshan block on the east and the Aba secondary block on the west. The Longmenshan block primarily features the NE-trending Longmenshan fault zone, the nearly SN-trending Minjiang fault, and the Huya fault. On the other hand, the Aba secondary block, features a series of large-scale strike-slip faults trending NW that have exhibited activity in the Late Quaternary period. These faults, along with the Garze-Yushu fault, the Xianshuihe fault, and the east Kunlun fault at the southern and northern boundaries of the Bayan Har block, collectively constitute the tectonic framework of the Bayan Har block. The Barkam MS6.0 earthquake swarm occurred near the intersection of the NW-trending Songgang fault and the NE-trending Longriba fault within a relatively complex fault structure. The Songgang fault is approximately 100 kilometers in length, with a maximum width of about 300 meters, trending between 320° and 330°, dipping to the northeast with an angle of 50° to 70°. It extends from the northern slope of Mengbi Mountain on the south side of Barkam, along a NW direction, and disappears near Zoigê. This fault exhibits relatively complex activity, featuring characteristics of multiple periods of activity. Its southern segment is a Late Pleistocene active fault, and historical records indicate that it has experienced three MS≥5.0 earthquakes, with the largest MS6.0 earthquake occurred on October 8, 1941 in Heishui area. The northern segment of the fault does not exhibit obvious surface activity since the Late Pleistocene. Apart from the Maerkang MS6.0 earthquake swarm, no MS≥5.0 earthquake was shown in historical records. Minor earthquakes are relatively active in the central part of the fault, concentrated in deep-seated dense activity along the NW direction. This reflects the existence of a northwest-trending ruptured surface and suggests that the northern segment of the fault possesses potential seismic risk. The Longriba fault is considered to be resulted from the strong obstruction of the southeastern movement of the Bayan Har block from the South China block during the Late Cenozoic, and it constitutes the backthrust-overthrust tectonic system of the Longmenshan structural belt, bearing the role of crustal deformation on the eastern edge of the Qinghai-Xizang Plateau since the Late Cenozoic. This fault is a new fault primarily characterized by right-lateral strike-slip movement in the NE direction, consisting mainly of two parallel branch faults: the Longriba fault and the Maoergai fault. It exhibits a series of distinct fault landforms and demonstrates Late Quaternary activity. Historical records indicate that the Longriba fault has not experienced any MS≥5.0 earthquakes. The M≥5.0 earthquakes that occurred within a 50 km range from the epicenter were all earthquake swarms. There were a total of two swarms, which took place on September 26 and November 6, 1969, with MS5.1 and MS5.3 in Aba, and on September 5 and November 8, 1970, with MS5.5 and MS5.5 in Rangtang.
Basic situation of the sequence
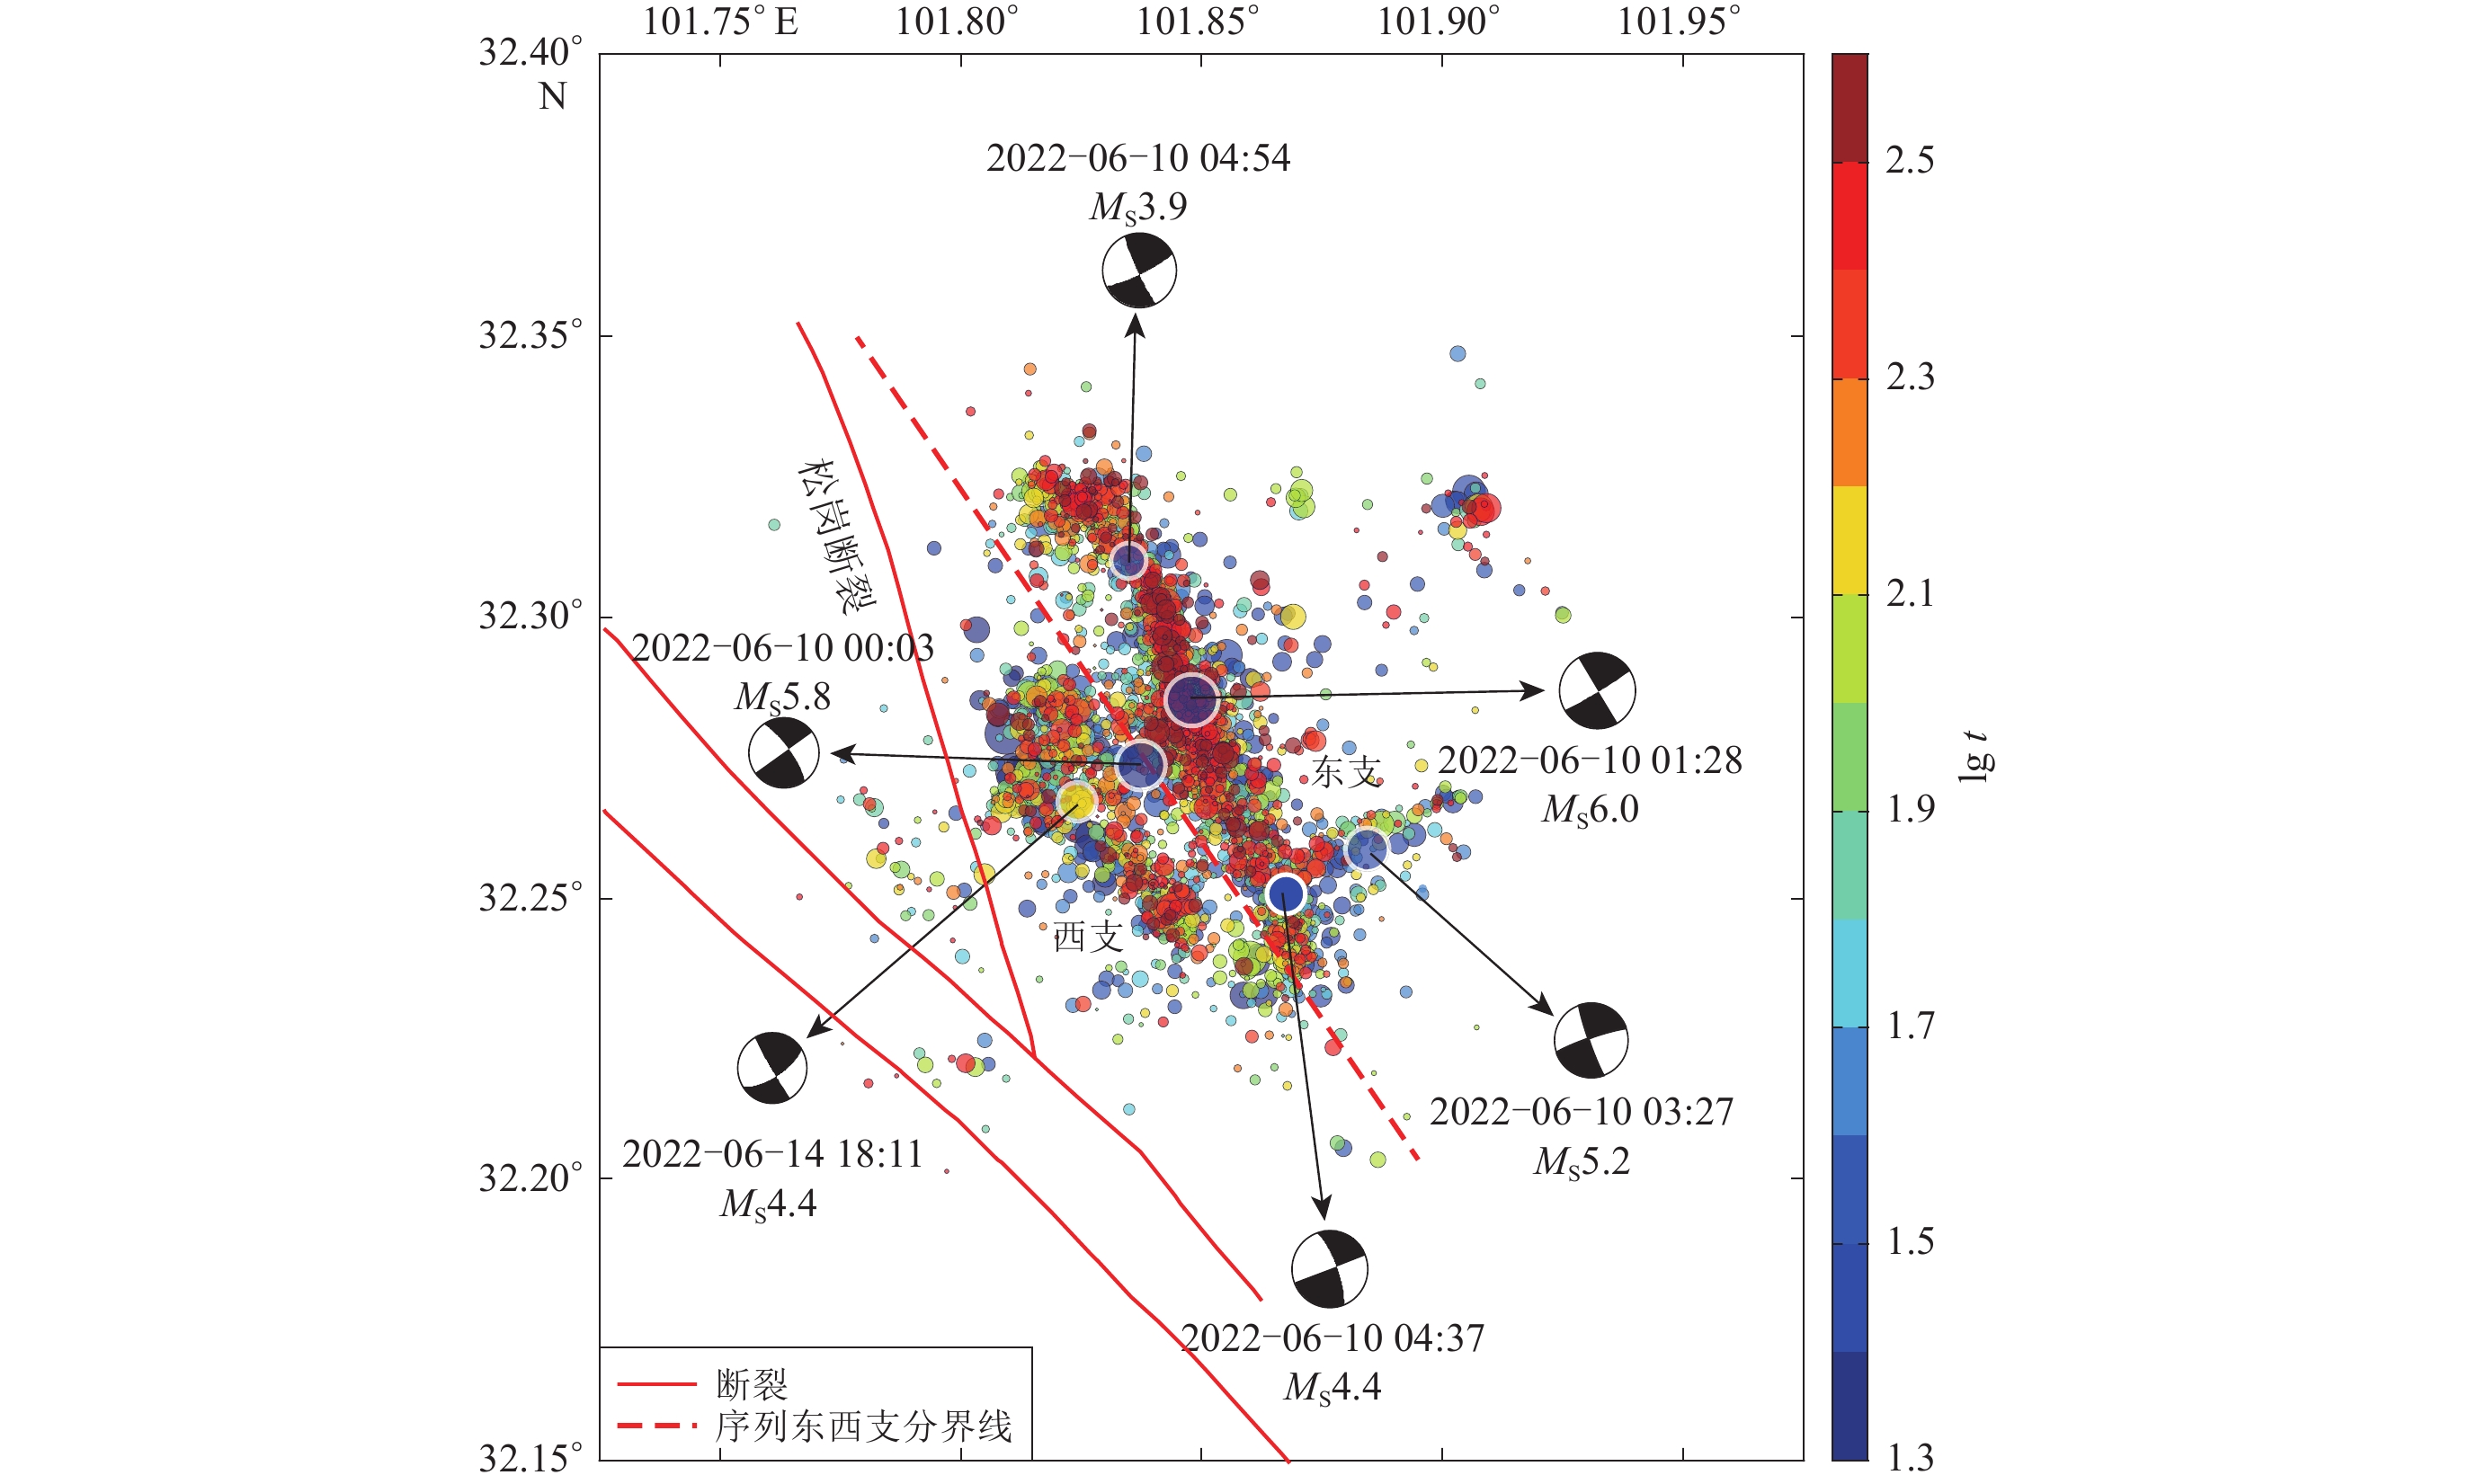
Using the multi-stage positioning method to locate the Barkam MS6.0 earthquake sequence. The results indicate that the sequence is situated to the northeastern side of the Songgang fault, with an overall parallel distribution along the NW-SE direction, forming two branches running in an east-west direction, parallel to the Songgang fault. The western branch spans approximately 12 km in length and 3 km in width, while the eastern branch extends about 15 km in length and 2 km in width, with a separation of roughly 2 km between the two. The sequence experienced a total of three MS≥5.0 earthquakes, with the MS5.8 earthquake occurred closer to the eastern side of the western branch, the MS6.0 earthquake located within the eastern branch, and the largest aftershock of MS5.2 situated to the east of the eastern branch. Prior to the MS6.0 earthquake, seismicity was primarily distributed along the western branch, while after the MS6.0 earthquake, the activity shifted to the eastern branch, indicating the spatial migration over time. Additionally, the distribution of seismicity is more scattered in the western branch and more concentrated in the eastern branch, suggesting potential differences in the seismicity patterns between the two branches and indicating that the sequence does not occur on a single fault structure, but rather on different branch faults.
Using the CAP (cut and paste) method to calculate the focal mechanism solutions of the MS5.8, MS6.0, and some MS≥3.5 earthquakes of the sequence. The results revealed that the MS5.8 earthquake had best double-couple solutions with strike 324°, dip 76°, and slip 0° for nodal plane I, while strike 234°, dip 90°, and slip 166° for nodal plane Ⅱ . The MS6.0 earthquake had best double-couple solutions with strike 329°, dip 90°, and slip −3° for nodal plane I, and strike 58°, dip 87°, and slip −180° for nodal plane Ⅱ . Both main shocks and the focal mechanisms of the larger aftershocks exhibited consistent strike-slip motion, which is consistent with the regional predominance of reverse and strike-slip faulting. The strike of nodal plane I in the NW direction is consistent with the strike of the Songgang fault near the epicenter. Furthermore, the focal mechanism solutions for some MS≥3.5 events of the Barkam MS6.0 earthquake sequence indicated a concentrated depth distribution ranging from 5 to 8 km (Table 1). Combining the results of precise positioning and the study of the sequence’s seismogenic structure by Long et al (2023), it is suggested that the seismogenic structure of the Barkam MS6.0 earthquake swarm is complex, which is resulted from the simultaneous activity of several faults of different scales. These faults are located close to the Songgang fault, not exposed at the surface, and may be connected to the Songgang fault at depth, indicating that the seismogenic structure may be a concealed branch fault of the Songgang fault. It is noteworthy that there are traces of a NE-oriented distribution within the sequence, implying that the seismicity in this area may exhibit conjugate rupture characteristics.
Early sequence parameter evolution characteristics
The early temporal evolution of the sequence encapsulates the processes of nucleation and stress changes. The analysis of the temporal evolution characteristics is helpful to understand the mechanism and development of the sequence. In commonly used statistical seismological models, the regression parameter b value in the Gutenberg-Richter (G-R) relationship and the p value in the modified Omori’s law carry specific physical properties and are widely considered as statistical quantities characterizing the sequence. The G-R relationship is expressed as lgN=a-bM, where b value represents the maximum likelihood solution $ {b}={\mathrm{lg}\mathrm{e}}/ ( {\overline{M}-{M}_{\mathrm{C}}} ) $, a value represents the overall level of seismic activity, N represents seismic frequency, MC represents the minimum completeness magnitude, $ \overline{M} $ represents the average magnitude, and lge=0.4343. The rock fracture experiments indicate that the b value decreases with the increase of stress level. A smaller b value reflects higher regional stress levels, while a larger b value indicates lower stress levels. So the b value, as a means of assessing regional stress accumulation levels, has been widely used in seismic hazard assessment and post-earthquake trend analysis. Laura and Stefan (2019) studied the b values of the earthquake sequences of the AmatriceNorcia MW6.2, MW6.6 in central Italy on August 24 and October 30, 2016; the Kumamoto MW6.5, MW7.3 sequence in Japan; and the Tohoku MW7.3, MW9.0 sequence in Japan. They concluded that the b value of the foreshock sequence would significantly decrease. Jiang et al (2021) found that the b value of the Yongping MS6.4 earthquake sequence in Yunnan showed a decrease followed by fluctuation before and after the main shock, reflecting the intense stress adjustment state in the sequence’s continuous process. Wang et al (2023) discovered the phenomenon of b value decreasing after the foreshock and increasing after the main shock, clearly reflecting the development process of the foreshock-main shock-aftershock sequence. In the actual calculation process, calculation error of the b value is obtained through the construction of a bootstrap process. Additionally, assuming N=1, M corresponds to the theoretical maximum earthquake magnitude Mmax, expressed as Mmax=a/b. The expression of the modified Omori’s law is n(t)$ ={K}/{{ ( t+c ) }^{p}} $, where n(t) represents the number of aftershocks at time interval t after the main shock, K represents the aftershock occurrence rate, and p is referred to as the aftershock frequency decay coefficient, representing the rate of sequence decay. A larger p value indicates faster decay, while a smaller p value suggests slower decay, typically varying between 0.9 and 1.5. Its variation characteristics may be related to the uneven structure, temperature changes, and stress accumulation levels in the crust. Discretizing frequency statistics over time periods can result in information loss, thus we obtained the p value and other coefficients in cumulative frequency form. The final integrated form of the modified Omori’s law is: when p≠1, $ N ( t ) = K[{c^{1- p}}- { ( t + c ) ^{1- p}}] /{{ ( p - 1 ) }}$, and when p=1, N(t)=Kln(c+t). In the actual inversion process, both equations are simultaneously calculated, and the fitting error is computed to select the smaller error value as the final p value calculation result. Due to the small sample size, conventional least squares methods may lead to local optimal solutions, hence genetic algorithms were used to solve the parameters. This study attempts to calculate the b value, p value, and other sequence parameters to identify evidence of the MS5.8 serving as a foreshock to the MS6.0 in the Barkam earthquake sequence.
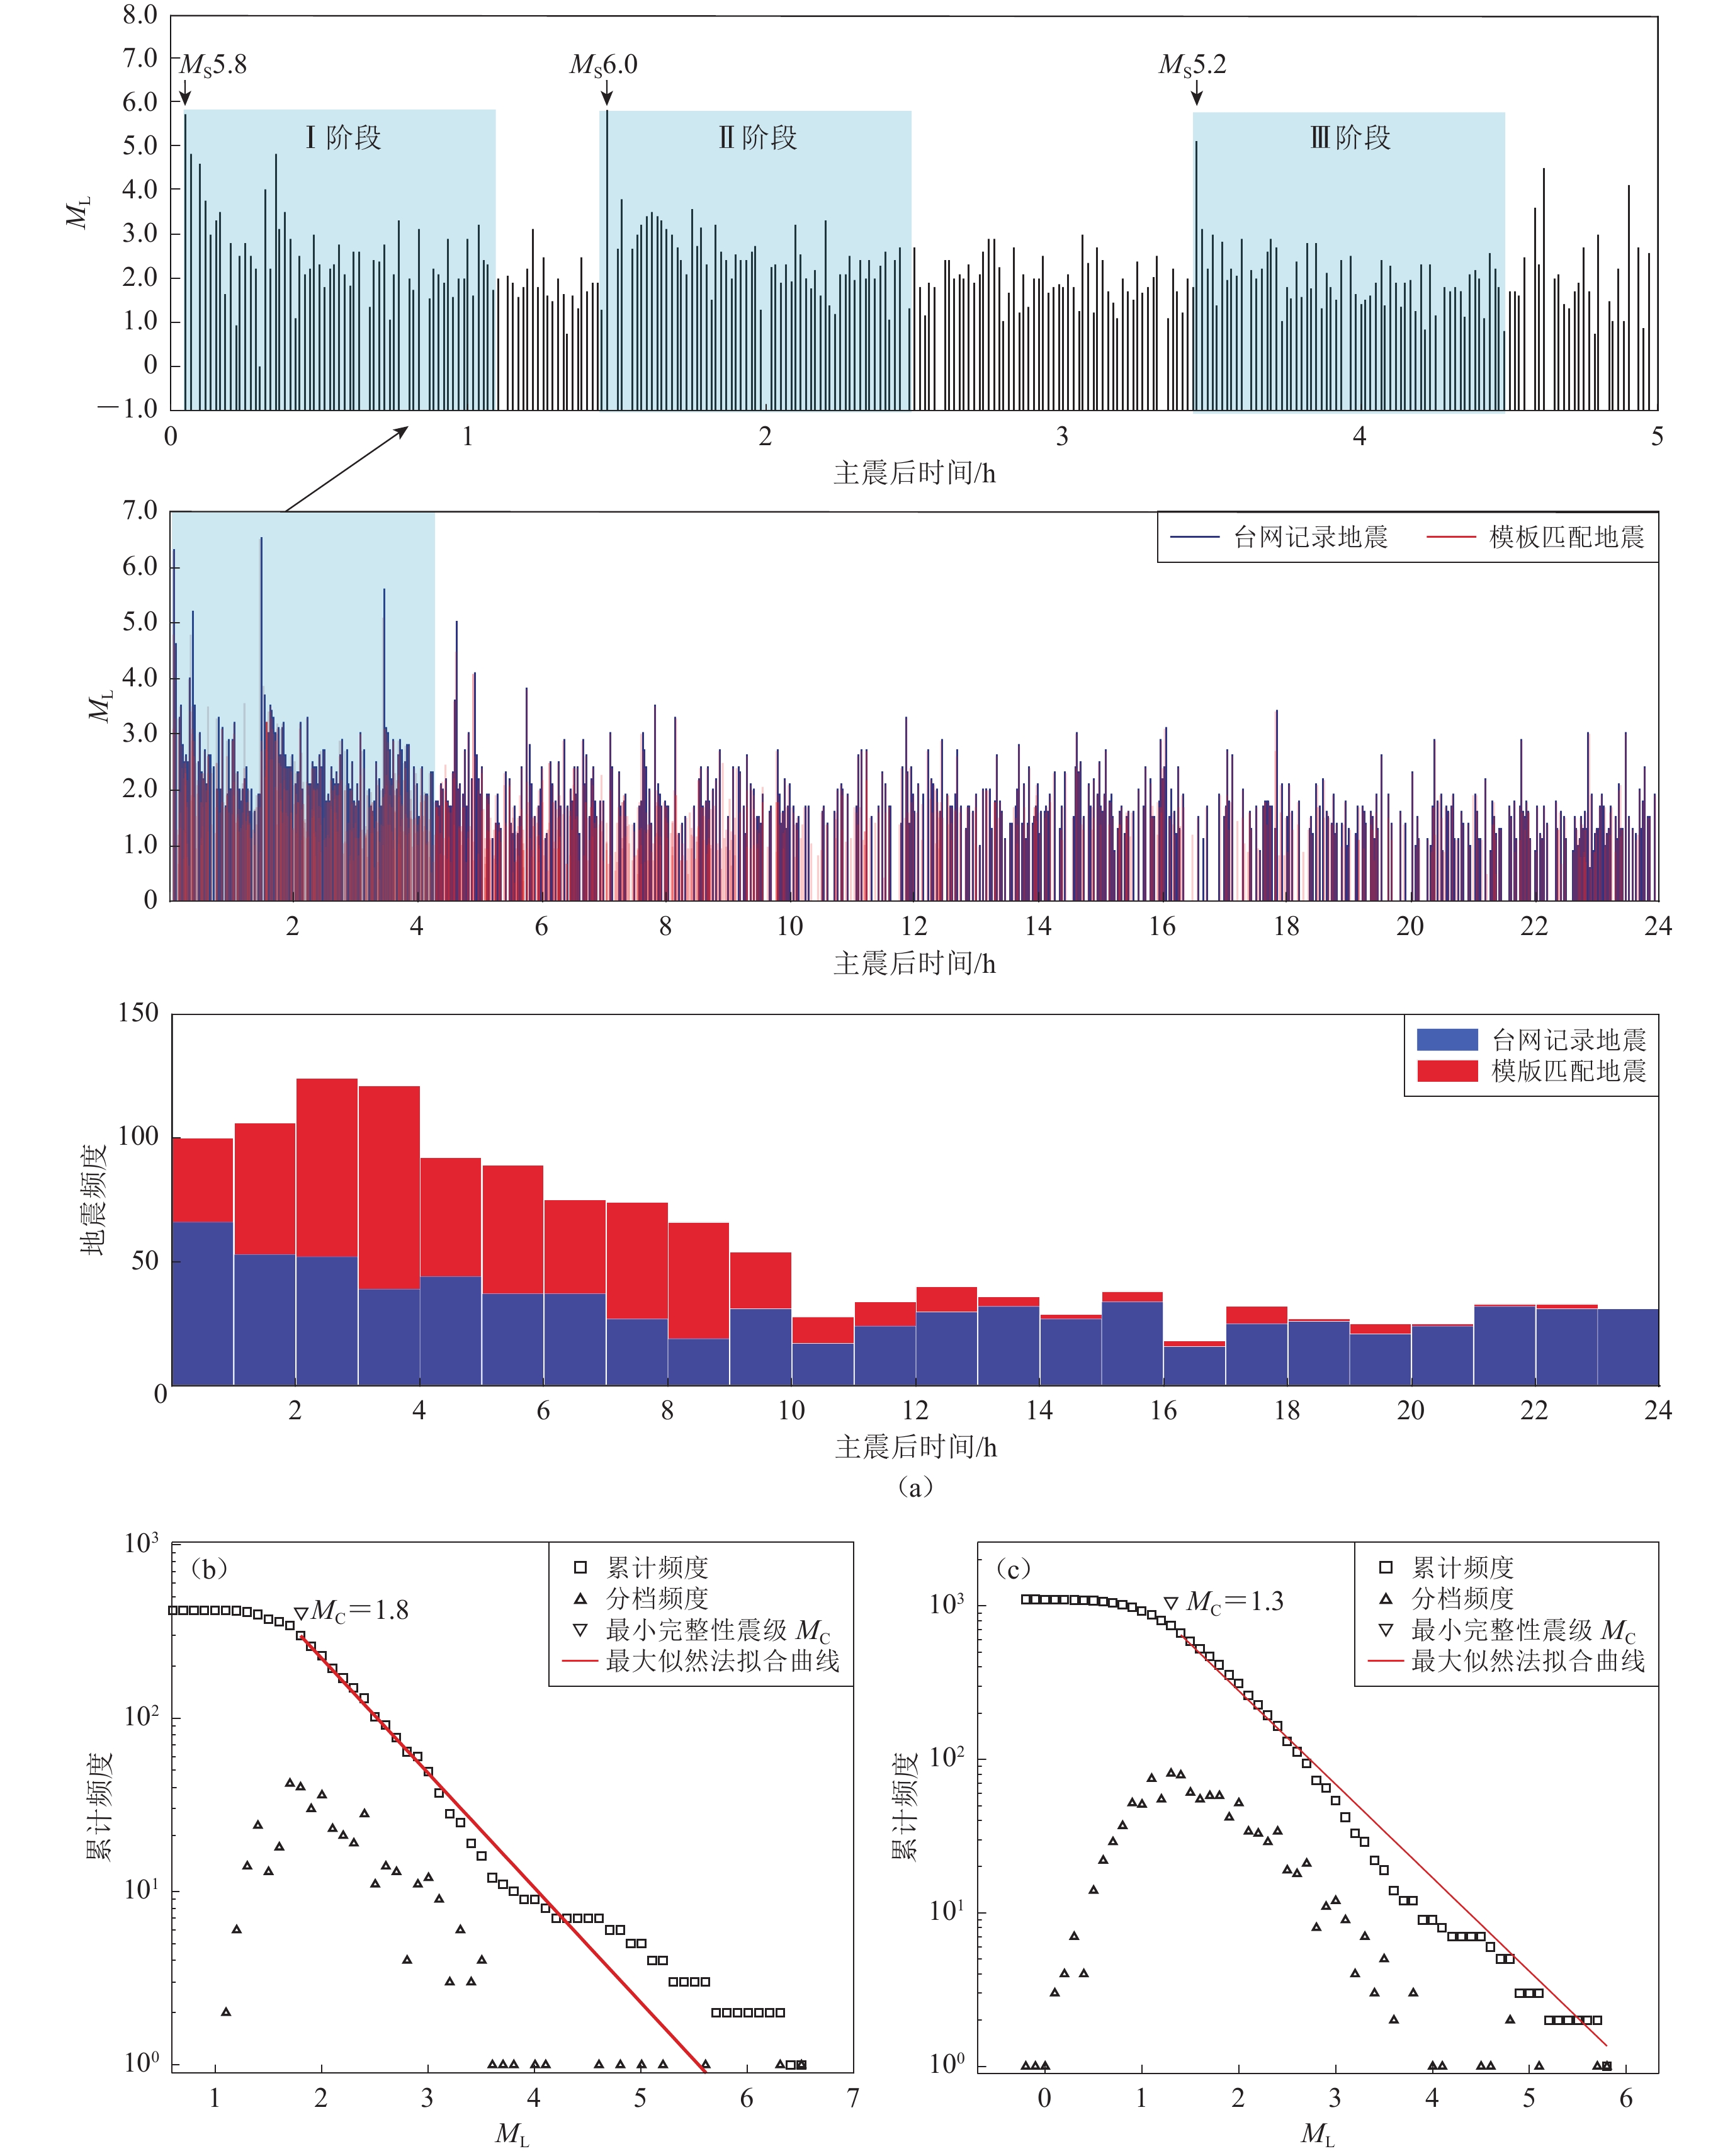
In this sequence, three MS≥5.0 events occurred within three hours of the sequence’s onset, indicating rapid sequence development. When we attempted to analyze the evolution characteristics between these three events, the short time intervals resulted in the signals of smaller earthquakes submerged in strong seismic waves, leading to incomplete aftershock records and insufficient statistical sample size. In order to increase the required seismic sample size for the study, a template matching method was used to detect missed earthquakes in the data from June 10th. Using 764 seismic events recorded by the network as templates, events with a correlation coefficient R≥0.85 were identified as individual earthquake events, and DBSCAN method was employed for earthquake correlation, ultimately obtaining 1 713 precise earthquake records, which is 2.2 times as much as the number of templates used. Since the identified earthquakes were similar to the template earthquakes in terms of location and nearly identical in terms of source mechanism solutions, the magnitudes of the missed earthquakes can be obtained by comparing their maximum S-wave amplitudes with the corresponding templates. The supplemented missed earthquakes mainly occurred before 10:00 a.m. , indicating significant interference of strong seismic waves in the manual identification of earthquakes, and also demonstrating the effectiveness of template matching in picking up missed earthquakes. The GFT method was used to compare and analyze the network catalog and the supplemented earthquake catalog before 10:00 a.m. , calculating the minimum completeness magnitudes, showing ML1.8 and ML1.3, respectively, proving the effectiveness of the template matching method in supplementing small magnitude earthquakes.
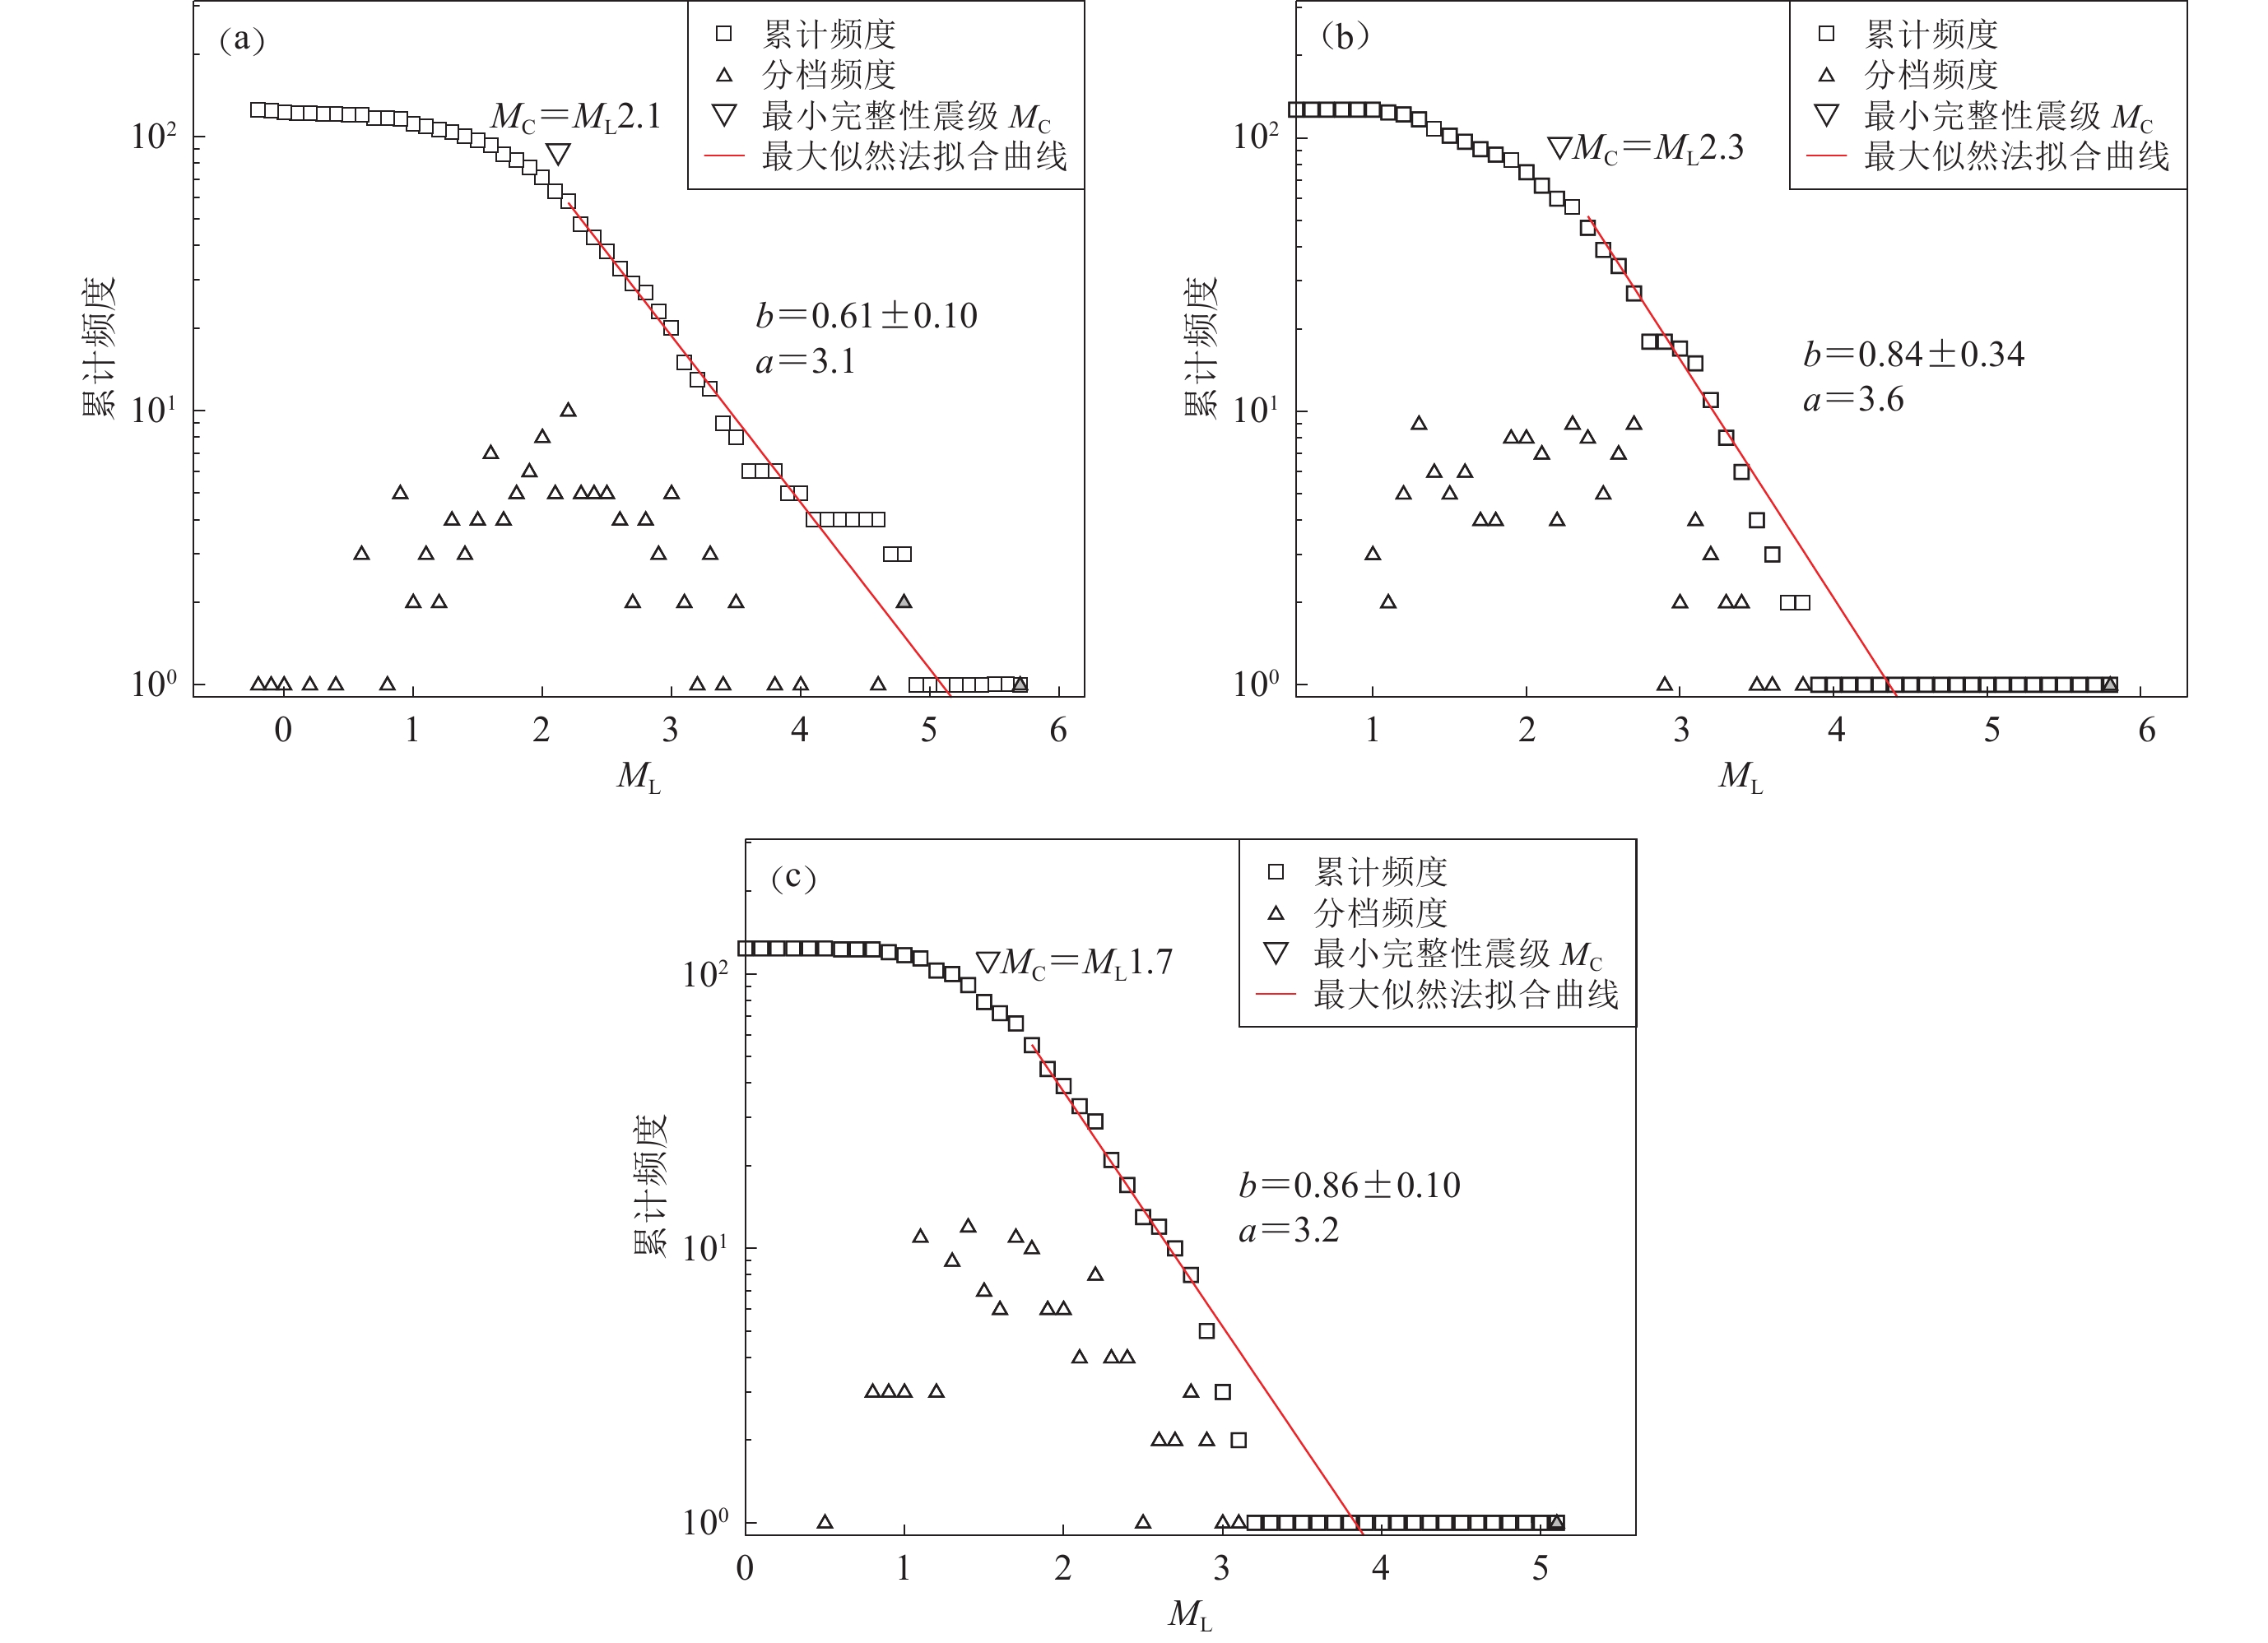
On June 10, three seismic events of MS≥5.0 divided the seismic sequence into different stages. To ensure data comparability and control variables, each stage was defined as Ⅰ , Ⅱ , and Ⅲ , with each stage beginning one hour after each of the three MS≥5.0 events. For each stage, the Gutenberg-Richter-Frohlich (GFT) method was used to calculate the minimum completeness magnitude (MC) of the seismic sequence. Events above the MC were selected, and their b values, Mmax values, and p values were calculated. The analysis aimed to identify potential differences in stress states and seismic activity characteristics across the different stages and to understand the early evolution patterns of the sequence. We have listed the amount of data used and the calculation results for each stage in Table 2. From the table, it can be seen that the sample sizes for each stage (above the completeness magnitude) were all over 50, with 69, 57, and 66 events, respectively, ensuring robust calculation results. The MC values for the three stages were ML2.1, ML2.3, and ML1.7, indicating a significant impact of strong earthquakes on short-term monitoring capabilities, with the degree of impact varying with the magnitude. Compared to stages Ⅱ and Ⅲ , stageⅠexhibited a significantly lower b value (0.59). Over time, the b value gradually increased, with the subsequent two stages being 0.84 and 0.86, respectively. The low b value of stage Ⅰ suggests a high stress level in the seismic zone, indicating that the MS5.8 earthquake could be considered as a foreshock of the MS6.0 earthquake. The Mmax values also demonstrated differences across the stages, with an Mmax value of ML5.0 in stage Ⅰ , the highest among the three stages. The subsequent stages showed a gradual decrease of Mmax from ML4.2 to ML3.7, reflecting the potential foreshock nature of the seismic sequence in stage Ⅰ .
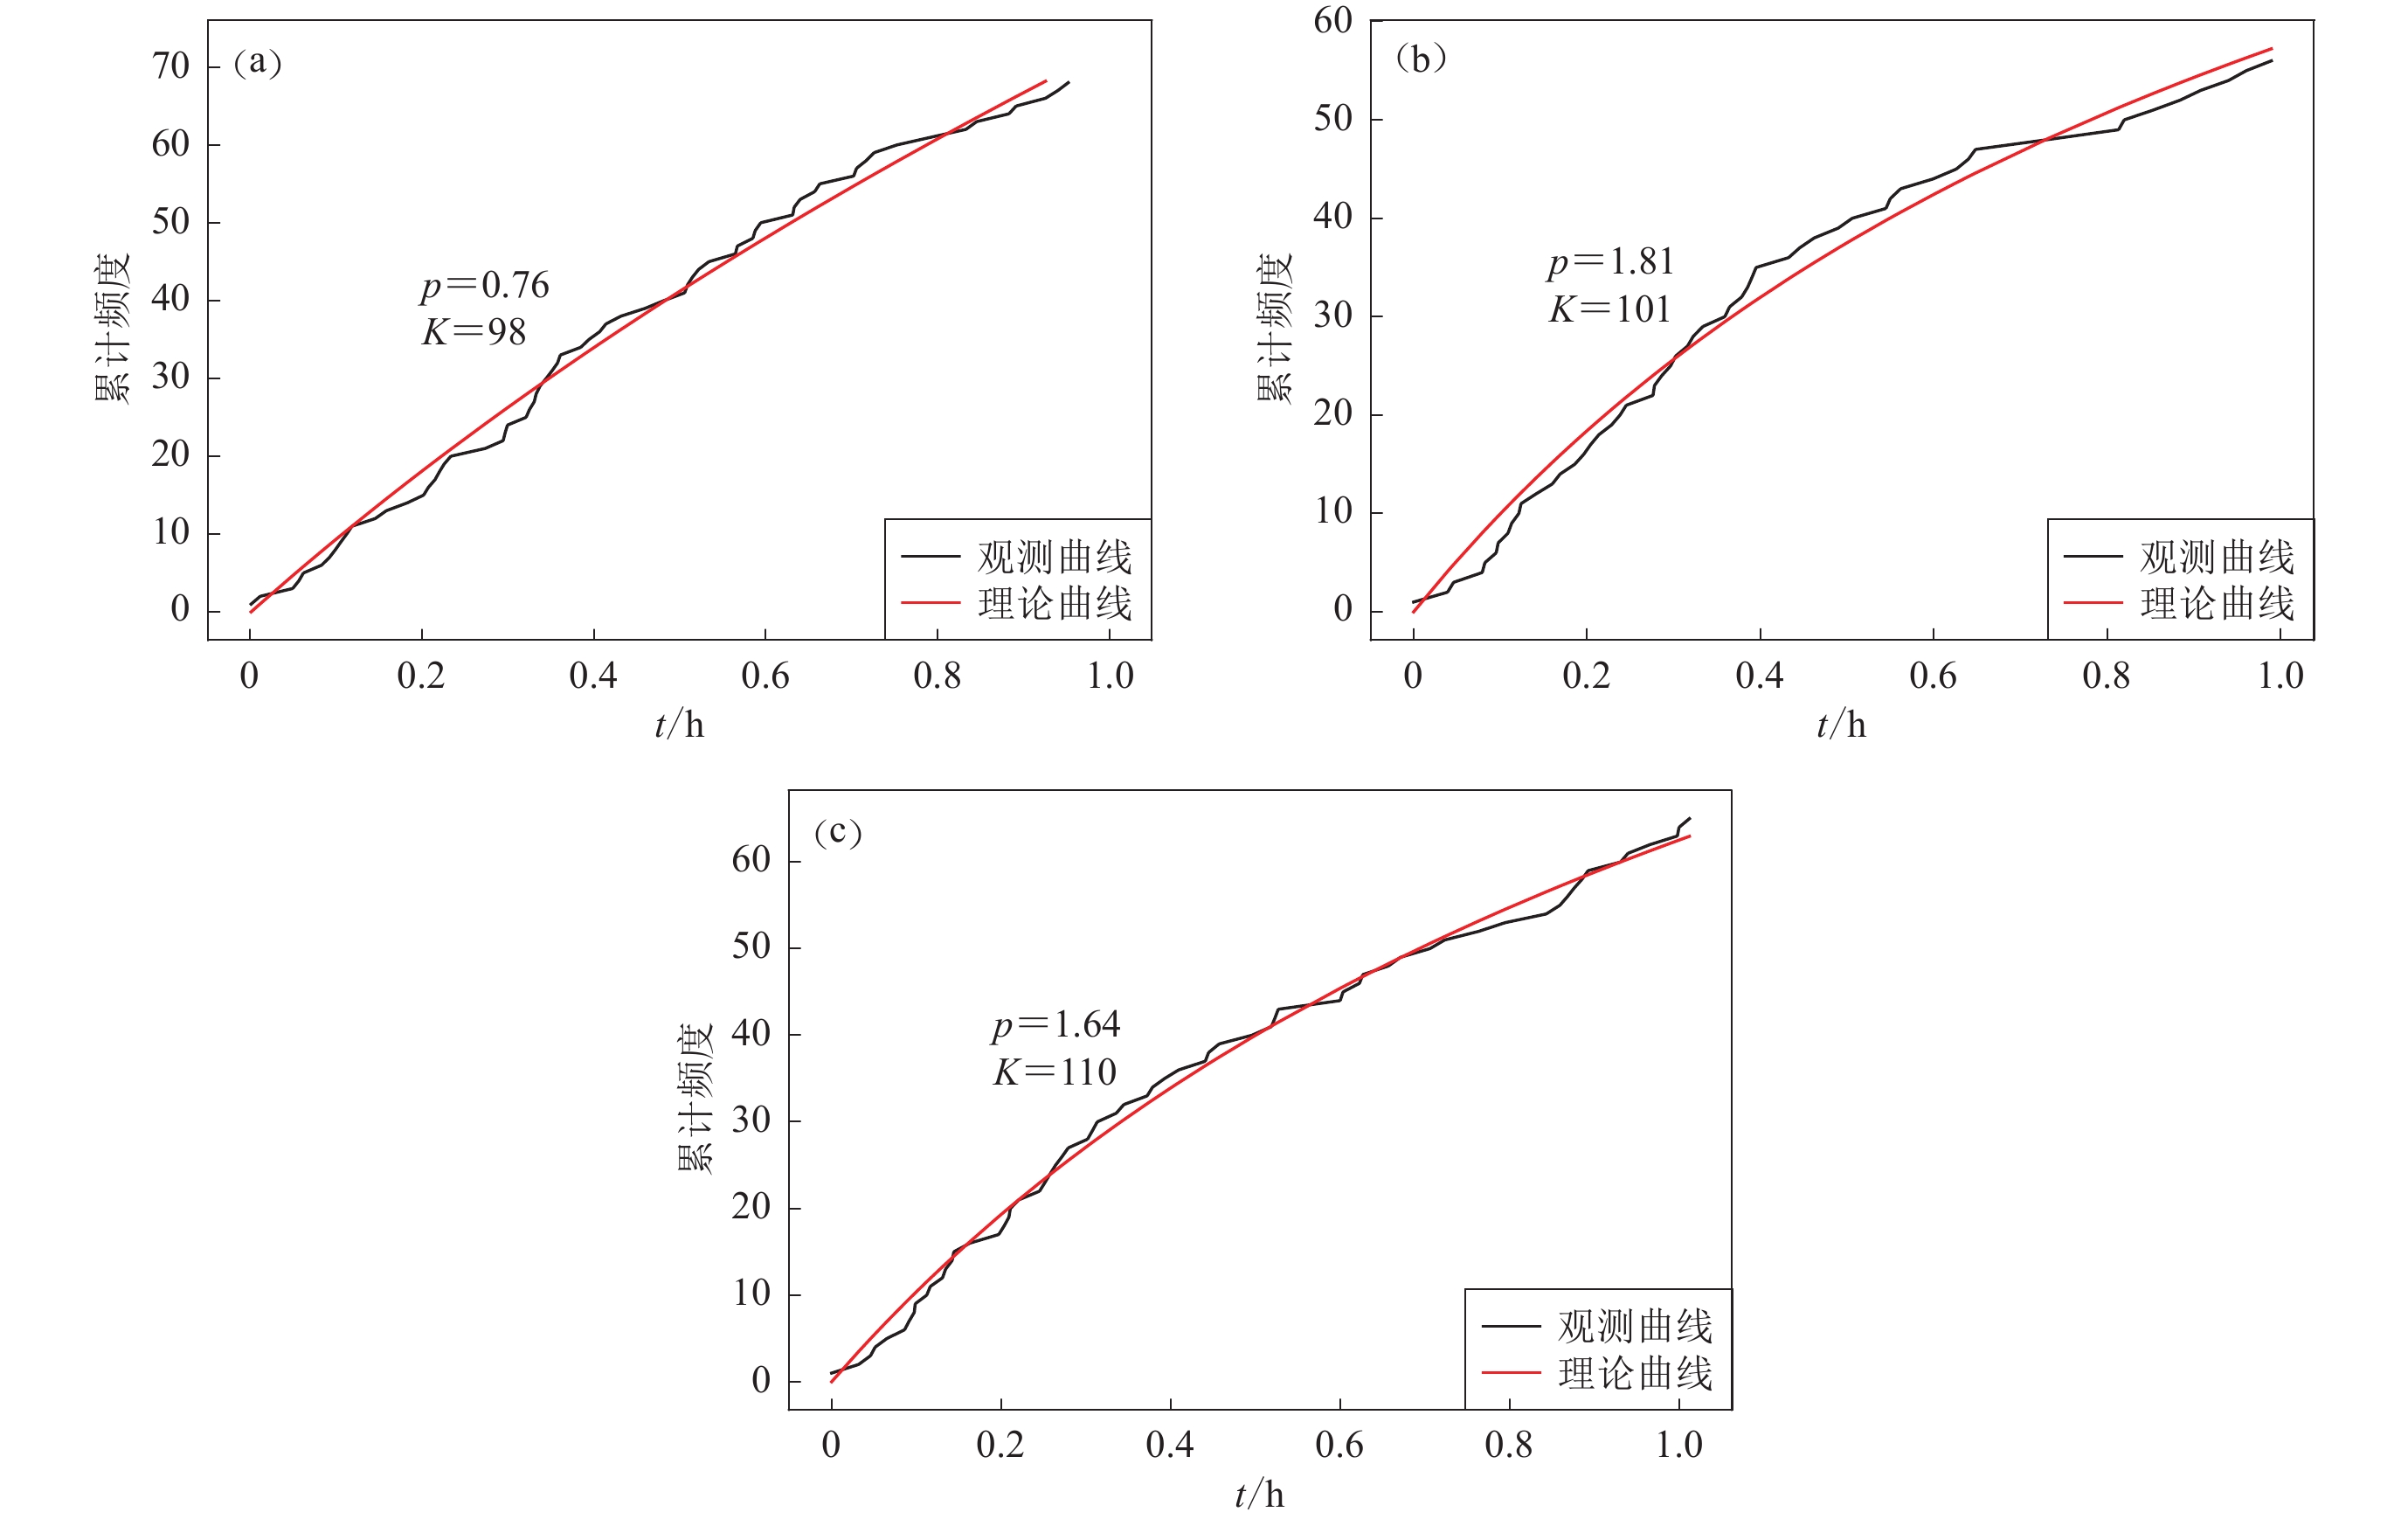
The a value of stage Ⅰ (3.1) was not significantly different from that of stage Ⅲ (3.2), but was lower than that of stage Ⅱ (3.6), suggesting that the a value alone cannot distinguish between foreshocks and aftershocks. When calculating the p value for events above the MC for each stage, the p value for stage Ⅰ was 0.76, significantly lower than those of the subsequent two stages, which were 1.81 and 1.64, respectively. This suggested that the seismic sequence in stage Ⅰ exhibited slower decay and insufficient stress release, while the subsequent two stages were opposite, possibly indicating differences in the temporal evolution between the foreshock sequence and the aftershock sequence.
Conclusions
The spatial distribution characteristics of the Barkam MS6.0 earthquake swarm in the region indicated a significant spatial migration feature, suggesting that the sequence was not a simple single rupture event, but a complex seismic sequence. Given the presence of two branches in the sequence, the evolution characteristics over time were discussed separately for the east and west branches. Calculations for the west branch yielded MC of ML1.5, b value of 0.71, and p value of 0.81, while the corresponding parameters for the east branch were ML1.6, 0.93, and 0.94, respectively. The differences in the parameters between the west and east branches reflected that the two branches were formed not by a single fault structure. The lower b and p values in the west branch indicated insufficient stress release, a high stress level, and slow decay, possibly related to the occurrence of the foreshock sequence.
In summary, the seismic cluster of the MS6.0 event in Barkam on June 10, 2022 occurred near the intersection of the Songgang fault and the Longriba fault, indicating a complex fault structure. The seismic cluster exhibited rich small earthquakes, slow overall decay, and segmental spatial characteristics. Several conclusions were drawn from the analysis:
1) The Barkam MS6.0 earthquake swarm occurred near the intersection of the NW-trending Songgang fault and the NE-trending Longriba fault, indicating a complex fault structure. The precise positioning results showed that the sequence was located along the NE direction of the Songgang fault, with an overall NW-SE orientation and parallel east and west branches. The east and west branches exhibited spatial migration features and different spatial distribution patterns. The source mechanisms of the larger earthquakes in the sequence were consistent, all being strike-slip type, which aligns with the regional background and the nature of the Songgang fault. It is speculated that this sequence was caused by several different-sized faults, which are close to the Songgang fault, not exposed at the surface, and may be connected to the Songgang fault at depth, representing concealed branch faults of the Songgang fault.
2) Using template matching, 1 713 precise earthquake events were identified, which was 2.2 times as much as the number of templates used. This reflected the significant interference of strong seismic waves on manual earthquake identification and demonstrates the effectiveness of template matching in detecting missed earthquakes.
3) By dividing the sequence into three stages following each MS5.0 event, the b and p values were compared and analyzed. The results showed a significantly lower b values in stage Ⅰ , reflecting a higher stress level in the seismic zone during this stage. The M5.8 earthquake can be considered as a foreshock before the MS6.0 earthquake. Additionally, the p value for stage Ⅰ was significantly lower than the subsequent two stages, indicating differences in the temporal evolution between the foreshock sequence and the aftershock sequence.
4) When analyzing the east and west segments separately, we found that the west segment exhibited lower b and p values, indicating insufficient stress release, high stress level, and slow decay, possibly related to the occurrence of the MS5.8 foreshock sequence in this segment.
5) In summary, the comprehensive analysis suggests that the MS5.8 earthquake was a foreshock of MS6.0 event in Barkam. Temporally, the MS5.8 earthquake sequence before the main shock exhibited characteristics of low b and p values. Spatially, the west segment of the MS5.8 earthquake sequence also showed lower b and p values, indicating slow decay of the foreshock sequence of the Barkam MS6.0 earthquake swarm and the presence of insufficient stress release and high stress levels in the foreshock area.
-
引言
日本位于欧亚、 菲律宾、 太平洋和北美等四大板块交汇处,太平洋板块向北美板块移动形成俯冲带,并以80—90 mm/a的速率向西北部的北美板块俯冲(Sella et al,2002),导致两大板块边界应力不断积累.虽然地震在该板块边界经常发生并释放出一定能量,但更大的能量于2011年3月11日以日本东北MW9.0地震的形式得到了释放.此次地震不仅直接造成了人员伤亡和财产损失,而且还引发了巨大的海啸及其它次生灾害,给日本带来了巨大的灾难.
对断层滑动分布的研究可以进一步为日本东北MW9.0地震的研究提供依据.该地震发生后,不同研究者分别利用不同数据对此次地震发震断层的滑动分布进行了反演研究.例如:Ozawa等(2011)利用GPS数据确定了同震和余震的滑动分布,并对滑动分布结果进行了分析,其中同震滑动分布显示最大滑动量集中在近震区,达到27 m,释放的矩张量为3.43×10²² N·m;Zhang等(2012)利用GPS形变数据和远震数据分别反演了断层的同震滑动分布,并联合反演了断层的破裂过程,认为日本东北MW9.0地震为双侧破裂事件;Yagi和Fukhata(2011)通过远震P波数据反演了断层的破裂过程,得到总滑动量的最大值为50 m,地震矩张量为5.7×10²²N·m;许才军等(2012)通过GPS形变数据对PALSAR和ASAR的干涉测量结果进行轨道误差校正后,对InSAR数据进行均匀采样,然后联合PALSAR、 ASAR的干涉测量数据和GPS数据反演了断层的滑动分布,反演的最大滑动量为50.3 m,震级为MW8.9;刁法启等(2012)基于分层模型,利用陆上GPS数据并加入海底GPS/声波资料反演了断层的滑动分布,结果显示最大滑动量为45.8 m,震级为MW9.0;Wang等(2012a)利用ASAR的干涉测量数据与GPS数据观测时间段的不同,分别确定了该地震同震和余震的断层滑动分布,认为InSAR数据可以对断层的滑动量提供更丰富的约束;Feng等(2012)以及Feng和Jónsson(2012)先利用GPS数据对InSAR形变结果进行校正,以消除大气和轨道的影响,再通过不同的数据组合对断层的同震滑动分布进行反演和比较分析.由于不同研究者所选用数据以及使用方法的不同,导致出现了不同的结果.
通过上述研究可知,虽然陆上GPS观测资料数量不少,但InSAR仍然可以弥补GPS在空间约束上的不足.同时,由于海底GPS/声波测站目前只有几个,相对于陆地上的GPS和InSAR观测资料来讲,其对断层滑动量的约束能力很难体现.另外,日本东北MW9.0地震所引起的地表破坏范围较大,几乎包括了整个日本主岛,且所能观测到的地表形变只位于断层的一侧,因此,利用InSAR数据进行反演时,只采用单纯的均匀采样或者四叉树采样(Jónsson et al,2002)方法并不合适,而选择更为合适的数据点重采样方法就显得尤为重要.本文首先对Envisat/ASAR数据进行干涉处理,得到地震同震形变场;然后对InSAR同震形变数据重采样的方法进行深入分析,选择条纹率结合相干性的方法对InSAR数据进行重采样;最后基于弹性半空间位错模型(Okada,1985),用重采样后的InSAR和GPS数据对发震断层的滑动分布进行联合反演,并对反演结果进行分析.
1. GPS和InSAR同震形变场
1.1 GPS同震形变场
日本在其大陆布设了“地球观测网络”,并于2011年3月11日在日本东北MW9.0地震前后分别进行了观测.美国喷气推进实验室的“先进的快速成像和分析”(ARIA)团队及加利福尼亚理工学院对日本地球空间信息局的“地球观测网络”的GPS数据进行了处理,得到并发布了GPS同震形变数据(ARIA,2011).本文考虑到InSAR覆盖范围以及对断层滑动分布反演的需要,只选取了35°N—43°N、 136°E—142°E范围内的GPS点进行分析. GPS测站分布如图 1所示. 可以看出,GPS测站覆盖了整个日本主岛且分布比较均匀,平均间距为20—30 km.图 2给出了GPS测定的水平及垂直同震位移场.可以看出,水平方向形变集中在36°N—40°N范围内的陆地地区,位移方向指向震源方向,最大水平形变量为4—5 m;垂直方向形变集中在38°N—40°N范围内的陆地地区,并呈现出下降的趋势,垂直方向形变量相对于水平方向较弱,但也达到了1—2 m.单从GPS测量结果来看,此次地震释放了非常大的能量,对地面造成了巨大影响.
![]() 图 1 GPS测站位置(三角形)及InSAR覆盖范围(矩形框)Figure 1. GPS sites (triangles) and InSAR coverage areas (rectangles)
图 1 GPS测站位置(三角形)及InSAR覆盖范围(矩形框)Figure 1. GPS sites (triangles) and InSAR coverage areas (rectangles)![]() 图 2 GPS测定的日本东北MW9.0地震的水平(a)和垂直(b)同震位移场Figure 2. Horizontal (a) and vertical (b) coseismic displacements of the Tohoku MW9.0 earthquake inferred from GPS data
图 2 GPS测定的日本东北MW9.0地震的水平(a)和垂直(b)同震位移场Figure 2. Horizontal (a) and vertical (b) coseismic displacements of the Tohoku MW9.0 earthquake inferred from GPS data1.2 InSAR形变数据处理及分析
日本东北MW9.0地震发生前后,日本宇航局ALOS卫星L波段的PALSAR传感器以及欧洲空间局Envisat卫星C波段的ASAR传感器对地震区进行了观测.根据本文研究区域,通过各空间局的数据获取计划获取了一定的SAR数据,同时又通过Supersites网站(Supersites,2011)下载了部分SAR数据. 由于PALSAR数据存在较显著的轨道误差及大气电离层误差,因此,本文只选用ASAR数据进行干涉处理及作为滑动分布的约束.
本文所获取的SAR数据均为原始数据,这些数据不能直接用于干涉处理. 因此,在SAR数据获取后,首先要对原始数据进行处理,主要包括:原始数据参数文件的生成,原始数据拼接,以及距离向压缩和方位向压缩等.从GPS数据可以发现,日本东北MW9.0地震震区范围较大,单景影像只能覆盖小部分震区,因此在生成原始数据的参数文件后,必须对同一轨道的多景影像进行拼接处理.经过拼接以及后续的SLC数据生成后,根据InSAR形变测量的要求,从众多ASAR数据中选取表 1中的数据进行干涉处理. 该数据的覆盖范围如图 1中矩形框所示.
表 1 Envisat/ASAR数据信息Table 1. Details of Envisat/ASAR data数据名称 轨迹 主影像时间 辅影像时间 时间基线/d 垂直基线/m T189 2011-03-10 2011-04-09 30 -315 Envisat/ASAR T347 2011-02-19 2011-03-21 30 -174 T74 2011-03-02 2011-04-01 30 -120 对于经过干涉处理生成的初始干涉图,采用二轨差分干涉测量方法去除地形相位的影响,使用的外部地形数据来自“航天飞机雷达地形测绘任务”(shuttle radar topography mission,简写为SRTM)的90米分辨率的数字高程模型(Farr et al,2007). 将研究区域的SRTM数据投影到干涉图所对应的雷达坐标系下,然后根据高程与相位的转换关系模拟地形相位,再将地形相位部分从干涉相位中去除,生成差分干涉图(D-InSAR).为获取地表的视线向真实形变,需要对差分干涉图进行解缠处理. 在解缠之前首先采用改进的Goldstein滤波方法(Li et al,2008)对差分干涉图进行去噪处理,以减小噪声的影响;然后采用最小费用流和不规则三角网的方法对差分干涉图进行解缠,去除大气影响后得到了仅包含形变相位的差分干涉图;最后再将干涉图转化为形变图.由于该形变图为雷达坐标系下的视线向形变图,经过地理编码的处理后便得到了WGS-84坐标系下的形变图. ASAR同震形变干涉图如图 3所示.通常ASAR形变干涉图中每个条纹代表 0.028 m的形变值,但由于日本东北MW9.0地震所引起的地表形变非常大,使得形变干涉条纹非常密集,不便显示,因此图 3中形变以每个条纹0.118 m进行显示.
![]() 图 3 日本东北MW9.0地震的同震形变干涉图(星号代表震中位置,下同)Figure 3. Coseismic interferogram of the Tohoku MW9.0 earthquake where the star represents the epicentral location (the same below)
图 3 日本东北MW9.0地震的同震形变干涉图(星号代表震中位置,下同)Figure 3. Coseismic interferogram of the Tohoku MW9.0 earthquake where the star represents the epicentral location (the same below)从图 3可以看出,大部分地区的干涉相干性较高,相位条纹保持着比较好的连续性,并未出现由于形变梯度过大而引起的条纹混叠现象. 图中东北地区及最南部地区相干性比较好,条纹也很连续;但在中间的西部地区存在比较严重的相位失相干,使得噪声相对比较明显. 失相干可能是由地表植被或者冰雪覆盖所引起的.可见,日本本土绝大部分地区均受到了地震的严重影响,产生了大的形变,在37°N—40°N之间地区的干涉条纹比较密集,在其南部及北部地区条纹相对较稀疏,故此次地震对日本北部地区的影响要比南部大.本文的形变干涉结果与已有研究结果(许才军等,2012; Feng,Jónsson,2012;Wang et al,2012a)具有很好的一致性,与GPS所测得的形变特征(图 2)也比较吻合.
2. InSAR形变场重采样方法
由于InSAR数据具有高空间分辨率的特点,决定了利用该数据获取同震形变场的数据量相当大. 如果将所有的形变数据点均用作反演,不但影响计算效率,而且有可能超出计算机的计算能力.因此,如何选择合理的数据点进行反演就显得尤为重要.本文首先对常用的平均选点法(许才军等,2012)、 四叉树法(Jónsson et al,2002)和条纹率法(Feng,Jónsson,2012)进行分析和比较,分析不同方法的适用性及各自特点,确定最终用于反演的选点方法并进行数据采样.
考虑到日本东北MW9.0地震的数据量非常大,为便于计算,本文在进行四叉树选点试验时,只对T347形变场的部分(图 4)进行了选点分析.从InSAR结果已知此次地震产生了很大的形变,形变梯度较大. 从四叉树选点方法的特点来看,该方法适用于此次地震InSAR结果的选点.本文采用四叉树选点的方法,将所选部分区域的均方根差阈值设为0.5 m,选到的点数为9628个,所选的采样点多集中在陆地边界以及不同InSAR条带边界处.由于此次地震形变范围广,整个形变场中存在陆地边界及不同条带间的边界,因此无论阈值选择大与小,按照四叉树方法进行处理时,在边界处的数据点更容易被选中,而在边界内部的数据点则不容易被选中,从而使边界内部被选中的数据点明显少于边界处的数据点.从四叉树方法提出的初衷以及用于反演的思路来看,靠近震源的地方受地震影响更大,应采样更多的点用于约束震源模型;而远离震源的地方则影响较小,应采样较少的点.由此可知,通过四叉树方法很难实现合理的数据点采样,即整个InSAR形变场采样数据点数由右向左递减,故该方法并不适用于日本东北MW9.0地震InSAR数据点的重采样工作.
![]() 图 4 四叉树方法重采样示例图(a) 原始形变图; (b) 四叉树方法重采样后的形变图Figure 4. Example of quadtree method for resampling(a) Original deformation map; (b) Deformation map after quadtree method is used for resampling
图 4 四叉树方法重采样示例图(a) 原始形变图; (b) 四叉树方法重采样后的形变图Figure 4. Example of quadtree method for resampling(a) Original deformation map; (b) Deformation map after quadtree method is used for resampling本文同样也对平均选点法及条纹率法进行了试验和分析,并结合干涉图的相干性(图 5)对数据进行重采样.可以看出,高相干区域主要集中在T347中部以及整个形变场的南部地区. 为保证数据质量,在采用条纹率法和平均选点法进行数据采样处理时,根据经验将相干性小于0.3的点剔除,最终的采样结果如图 6所示.条纹率法共采样数据点3 473个(其中T347条带2393个,T74条带158个,T189条带922个),平均选点法共采样数据点3467个(其中T347条带2401个,T74条带163个,T189条带903个). 采样点个数上有所差异,但总数相当.从两种采样方法的采样数据点分布(图 6)可知:平均选点法的结果对相干性的依赖性较高,在高相干地区选择的点较多,即在整个干涉图的下部,所采样数据点相对较多;条纹率法对相干性的依赖性则相对较低,所选数据点分布主要依赖于条纹分布.利用形变数据点进行反演时,点位梯度分布越好,对断层模型的约束越合理. 由此可知,条纹率采样法更适用于日本东北MW9.0地震,采样数据点不至于全部集中在高相干点处,这样既保证了数据的质量,也保证了能全面反映形变信息.因此,本文最终将条纹率法所采样的数据作为断层同震滑动分布反演的观测数据.
![]() 图 6 条纹率法(a)和平均选点法(b)重采样InSAR数据点分布图Figure 6. Distribution of InSAR data resampled by fringe rate method (a) and uniform method (b),respectively
图 6 条纹率法(a)和平均选点法(b)重采样InSAR数据点分布图Figure 6. Distribution of InSAR data resampled by fringe rate method (a) and uniform method (b),respectively3. 断层滑动分布反演及分析
在得到日本东北MW9.0地震的同震形变之后,联合GPS和InSAR数据对断层的同震滑动分布进行反演.
3.1 滑动分布反演
本文反演所用的断层几何参数采用Zhang等(2012)确定的结果.在进行反演前,将断层分成若干个小的断层单元,根据确定的断层几何参数,将断层沿走向方向划分为31列,深度方向划分为20行,断层单元总数为620个.反演模型采用均匀介质弹性半空间位错模型(Okada,1985),介质的泊松比定为0.25.在确定断层几何参数后,形变数据与滑动量之间变为线性关系,于是可以构建观测数据d与地震断层滑动量s之间的关系,即

式中,D为拉普拉斯平滑算子,k2为平滑因子,W为数据权比参数,G为格林函数.该式可利用线性反演方法求解.
利用最小二乘法对GPS和InSAR形变数据进行联合反演计算,得到了日本东北MW9.0地震的断层滑动分布.在进行GPS和InSAR联合反演时,通过经验定权(Feng et al,2010;Wang et al,2012b)确定权比参数的大小.反演结果如图 7所示.
3.2 反演结果分析
从反演滑动分布(图 7a)可知,断层滑动主要集中在断层中上部,最大滑动量为49.9 m.根据该反演结果获得的矩张量为M0=4.89×10²² N·m,所对应的矩震级为MW9.1. 该结果与Yagi和Fukhata(2011)通过远震P波数据反演的结果较吻合.本文还对反演结果的误差进行了计算,结果表明滑动量越大的地方误差也越大,计算结果如图 7b所示.
最后利用反演结果正演模拟了InSAR形变场(图 8)和GPS形变场(图 9),并对InSAR与GPS观测结果进行了对比(图 8、 图 9).可以看出,模拟形变场的结果与观测数据较接近.从InSAR残差干涉图(图 8b)可以看出,大部分区域的形变拟合较好,只能看到少量的干涉条纹,南部地区的干涉条纹拟合较差.通过分析InSAR形变场和GPS形变场可知,由于InSAR形变结果覆盖整个区域,南北跨度较大,而本文所采用反演模型为简单的均匀半空间弹性位错模型,并未考虑介质的非均匀变化以及地球曲率的影响,这势必会造成反演结果存在一定程度的偏差.
![]() 图 8 日本东北MW9.0地震的模拟形变干涉图(a)和残差干涉图(b)Figure 8. Simulated deformation interferogram (a) and residual interferogram (b) of the Tohoku MW9.0 earthquake
图 8 日本东北MW9.0地震的模拟形变干涉图(a)和残差干涉图(b)Figure 8. Simulated deformation interferogram (a) and residual interferogram (b) of the Tohoku MW9.0 earthquake![]() 图 9 水平方向(a)和垂直方向(b)的实测(蓝色箭头)和模拟(红色箭头)GPS形变Figure 9. Observed (blue arrows) and simulated (red arrows) GPS deformations in horizontal (a) and vertical (b) direction
图 9 水平方向(a)和垂直方向(b)的实测(蓝色箭头)和模拟(红色箭头)GPS形变Figure 9. Observed (blue arrows) and simulated (red arrows) GPS deformations in horizontal (a) and vertical (b) direction4. 讨论与结论
本文通过对InSAR形变数据重采样方法的比较和分析,并联合GPS反演得到了日本东北MW9.0地震的断层同震滑动分布,得出如下结论:
1)所得差分干涉图的相位条纹保持了比较好的连续性,并未出现由于形变梯度过大而引起的条纹混叠现象,较好地反映了此次地震对日本陆上地区地表所造成的影响,即绝大部分地区均受到了该地震的严重影响,在地表产生了很大的形变,并以震中为中心由东向西逐渐减小.在37°N—40°N之间的陆上区域,条纹比较密集,形变较大;在37°N以南地区条纹相对较稀疏,形变较小,这与GPS所测的形变特征较吻合.
2)利用InSAR技术能够检测高空间分辨率的同震地表形变,利用该数据可进行断层滑动量反演,但在反演数据量过大时需进行重采样处理.日本东北MW9.0地震所引起的地表形变范围及梯度均较大,且在地震影响区域内存在除断层外的有限边界(如陆地边界),所以采用考虑相干性的条纹率法对InSAR形变数据进行重采样是比较合理的.
3)利用GPS和InSAR同震形变数据可以联合反演断层的滑动分布,InSAR数据可以很好地弥补GPS数据空间分辨率的不足.联合反演得到的滑动量主要分布在地表以下50 km范围内,最大滑动量为49.9 m,矩张量为4.89×10²² N·m,所对应的矩震级为MW9.1. 该结果与Yagi和Fukhata(2011)通过远震P波数据反演的结果比较吻合,与其他研究者(刁法启等,2012;许才军等,2012;Feng,Jónsson,2012)所得到的滑动分布稍有差异,最大滑动量也存在一定的差异. 造成这些差异的原因,主要是所采用的数据、 反演方法以及模型不同所造成的.
欧洲空间局提供了部分ASAR数据(项目CIP.14439),北京大学张勇研究员和中国科学院测量与地球物理研究所刁法启博士对本研究给予了帮助,在此一并表示感谢.
-
![]()
图 1 马尔康及邻区区域构造和MS≥5.0历史地震震中分布图
断裂数据引自徐锡伟等(2016);板块边界数据引自张培震等(2003)
Figure 1. Map of Barkam and neighboring regional geological settings and epicenters of historical MS≥5.0 earthquakes
Fracture data are after Xu et al (2016),and plate boundary data are after Zhang et al (2003)
![]()
图 2 马尔康MS6.0震群序列重定位及部分MS≥3.5余震震源机制解
Figure 2. Relocation of the Barkam MS6.0 swarm sequence and focal mechanismsolutions of some MS≥3.5 aftershocks
![]()
图 3 2022年6月10日马尔康MS6.0震群序列M-t图和小时频次图(a)、台网目录(b)及补全地震(c)的震级-频度关系图
Figure 3. Hourly frequency and M-t diagram (a) of Barkam MS6.0 earthquake sequences on 10 June,2022,and magnitude-frequency relationship based on network seismic catalogue (b) and complete seismic catalogue (c)
![]()
图 4 马尔康MS6.0震群序列第Ⅰ阶段(a)、第Ⅱ阶段(b)和第Ⅲ阶段(c)的震级-频度关系图
Figure 4. Magnitude-frequency relation for Barkam MS6.0 earthquake sequences in stage Ⅰ (a),stage Ⅱ (b) and stage Ⅲ (c)
![]()
图 5 马尔康MS6.0震群序列第Ⅰ(a)、第Ⅱ(b)和第Ⅲ(c)阶段的余震频度随时间衰减拟合关系图
Figure 5. Parameter fitting results of temporal decay rate of aftershocks for Barkam MS6.0 earthquake sequence in stages Ⅰ (a), Ⅱ (b) and Ⅲ (c)
![]()
图 6 马尔康MS6.0震群序列西支(a)和东支(b)震级-频度关系(左)及余震频度随时间衰减拟合关系(右)
Figure 6. Magnitude-frequency relation (left) and parameter fitting results of temporal decay rate of aftershocks (right) for west segment (a) and east segment (b) of Barkam MS6.0 earthquake sequence
Table 1 Focal mechanism solutions of the 10 June 2022 Barkam MS5.8,MS6.0 events and some MS≥3.5 aftershocks
Origin time
a-mo-d h:minMW M Best fit
depth/kmNodal plane Ⅰ Nodal plane Ⅱ strike/° dip/° slip/° strike/° dip/° slip/° 2 022-06-10 00:03 5.3 5.8 7 324 76 0 234 90 166 2 022-06-10 01:28 5.79 6.0 6 329 90 −3 59 87 −180 2 022-06-10 03:27 5.2 251 84 −175 160 85 −6 2 022-06-10 04:37 4.46 4.4 6 339 76 0 249 90 166 2 022-06-10 04:54 3.98 3.9 8 155 84 9 64 81 174 2 022-06-14 18:11 4.38 4.4 5 149 87 22 58 68 177  下载: 导出CSV
表 1 2022年6月10日马尔康MS5.8,MS6.0震群序列主震及部分MS≥3.5余震震源机制解
Table 1 Focal mechanism solutions of the 10 June 2022 Barkam MS5.8,MS6.0 events and some MS≥3.5 aftershocks
发震时间
年-月-日 时:分MW M 节面Ⅰ 节面Ⅱ 最佳拟合
深度/km走向/° 倾角/° 滑动角/° 走向/° 倾角/° 滑动角/° 2 022-06-10 00:03 5.3 5.8 324 76 0 234 90 166 7 2 022-06-10 01:28 5.79 6.0 329 90 −3 59 87 −180 6 2 022-06-10 03:27 5.2 251 84 −175 160 85 −6 2 022-06-10 04:37 4.46 4.4 339 76 0 249 90 166 6 2 022-06-10 04:54 3.98 3.9 155 84 9 64 81 174 8 2 022-06-14 18:11 4.38 4.4 149 87 22 58 68 177 5 注:由于6月10日3时27分发生的MS5.2地震存在波形叠加现象,因此选用HASH方法求取该地震震源机制解,该方法无法求取震源深度及矩震级。
下载: 导出CSV
Table 2 List of seismic parameters and results used in different stages
Stage Time period MC Number of events
with M≥MCa b Mmax p Ⅰ 2 022-06-10 00:03−01:03 2.1 69 3.1 0.61±0.10 5.0 0.76 Ⅱ 2 022-06-10 01:27−02:27 2.3 57 3.6 0.84±0.34 4.2 1.81 Ⅲ 2 022-06-10 03:27−04:27 1.7 66 3.2 0.86±0.10 3.7 1.64
下载: 导出CSV
表 2 不同阶段计算所用的地震参数及结果列表
Table 2 List of seismic parameters and results used in different stages
时间段 MC M≥MC地震次数 a b Mmax p 第 Ⅰ 阶段 2 022-06-10 00:03—01:03 2.1 69 3.1 0.61±0.10 5.0 0.76 第 Ⅱ 阶段 2 022-06-10 01:27—02:27 2.3 57 3.6 0.84±0.34 4.2 1.81 第 Ⅲ 阶段 2 022-06-10 03:27—04:27 1.7 66 3.2 0.86±0.10 3.7 1.64 注:MC为最小完整性震级,a为地震活动率,b为地震频率随震级增加的衰减率,p为余震频度衰减系。
下载: 导出CSV
-
陈长云,任金卫,孟国杰,杨攀新,熊仁伟,胡朝忠,苏小宁,苏建峰. 2013. 巴颜喀拉块体东部活动块体的划分、形变特征及构造意义[J]. 地球物理学报,56(12):4125–4141. doi: 10.6038/cjg20131217 Chen C Y,Ren J W,Meng G J,Yang P X,Xiong R W,Hu C Z,Su X N,Su J F. 2013. Division,deformation and tectonic implication of active blocks in the eastern segment of Bayan Har block[J]. Chinese Journal of Geophysics,56(12):4125–4141 (in Chinese).
杜明甫. 2020. 阿坝地区小震精定位及其活动构造意义[D]. 成都:成都理工大学:46−47. Du M F. 2020. Location of Small Seismic Essence in Aba Area and Its Active Structural Significance[D]. Chengdu:Chengdu University of Technology:46−47 (in Chinese).
冯建刚,张辉,杨萍. 2016. 2013年岷县漳县6.6级地震前地震b值异常特征研究[J]. 地震,36(1):32–37. doi: 10.3969/j.issn.1000-3274.2016.01.004 Feng J G,Zhang H,Yang P. 2016. Anomalies of b-value changes before the 2013 Minxian-Zhangxian MS6.6 earthquake[J]. Earthquake,36(1):32–37 (in Chinese).
龚宇,何玉林,伍先国. 1995. 抚边河断裂新活动特征的探讨[J]. 四川地震,(4):31–36. Gong Y,He Y L,Wu X G. 1995. Discussion on the recent active feature of the Fubianhe fault[J]. Earthquake Research in Sichuan,(4):31–36 (in Chinese).
宫悦,王宇玺,梁明剑,龙锋,赵敏. 2020. 2019年四川长宁6.0级地震序列时空演化特征及其地震构造环境研究[J]. 地震,40(4):90–102. doi: 10.12196/j.issn.1000-3274.2020.04.007 Gong Y,Wang Y X,Liang M J,Long F,Zhao M. 2020. Study on the spatio-temporal evolution characteristics and seismic structure environment of the 2019 M6.0 Changning Sichuan earthquake sequence[J]. Earthquake,40(4):90–102 (in Chinese).
姜丛,蒋长胜,尹凤玲,张延保,毕金孟,龙锋,司政亚,尹欣欣. 2021. 基于数据驱动的时间序列b值计算新方法(TbDD):以2021年云南漾濞MS6.4地震序列为例[J]. 地球物理学报,64(9):3126–3134. doi: 10.6038/cjg2021P0385 Jiang C,Jiang C S,Yin F L,Zhang Y B,Bi J M,Long F,Si Z Y,Yin X X. 2021. A new method for calculating b-value of time sequence based on data-driven (TbDD):A case study of the 2021 Yangbi MS6.4 earthquake sequence in Yunnan[J]. Chinese Journal of Geophysics,64(9):3126–3134 (in Chinese).
蒋长胜,吴忠良,庄建仓. 2013. 地震的“序列归属”问题与ETAS模型:以唐山序列为例[J]. 地球物理学报,56(9):2971–2981. Jiang C S,Wu Z L,Zhuang J C. 2013. ETAS model applied to the Earthquake-Sequence Association (ESA) problem:The Tangshan sequence[J]. Chinese Journal of Geophysics,56(9):2971–2981 (in Chinese).
蒋海昆,曲延军,李永莉,郑建常,华爱军,代磊,侯海峰. 2006. 中国大陆中强地震余震序列的部分统计特征[J]. 地球物理学报,49(4):1110–1117. doi: 10.3321/j.issn:0001-5733.2006.04.024 Jiang H K,Qu Y J,Li Y L,Zheng J C,Hua A J,Dai L,Hou H F. 2006. Some statistic features of aftershock sequences in Chinese mainland[J]. Chinese Journal of Geophysics,49(4):1110–1117 (in Chinese).
李陈侠,袁道阳,杨虎,徐锡伟. 2016. 东昆仑断裂带东段分支断裂—阿万仓断裂晚第四纪构造活动特征[J]. 地震地质,38(1):44–64. doi: 10.3969/j.issn.0253-4967.2016.01.004 Li C X,Yuan D Y,Yang H,Xu X W. 2016. The tectonic activity characteristics of Awancang fault in the Late Quaternary,the sub-strand of the eastern Kunlun fault[J]. Seismology and Geology,38(1):44–64 (in Chinese).
梁明剑,周荣军,闫亮,赵国华,郭红梅. 2014. 青海达日断裂中段构造活动与地貌发育的响应关系探讨[J]. 地震地质,36(1):28–38. doi: 10.3969/j.issn.0253-4967.2014.01.003 Liang M J,Zhou R J,Yan L,Zhao G H,Guo H M. 2014. The relationships between neotectonic activity of the middle segment of Dari fault and its geomorphological response,Qinghai Province,China[J]. Seismology and Geology,36(1):28–38 (in Chinese).
梁明剑,杨耀,杜方,宫悦,孙玮,赵敏,何强. 2020. 青海达日断裂中段晚第四纪活动性与1947年M7¾地震地表破裂带再研究[J]. 地震地质,42(3):703–714. Liang M J,Yang Y,Du F,Gong Y,Sun W,Zhao M,He Q. 2020. Late Quaternary activity of the central segment of the Dari fault and restudy of the surface rupture zone of the 1947 M7¾ Dari earthquake,Qinghai Province[J]. Seismology and Geology,42(3):703–714 (in Chinese).
梁明剑,黄飞鹏,孙凯,张会平,吴微微,张佳伟,杜方,周文英. 2022. 巴颜喀拉块体内部五道梁—长沙贡玛断裂中段全新世活动及最新古地震证据[J]. 地球科学,47(3):766–778. Liang M J,Huang F P,Sun K,Zhang H P,Wu W W,Zhang J W,Du F,Zhou W Y. 2022. The Holocene activity and its evidence from paleoearthquake of the middle segment of Wudaoliang-Changshagongma fault inside the Bayan Har block[J]. Earth Science,47(3):766–778 (in Chinese).
刘维亮. 2006. 大渡河金川水电站区域地壳稳定性评价[D]. 成都:成都理工大学:29−30. Liu W L. 2006. Regional Custal Stability Assessment in Dadu River Jinchuan Hydropower Station[D]. Chengdu:Chengdu University of Technology:29−30 (in Chinese).
龙锋,闻学泽,倪四道. 2009. 区域最小完整性震级时空分布的确定:以龙门山断裂带为例[J]. 地震,29(3):27–36. Long F,Wen X Z,Ni S D. 2009. Determination of temporal-spatial distribution of the regional minimum magnitudes of completeness:Application to the Longmenshan fault zone[J]. Earthquake,29(3):27–36 (in Chinese).
龙锋,蒋长胜,冯建刚,唐兰兰. 2012. 历史大地震破裂区地震危险性的地震活动性定量分析:以南北地震带中北段为例[J]. 地震,32(3):98–108. doi: 10.3969/j.issn.1000-3274.2012.03.011 Long F,Jiang C S,Feng J G,Tang L L. 2012. Quantitative seismicity analysis for the risk of historical large earthquake rupture zones:Applied to the mid-north segment of the South-North Seismic Belt[J]. Earthquake,32(3):98–108 (in Chinese).
龙锋,祁玉萍,赵敏,芮雪莲. 2021. 一种基于模板匹配的震相关联和提取技术及其初步应用[J]. 中国地震,37(2):368–378. doi: 10.3969/j.issn.1001-4683.2021.02.010 Long F,Qi Y P,Zhao M,Rui X L. 2021. A template-matching based process and its preliminary application on seismic phase association and extraction[J]. Earthquake Research in China,37(2):368–378 (in Chinese).
孙东,王道永,吴德超,赵德军,黄晨. 2010. 马尔康巴拉水电站近场区主要断裂活动性及对工程的影响[J]. 工程地质学报,18(6):940–949. Sun D,Wang D Y,Wu D C,Zhao D J,Huang C. 2010. Activity and effect of main faults in near field of Bala hydropower station in Maerkang[J]. Journal of Engineering Geology,18(6):940–949 (in Chinese).
王椿镛,韩渭宾,吴建平,楼海,白志明. 2003. 松潘—甘孜造山带地壳速度结构[J]. 地震学报,25(3):229–241. Wang C Y,Han W B,Wu J P,Lou H,Bai Z M. 2003. Crustal structure beneath the Songpan-Garze orogenic belt[J]. Acta Seismologica Sinica,25(3):229–241 (in Chinese).
闻学泽. 2018. 巴颜喀拉块体东边界千年破裂历史与2008年汶川、2013年芦山和2017年九寨沟地震[J]. 地震学报,40(3):255–267. doi: 10.11939/jass.20170211 Wen X Z. 2018. The 2008 Wenchuan,2013 Lushan and 2017 Jiuzhaigou earthquakes,Sichuan,in the last more than one thousand years of rupture history of the eastern margin of the Bayan Har block[J]. Acta Seismologica Sinica,40(3):255–267 (in Chinese).
熊仁伟,任金卫,张军龙,杨攀新,李智敏,胡朝忠,陈长云. 2010. 玛多—甘德断裂甘德段晚第四纪活动特征[J]. 地震,30(4):65–73. doi: 10.3969/j.issn.1000-3274.2010.04.008 Xiong R W,Ren J W,Zhang J L,Yang P X,Li Z M,Hu C Z,Chen C Y. 2010. Late Quaternary active characteristics of the Gande segment in the Maduo-Gande fault zone[J]. Earthquake,30(4):65–73 (in Chinese).
徐锡伟,闻学泽,陈桂华,于贵华. 2008. 巴颜喀拉地块东部龙日坝断裂带的发现及其大地构造意义[J]. 中国科学:D辑,38(5):529–542. Xu X W,Wen X Z,Chen G H,Yu G H. 2008. Discovery of the Longriba fault zone in eastern Bayan Har block,China and its tectonic implication[J]. Science in China:Series D,51(9):1209–1223. doi: 10.1007/s11430-008-0097-1
徐锡伟,韩竹军,杨晓平,张世民,于贵华,周本刚,李峰,马保起,陈桂华,冉勇康. 2016. 中国及邻近地区地震构造图[M].北京:地震出版社:1−64. Xu X W,Han Z J,Yang X P,Zhang S M,Yu G H,Zhou B G,Li F,Ma B Q,Chen G H,Ran Y K. 2016. Seismotectonic Map in China and Its Adjacent Regions[M]. Beijing:Seismological Press:1−64 (in Chinese).
易桂喜,闻学泽,王思维,龙锋,范军. 2006. 由地震活动参数分析龙门山—岷山断裂带的现今活动习性与强震危险性[J]. 中国地震,22(2):117–125. doi: 10.3969/j.issn.1001-4683.2006.02.001 Yi G X,Wen X Z,Wang S W,Long F,Fan J. 2006. Study on fault sliding behaviors and strong-earthquake risk of the Longmenshan-Minshan fault zones from current seismicity parameters[J]. Earthquake Research in China,22(2):117–125 (in Chinese).
易桂喜,闻学泽,辛华,乔慧珍,王思维,宫悦. 2013. 龙门山断裂带南段应力状态与强震危险性研究[J]. 地球物理学报,56(4):1112–1120. Yi G X,Wen X Z,Xin H,Qiao H Z,Wang S W,Gong Y. 2013. Stress state and major-earthquake risk on the southern segment of the Longmen Shan fault zone[J]. Chinese Journal of Geophysics,56(4):1112–1120 (in Chinese).
詹艳,梁明剑,孙翔宇,黄飞鹏,赵凌强,宫悦,韩静,李陈侠,张培震,张会平. 2021. 2021年5月22日青海玛多MS7.4地震深部环境及发震构造模式[J]. 地球物理学报,64(7):2232–2252. doi: 10.6038/cjg2021O0521 Zhan Y,Liang M J,Sun X Y,Huang F P,Zhao L Q,Gong Y,Han J,Li C X,Zhang P Z,Zhang H P. 2021. Deep structure and seismogenic pattern of the 2021. 5.22 Madoi (Qinghai) MS7.4 earthquake[J]. Chinese Journal of Geophysics, 64 (7):2232−2252 (in Chinese).
张培震,邓起东,张国民,马瑾,甘卫军,闵伟,毛凤英,王琪. 2003. 中国大陆的强震活动与活动地块[J]. 中国科学:D辑,33(增刊):12–20. Zhang P Z,Deng Q D,Zhang G M,Ma J,Gan W J,Min W,Mao F Y,Wang Q. 2003. Active tectonic blocks and strong earthquakes in the continent of China[J]. Science in China:Series D,46(S2):13–24. doi: 10.1360/03dz0002
中国地震局监测预报司. 2007. 中国大陆地震序列研究:“十五”中国地震预报科技攻关成果系列丛书[M]. 北京:地震出版社:34−56. Department of Monitoring and Forecasting,China Earthquake Administration. 2007. Research on Mainland China Earthquake Sequence:Series of Achievements in China Earthquake Forecasting Science and Technology During the Tenth Five-Year Plan[M]. Beijing:Seismological Press:34−56 (in Chinese).
Aki K. 1965. Maximum likelihood estimate of b in the formula logN=a−bM and its confidence limits[J]. Bull Earthq Res Inst,Univ Tokyo, 43 (2):237−239.
Dieterich J H,Kilgore B. 1996. Implications of fault constitutive properties for earthquake prediction[J]. Proc Natl Acad Sci USA,93(9):3787–3794. doi: 10.1073/pnas.93.9.3787
Gutenberg B,Richter C F. 1944. Frequency of earthquakes in California[J]. Bull Seismol Soc Am,34(4):185–188. doi: 10.1785/BSSA0340040185
Iwata T. 2008. Low detection capability of global earthquakes after the occurrence of large earthquakes:Investigation of the Harvard CMT catalogue[J]. Geophys J Int,174(3):849–856. doi: 10.1111/j.1365-246X.2008.03864.x
Kagan Y Y. 2011. Random stress and Omori’s law[J]. Geophys J Int,186(3):1347–1364. doi: 10.1111/j.1365-246X.2011.05114.x
Laura G,Stefan W. 2019. Real-time discrimination of earthquake foreshocks and aftershocks[J]. Nature,574(7777):193–199. doi: 10.1038/s41586-019-1606-4
Long F,Wen X Z,Ruan X,Zhao M,Yi G X. 2015. A more accurate relocation of the 2013 MS7.0 Lushan,Sichuan,China,earthquake sequence,and the seismogenic structure analysis[J]. J Seismol,19(3):653–665. doi: 10.1007/s10950-015-9485-0
Long F,He C,Yi G X,He X H,Li L,Shi F Q,Gong Y,Peng L Y. 2023. Seismogenic structures and spatiotemporal seismicity patterns of the 2022 MS6.0 Maerkang earthquake sequence,Sichuan,China[J]. Front Earth Sci,10:1049911. doi: 10.3389/feart.2022.1049911
Moreno Y,Correig A M,Gómez J B,Pacheco A F. 2001. A model for complex aftershock sequences[J]. J Geophys Res:Solid Earth,106(B4):6609–6619. doi: 10.1029/2000JB900396
Omori F. 1921. Investigation of the Shinano-Omachi earthquake of 1918[J]. Rep Imp Earthq Invest Common,24:16–69.
Peng Z G,Vidale J E,Houston H. 2006. Anomalous early aftershock decay rate of the 2004 MW6.0 Parkfield,California,earthquake[J]. Geophys Res Lett,33(17):L17307.
Perfettini H,Avouac J P. 2004. Postseismic relaxation driven by brittle creep:A possible mechanism to reconcile geodetic measurements and the decay rate of aftershocks,application to the Chi-Chi earthquake,Taiwan[J]. J Geophys Res:Solid Earth,109(B2):B02304.
Popov V L. 2010. Contact Mechanics and Friction[M]. Berlin:Springer:117−136.
Reasenberg P A. 1999. Foreshock occurrence before large earthquakes[J]. J Geophys Res:Solid Earth,104(B3):4755–4768. doi: 10.1029/1998JB900089
Scholz C H. 1968. The frequency-magnitude relation of microfracturing in rock and its relation to earthquakes[J]. Bull Seismol Soc Am,58(1):399–415. doi: 10.1785/BSSA0580010399
Schorlemmer D,Wiemer S,Wyss M. 2005. Variations in earthquake-size distribution across different stress regimes[J]. Nature,437(7058):539–542. doi: 10.1038/nature04094
Shcherbakov R,Turcotte D L,Rundle J B. 2004. A generalized Omori’s law for earthquake aftershock decay[J]. Geophys Res Lett,31(11):L11613.
Utsu T. 1961. A statistical study on the occurrence of aftershocks[J]. Geophys Mag,30(4):521–605.
Wang R,Chang Y,Han P,Miao M,Zeng Z Y,Shi H X,Li D N,Liu L F,Su Y J. 2023. Optimized traffic light system with AIC and application to the 2021 M6.7 Yangbi earthquake sequence[J]. Entropy,25(5):759. doi: 10.3390/e25050759
Wiemer S,Wyss M. 1997. Mapping the frequency-magnitude distribution in asperities:An improved technique to calculate recurrence times?[J]. J Geophys Res:Solid Earth,1021(B7):15115–15128.
Wiemer S,Wyss M. 2000. Minimum magnitude of completeness in earthquake catalogs:Examples from Alaska,the western United States,and Japan[J]. Bull Seismol Soc Am,90(4):859–869. doi: 10.1785/0119990114
Wiemer S. 2001. A software package to analyze seismicity:ZMAP[J]. Seismol Res Lett,72(3):373–382. doi: 10.1785/gssrl.72.3.373
Zhao L S,Helmberger D V. 1994. Source estimation from broadband regional seismograms[J]. Bull Seismol Soc Am,84(1):91–104.
Zhu L P,Helmberger D V. 1996. Advancement in source estimation techniques using broadband regional seismograms[J]. Bull Seismol Soc Am,86(5):1634–1641. doi: 10.1785/BSSA0860051634
Zuñiga F R,Wyss M. 2001. Most and least-likely locations of large to great earthquakes along the Pacific coast of Mexico estimated from local recurrence times based on b-values[J]. Bull Seismol Soc Am,91(6):1717–1728. doi: 10.1785/0120000303
-
期刊类型引用(4)
1. 孙云强,邱鑫鹏,陈常勇,赵卓,林君祺,龚炜程. GNSS和InSAR约束的2023积石山M_S6.2地震同震滑动分布. 地震工程学报. 2024(04): 867-879 .  百度学术
百度学术
2. 黎朕灵,金明培,缪素秋. 2021年云南漾濞M_S6.4地震同震位移场和震源滑动模型反演. 地震研究. 2021(03): 330-337 . 百度学术
3. 云烨,吕孝雷,付希凯,薛飞扬. 星载InSAR技术在地质灾害监测领域的应用. 雷达学报. 2020(01): 73-85 . 百度学术
4. 武晔,万永革,武巴特尔,石砚斌. 数字信号处理课程“地震数据重采样”综合性实验设计. 实验室研究与探索. 2018(02): 178-182+192 . 百度学术
其他类型引用(3)


计量
- 文章访问数: 234
- HTML全文浏览量: 60
- PDF下载量: 63
- 被引次数: 7
