

Precise earthquake relocation of double seismic zone beneath Tohoku region in Japan
-
摘要: 日本所在的西太平洋地区是世界上中深源地震发生最为频繁的地区. 早期研究已表明, 日本东北地区下方的中深源地震呈双层分布. 为进一步分析该双震带的空间分布特征, 本文通过方法测试证明了采用球坐标系下的三维射线追踪法改进后的双差定位法进行地震重定位的精确性和有效性, 对使用该方法进行重定位前、 后各方向上的误差进行了分析, 并确定了最佳的定位参数. 在此基础上, 对日本东北地区的中深源地震进行了高精度重定位, 并对重定位得到的震源位置进行了空间拟合, 其结果表明地震呈明显的双层分布, 且与西太平洋俯冲板块几近平行. 本文研究结果对揭示双震带中地震的发震机理以及俯冲板块内的精细结构均具有重要意义.Abstract: Japan is located in western Pacific, where the intermediate-deep earthquakes occur frequently. Early researches indicate that the intermediate-deep earthquakes beneath Tohoku region in Japan constitute a double seismic zone. In order to analyze the spatial distribution characteristics of the double seismic zone in Tohoku region, we use a method test to show the precision and validity of the double-difference location algorithm, which has been improved by 3-D ray tracing method in spherical coordinate system. We analyse the errors before and after relocation along different directions, and determine the most suitable parameters for relocation. Then we obtain the precise relocated earthquakes in the double seismic zone beneath Tohoku region, and fit the relocated hypocenters in three-dimensional space. The relocation results of intermediate-deep earthquakes in Tohoku region indicate that the earthquakes in the seismic zone are distributed obviously in double layers, which are approximately parallel to the subducting western Pacific Plate. The results of this paper are significant to reveal the mechanisms of earthquakes in double seismic zone and the fine structures in the deep subduction zones.
-
-
![]()
图 1 日本地震台站(黄色正方形)分布图
Figure 1. Distribution of seismic stations (yellow squares) in Japan
![]()
图 2 本文所用地震事件(红色圆圈)的震中平面分布图
Figure 2. Horizontal distribution of epicenters (red circles) used in this study
![]()
图 3 方法测试中重定位前、 后误差的对比 (a) 总误差; (b) 纬度方向误差; (c) 经度方向误差; (d) 深度方向误差 黑色点线表示重定位前误差, 红色点线表示重定位后误差
Figure 3. Comparison of errors before relocation with those after relocation in method test (a) Total errors; (b) Errors along latitude direction; (c) Errors along longitude direction; (d) Errors along depth direction. The black and red dotted lines represent the errors before and after relocation, respectively
![]()
图 4 方法测试中重定位前(上)、 后(下)的误差分布对比 (a) 总误差; (b) 纬度方向误差; (c) 经度方向误差; (d) 深度方向误差
Figure 4. Comparison of errors before relocation (upper panels) with those after relocation (lower panels) in method test (a) Total errors; (b) Errors along latitude direction; (c) Errors along longitude direction; (d) Errors along depth direction
![]()
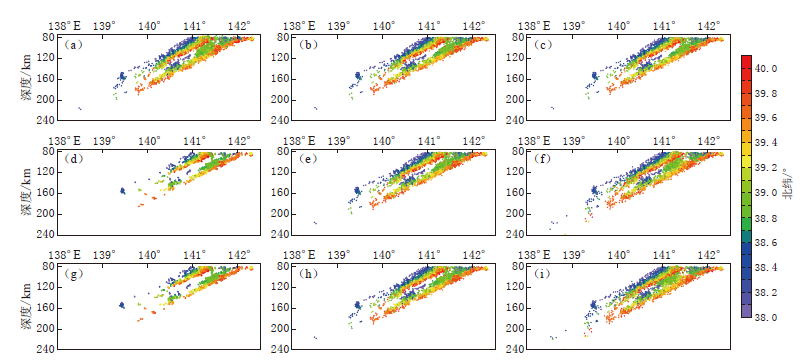
图 5 采用不同迭代次数i, 最大成对距离smax和阻尼系数d所得到的重定位后的震源位置剖面投影图 (a) i=1, smax=5 km, d=5; (b) i=1, smax=5 km, d=50; (c) i=1, smax=5 km, d=100; (d) i=2, smax=2 km, d=50; (e) i=2, smax=5 km, d=50; (f) i=2, smax=8 km, d=50; (g) i=3, smax=2 km, d=50; (h) i=3, smax=5 km, d=50; (i) i=3, smax=8 km, d=50
Figure 5. Projections of relocated epicenters using different iteration i, maximum pairwise distance smax and damping coefficient d (a) i=1, smax=5 km, d=5; (b) i=1, smax=5 km, d=50; (c) i=1, smax=5 km, d=100; (d) i=2, smax=2 km, d=50; (e) i=2, smax=5 km, d=50; (f) i=2, smax=8 km, d=50; (g) i=3, smax=2 km, d=50; (h) i=3, smax=5 km, d=50; (i) i=3, smax=8 km, d=50
![]()
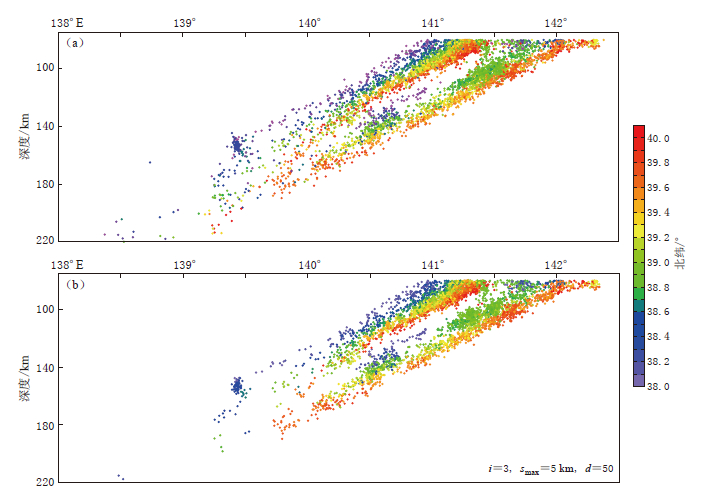
图 6 重定位前(a)、 后(b)震源位置剖面投影图
Figure 6. Projections of epicenters before (a) and after (b) relocation
![]()
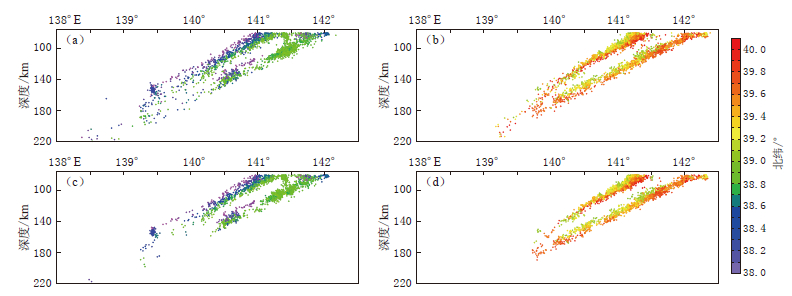
图 7 不同纬度范围内重定位前、 后震源位置剖面投影图 (a) 重定位前, 纬度为38°N—39°N; (b) 重定位前, 纬度为39°N—40°N;(c) 重定位后, 纬度为38°N—39°N; (d) 重定位后, 纬度为39°N—40°N
Figure 7. Projections of epicenters of different latitude ranges before and after relocation (a) Before relocation, latitude range is 38°N--39°N; (b) Before relocation, latitude range is 39°N--40°N; (c) After relocation, latitude range is 38°N--39°N; (d) After relocation, latitude range is 39°N--40°N
![]()
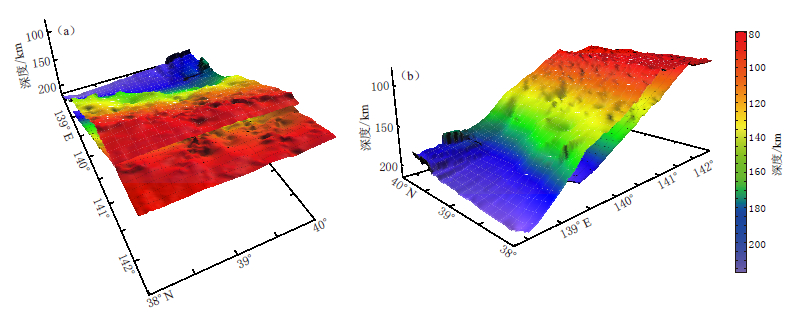
图 8 由重定位结果拟合的双震带空间形态图 (a) 从东南方向上方观察; (b) 从西南方向下方观察
Figure 8. Spatial morphology of double seismic zone fitted by relocated results (a) Oblique view from above of southeast direction; (b) Oblique view from below of southwest direction
![]()
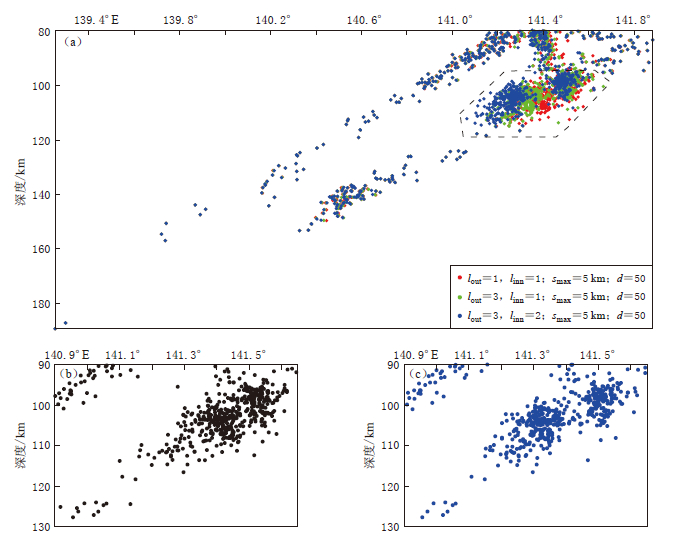
图 9 不同迭代次数下38.8°N—39°N范围内地震重定位结果的对比 (a) 不同迭代次数下38.8°N—39°N范围内所有地震重定位结果; (b) 重定位前 虚线框内震源分布; (c) 重定位后虚线框内震源分布
Figure 9. Comparison of earthquakes relocation results in 38.8°N--39°N with different iterations (a) Relocation results of all of the earthquakes in 38.8°N--39°N with different iterations; (b) Epicenters distribution before relocation in the dashed box; (c) Epicenters distribution after relocation in the dashed box
表 1 不同迭代次数i, 最大成对距离smax和阻尼系数d下的重定位后的均方根误差
Table 1 RMS errors of relocated results in different iteration i, maximum pairwise distance smax and damping coefficient d
i smax/km d RMS/km 3×1 2 50 7.0 3×1 5 45 4.3 3×2 5 45 4.3 3×1 5 50 4.3 3×1 5 100 5.1 3×2 5 50 4.1  下载: 导出CSV
-
Klein F W. 1978. Hypocenter Location Program Hypoinverse: Part Ⅰ. Users Guide to Versions 1, 2, 3, and 4. Part Ⅱ. Source Listings and Notes[R]. USGS Open-File Report: 78-694.
Yu X W, Zhang W B, Chen Y T. 2011. Seismic imaging and seismicity analysis in Beijing-Tianjin-Tangshan region[EB/OL]. [2015-04-15]. http://www.hindawi.com/journals/ijge/2011/216315/.
-
期刊类型引用(14)
1. 朱冰清,王伟涛,谢俊举,李志伟,姚新强,黄翔,卞真付,林逸. 利用近震Sp转换波到时和远震接收函数P波峰值延迟研究华北盆地浅部结构. 地球物理学报. 2024(06): 2172-2190 .  百度学术
百度学术
2. 王秋实,李永华,武岩. 使用接收函数自相关约束渤海湾北部沉积层结构. 地球物理学报. 2024(06): 2191-2203 . 百度学术
3. 张瑞青,况春利,张笑晗,李永华. 沉积层结构被动源探测方法及其在典型盆地的应用. 地球与行星物理论评(中英文). 2023(01): 12-26 . 百度学术
4. Jinkai An,Song Huang,Xiangyang Chen,Tao Xu,Zhiming Bai. Research progress in geophysical exploration of the Antarctic ice sheet. Earthquake Research Advances. 2023(03): 72-84 . 必应学术
5. 刘嘉栋,丁志峰,武岩,姜磊. 利用远震接收函数研究华北克拉通北部造山带地壳厚度及泊松比. 地震学报. 2022(03): 357-373 . 本站查看
6. 姜磊,丁志峰,高天扬,黄翔. 利用背景噪声和接收函数研究华北克拉通地壳结构. 地球物理学报. 2021(05): 1585-1596 . 百度学术
7. 王文才,杨晓鹏,苏小芸,陈丽君,王燕,刘红玫. 基于强震记录的唐山5.1级地震强地面运动特征及局部场地效应分析. 大地测量与地球动力学. 2021(10): 1063-1068 . 百度学术
8. 马海超,储日升,盛敏汉,危自根. 利用深源近震高频Ps转换波震相研究松辽盆地沉积层结构. 大地测量与地球动力学. 2020(02): 214-220 . 百度学术
9. 赵珊,刘华,蒋有录,王永诗,郝雪峰,张聪. 渤海湾盆地缓坡带类型及其油气分布特征. 石油与天然气地质. 2019(02): 223-235 . 百度学术
10. 齐玉妍,孙丽娜,吕国军,李慧. 2012年唐山4.8级地震强震动记录特征及场地相关特性分析. 地震. 2019(04): 172-180 . 百度学术
11. 邓莉,谭毅培,刘双庆,马婷,卞真付,曹井泉. 天津滨海爆炸事件检测与相对定位研究. 地震. 2018(03): 158-169 . 百度学术
12. 武岩,丁志峰,王兴臣,朱露培. 华北克拉通地壳结构及动力学机制分析. 地球物理学报. 2018(07): 2705-2718 . 百度学术
13. 余大新,耿冠世. 利用背景噪声估计华北地区场地放大效应. 地震工程学报. 2017(04): 719-724 . 百度学术
14. 高占永,张瑞青,吴庆举,张广成. 中国东北地区下方660km间断面研究. 地震学报. 2015(05): 711-721+885 . 本站查看
其他类型引用(12)


计量
- 文章访问数: 622
- HTML全文浏览量: 271
- PDF下载量: 27
- 被引次数: 26
