

Statistical characteristics of enhanced seismicity before strong earthquakes based on earthquake cases in Chinese mainland
-
摘要:
依据 《中国震例》 (1966—2017年)对1966年以来中国大陆东部MS>6.0、西部MS>7.0强震前地震活动增强的异常现象特征进行了系统的梳理,并试图总结不同活动构造地块周缘强震前地震活动增强的异常时空演化特征。结果显示:① 我国大陆大震前普遍存在地震活动增强现象,33个震例中有21个震例存在震前地震活动增强异常,占比达64%;② 西部地区大多数震例的地震活动增强空间范围表现为中间尺度或构造尺度,且主震震级越大,越有可能出现大范围的地震活动增强;③ 西部地区出现中强地震活动增强的概率高于东部地区,前兆地震活动增强的平均震级较大,发生大震(M>7.0)的概率增大;④ 西部地区地震活动增强的时间尺度与震级成正比,而东部地区随着震级增大,更可能出现中期到中短期的地震活动增强异常;⑤ 多数西部地区震例在震前出现不同时间尺度的地震活动增强叠加的现象;⑥ 川滇菱形地块的强震前均出现了中长期尺度的地震条带交会现象、不同空间尺度的地震空区以及中短期尺度的中小震活动增强现象,并且对大震地点有较好的指示意义。巴颜喀拉东边界与北、西及南边界大震前存在显著的不同地震活动增强特征,震前未出现中强地震围空的现象。
Abstract:Before strong earthquakes, enhanced seismicity manifested by increased magnitude, frequency, or accelerated strain release generally appears within a specific temporal and spatial range of the source area. This significant enhanced seismicity is often observed before moderate-strong earthquakes occurred in Chinese mainland or abroad. The seismogenic processes of large earthquakes are multiscale and diverse, involving localization of deformation, fault heterogeneities, and variable local loading rate effects. Enhanced seismicity prior to moderate-strong earthquakes is closely related to such processes and exhibits different characteristics. An in-depth study of enhanced seismicity will help us to understand the seismogenic process of strong-large shocks, which may bring positive effect on predicting strong shocks based on them.
Many studies have been performed to analyze the characteristics of enhanced seismicity. A more thoughtful and systematic study is needed due to rapidly increased strong earthquake data in Chinese mainland and the urgent requirement for statistical predictive indicators. In this study, we intend to summarize the statistical characteristics of the prominent enhanced seismicities before moderate-strong earthquakes and attempt to seek the proper mechanism. Based on Earthquake Cases in China (1966−2017), the spatio-temporal characteristics of the seismicity before strong earthquakes with magnitude MS≥6.0 in the eastern Chinese mainland and MS≥7.0 in the western Chinese mainland are summarized statistically. In the meantime, the regional features of enhanced seismicity before the strong earthquakes within the SichuanYunnan rhombic block, Bayan Har block, and North China block are also studied. The main contents and conclusions are as follows:
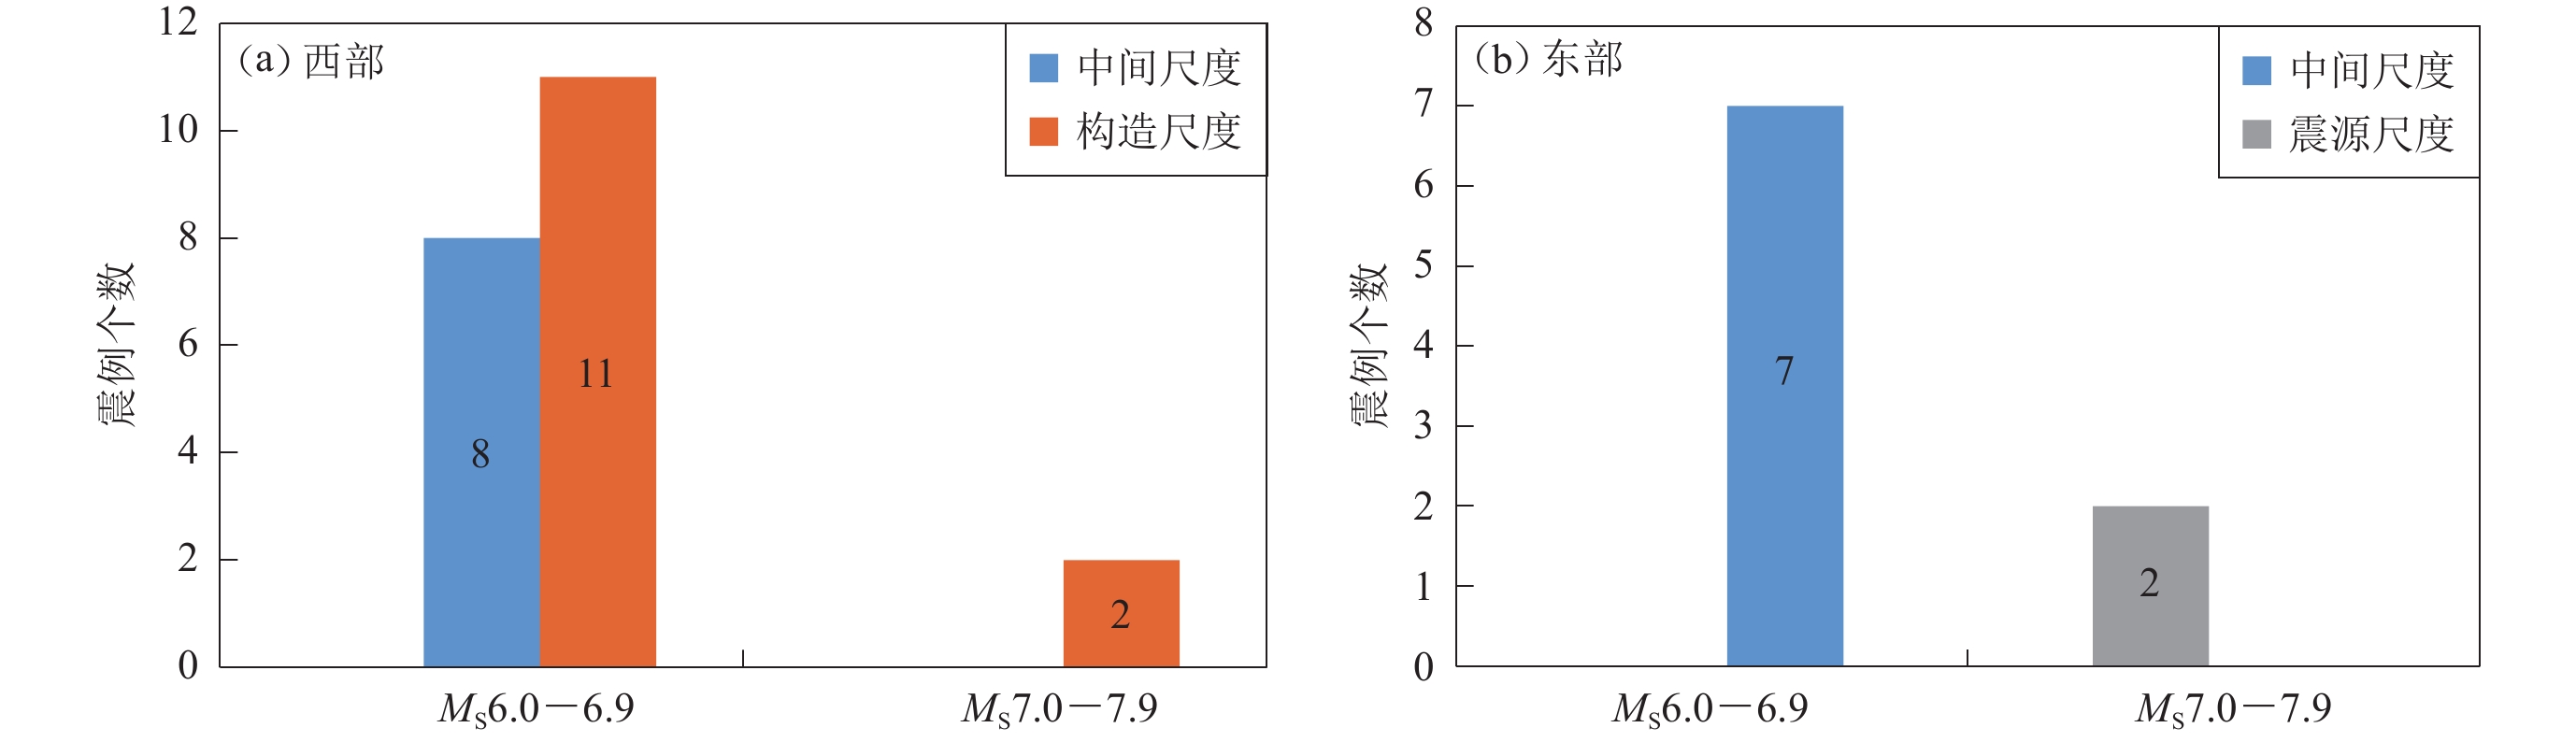
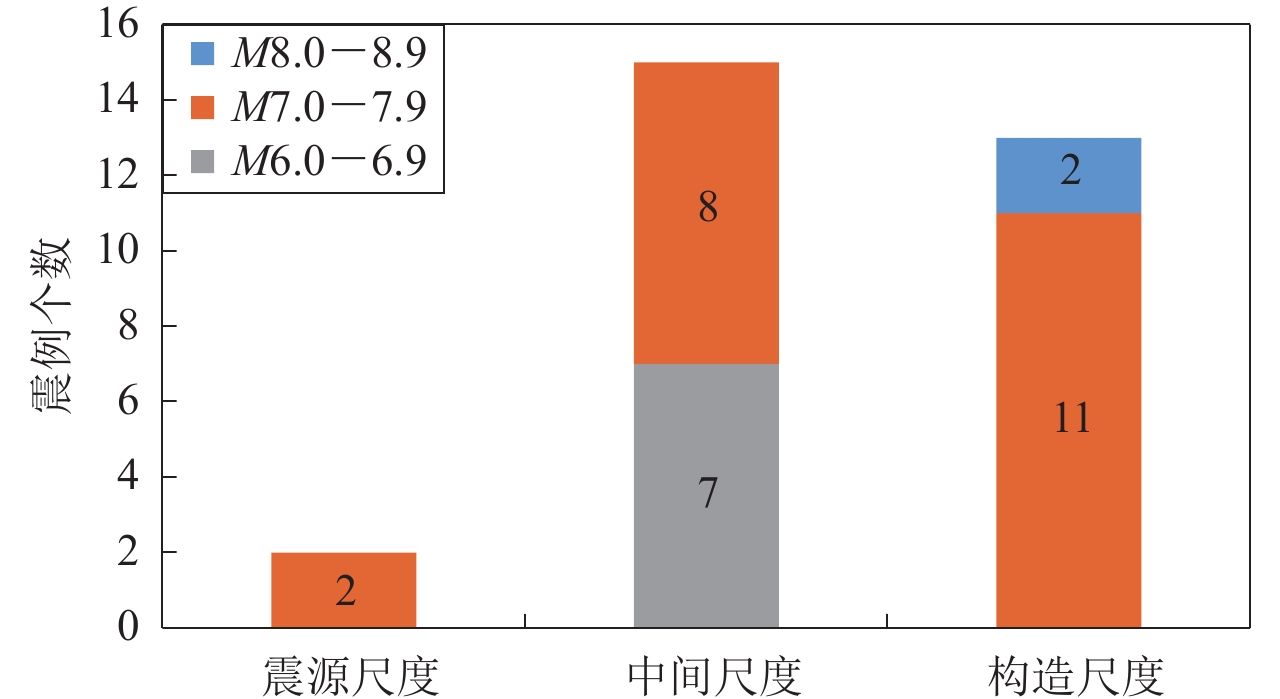
Among the 33 earthquake cases studied in this paper, 21 showed enhanced seismicity before the main shock, accounting for 64%, including five earthquakes of MS6.0−6.9, 14 earthquakes of MS7.0−7.9, and two earthquakes of MS8.0 or above. The percentage of enhanced seismicity is 42% for sub-grade class from MS6.0 to MS6.9, 74% for for sub-grade class from MS7.0 to MS7.9 and 100% for sub-grade class from MS8.0 or above. The possibility of the occurrence of enhanced seismic activity will increase with the magnitude of the main shock. The enhancement of seismicity appeared in 13 out of 18 cases in western Chinese mainland, accounting for 72%; 8 out of 15 cases in eastern Chinese mainland, accounts for 53%.
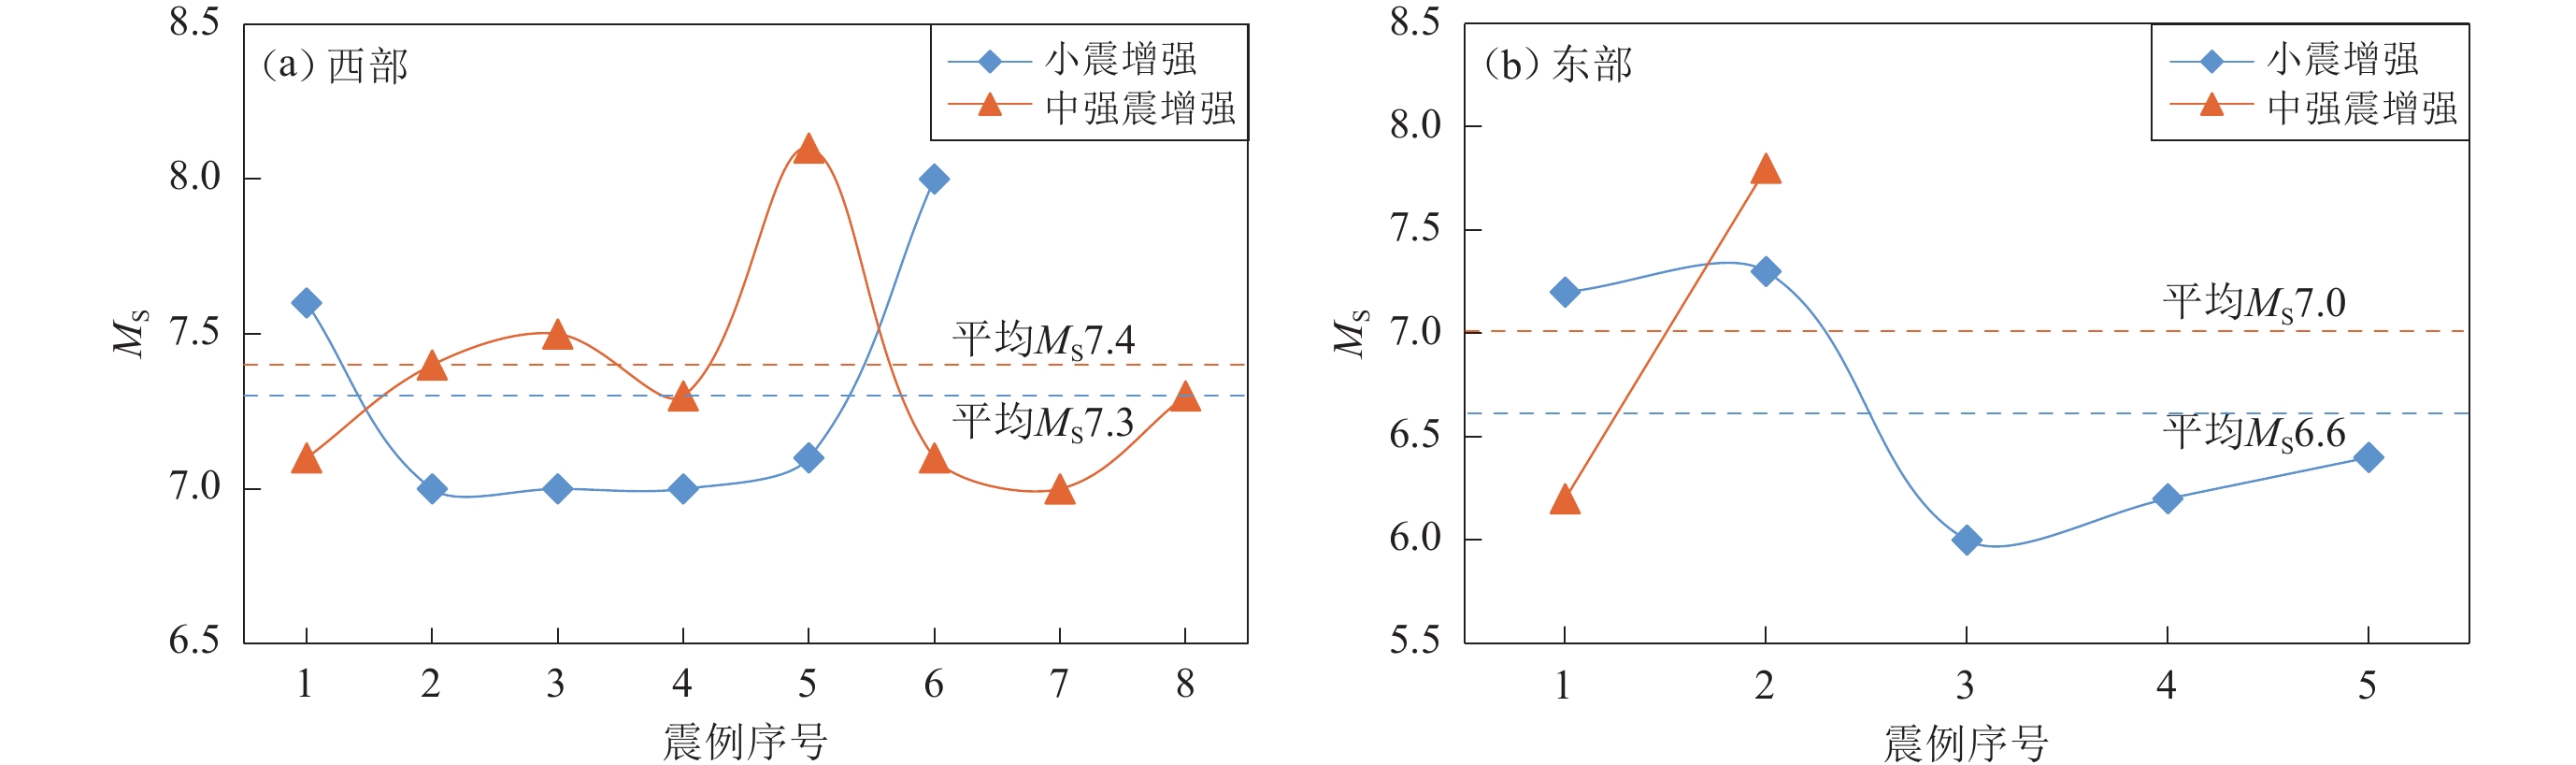
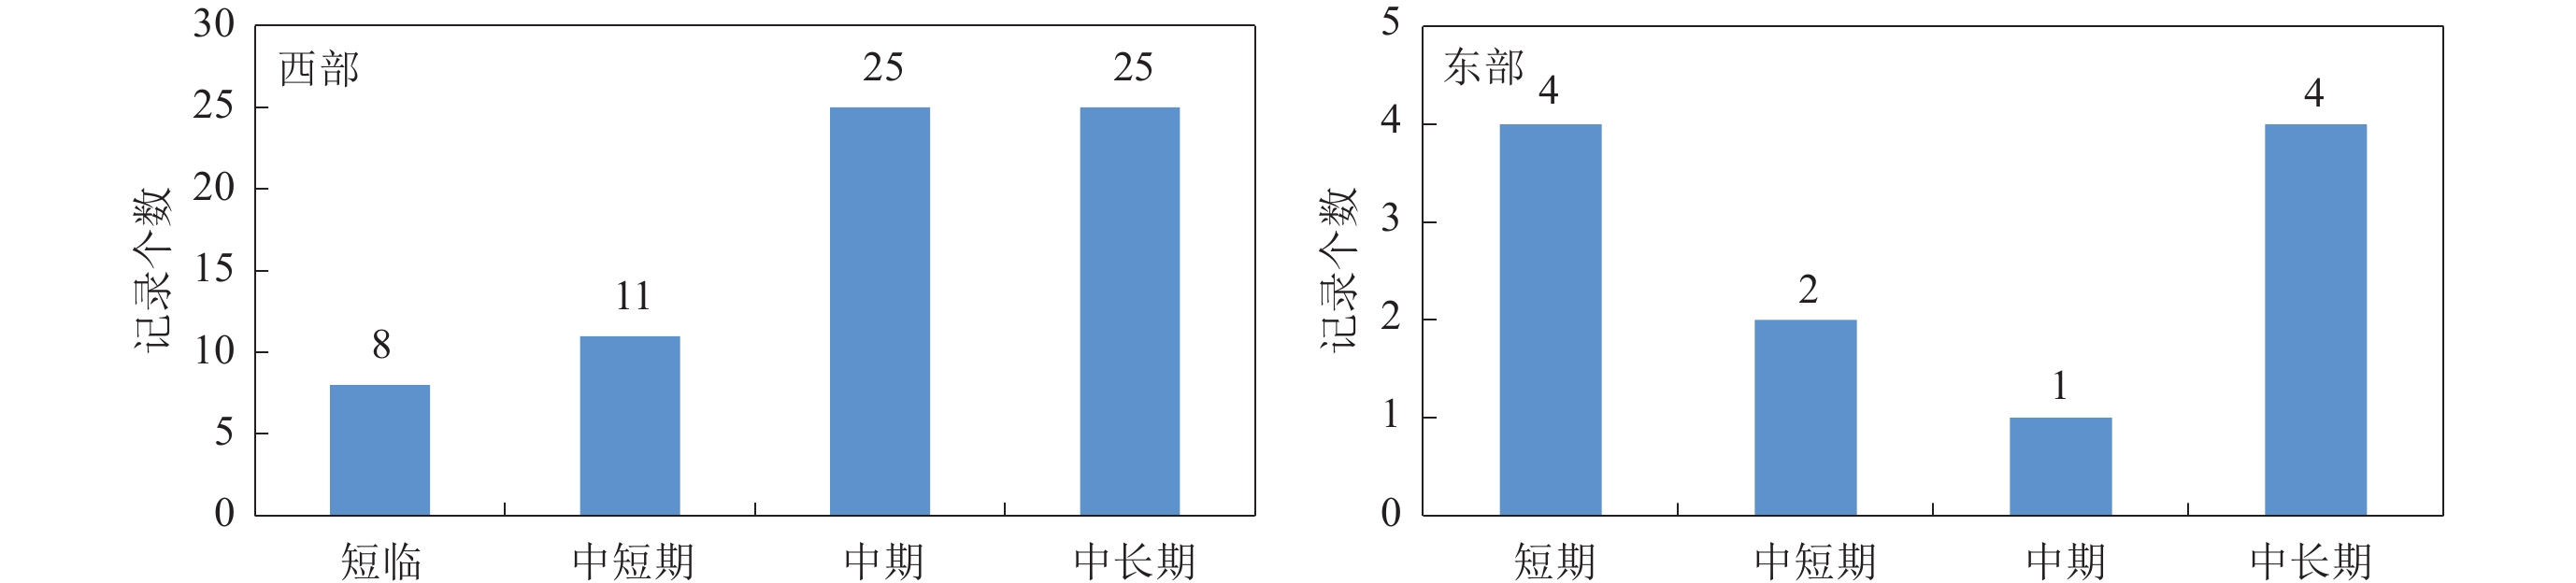
Secondly, in most cases for western Chinese mainland, the spatial extent of enhanced seismicities was observed within the intermediate or tectonic scale, and the probability of enhanced seismicity with a significant spatial scale increases with the magnitude of the main shock. Furthermore, the likelihood of enhanced seismicity with a large magnitude in western Chinese mainland is higher than in eastern Chinese mainland. The larger the average magnitude of enhanced premonitory seismicity, the more likely strong earthquakes with MS>7.0 occur. The duration of seismic activity enhancement in the western Chinese mainland is directly proportional to magnitude of the main shock, while in the eastern Chinese mainland, the relatively more significant events tend to be associated with a mid-short-term enhanced seismicity.
Thirdly, the strong earthquakes in Sichuan-Yunnan rhombic block were preceded by the medium-long term intersected seismic strips, the various spatial-scale seismic gaps, and the enhancement of small-moderate earthquakes at medium-short-term scales. These features significantly indicate the location of further quakes, which deserves more attention. Different from the eastern border of the Bayan Har block, at the other three boundaries of the Bayan Har block, strong earthquakes are often attacked with seismic gaps encircled by premonitory medium-strong earthquakes. The seismic gap generally arises in medium-long-term time scales, and the mid-short-term scale enhanced seismicity is notable before strong earthquakes in the northern margin of North China block. In particular, the magnitude of the Haicheng earthquake is comparable to that of the Tangshan earthquake. Still, the Haicheng earthquake was not preceded by a significant and long seismicity enhancement, which suggests that the secondary blocks or adjacent tectonic influences may also control the enhancement of seismicity before earthquake.
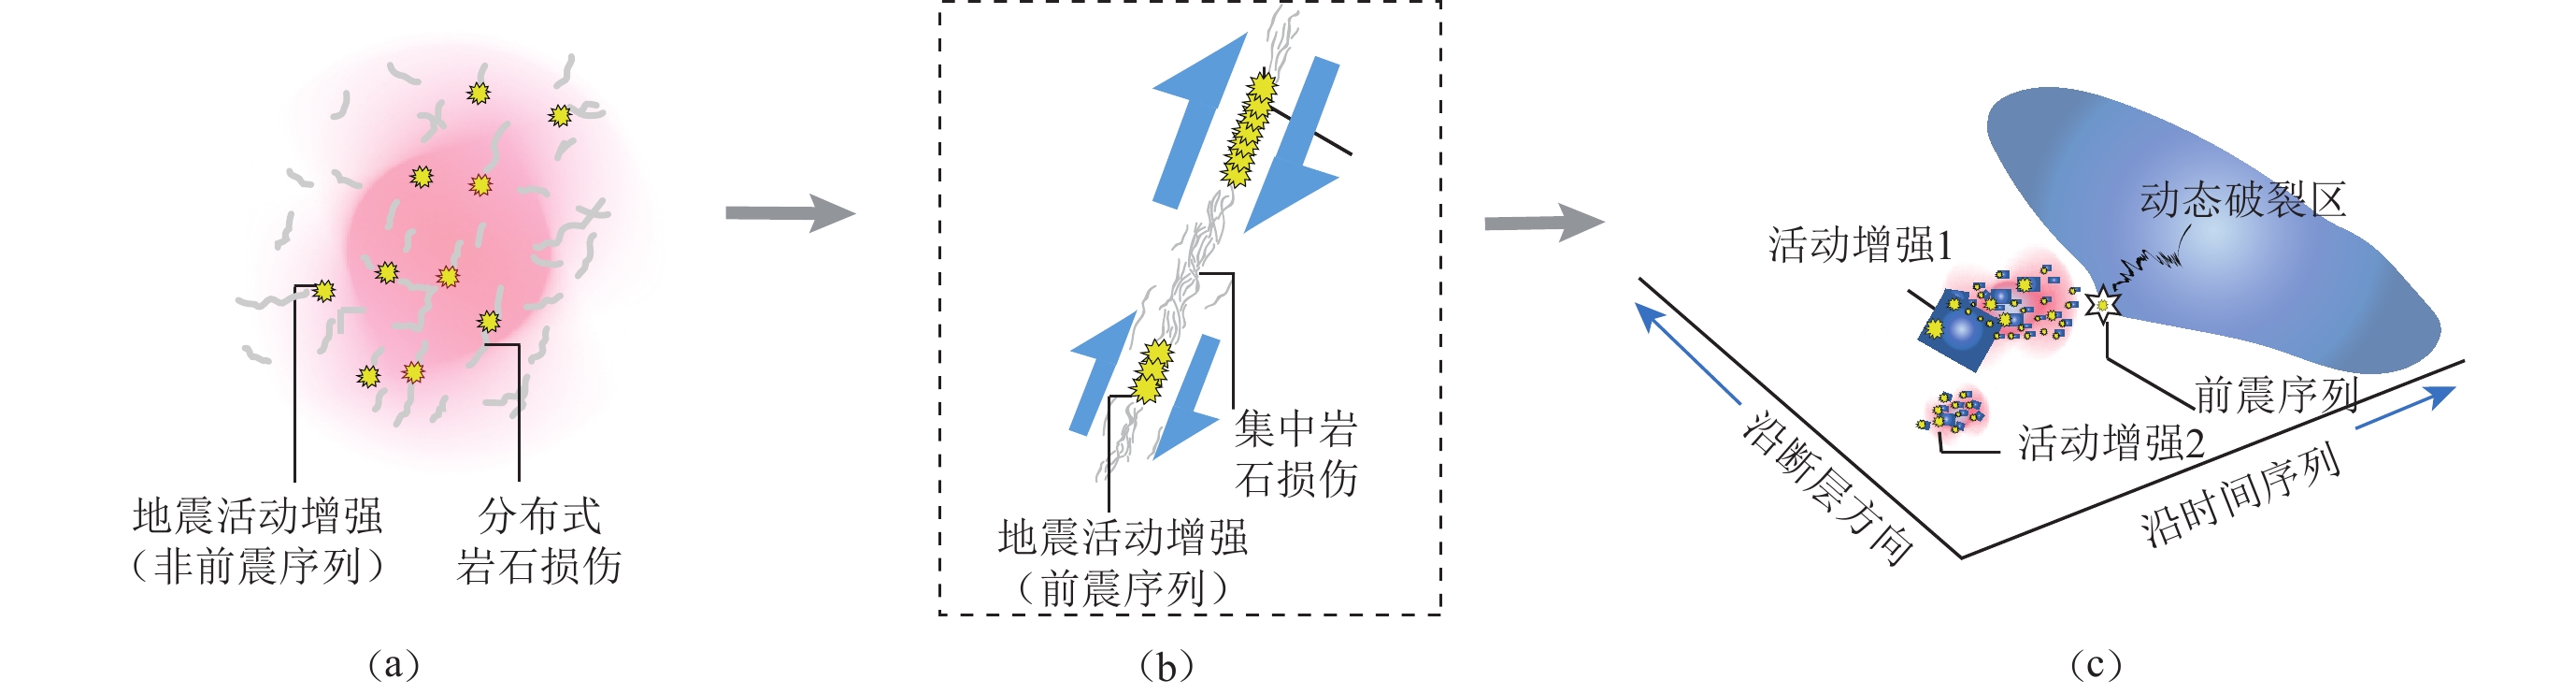
Fourthly, enhanced seismicity prior to large earthquakes drives damage to the surrounding rocks. These enhanced seismicities are not limited to the faults that generate large earthquakes. Still, they drive distributed rupture and local rock mass deformation, ultimately resulting in major slip zones and large earthquakes. Laboratory studies of rocks and similar samples have shown that a relatively long period of distributed deformation precedes the onset of large ruptures. The enhanced seismicity manifested in foreshocks is the most significant signal for the subsequent occurrence of a larger seismic event at a similar time and space. However, the enhanced seismicity does not appear as a foreshock in every case related to the seismogenic mechanism. The cascade-up framework and pre-slip model are generally used to account for the occurrence of a foreshock, whereas the progressive localization framework is suitable for explaining the enhancement of seismicity without significant foreshocks.
-
引言
秭归地区位于湖北省西部,主要由平均海拔近千米的山地组成,地势西南高东北低,自然灾害频发。秭归地区在地质构造上包括秭归盆地、黄陵背斜以及二者之间的仙女山断裂和九畹溪断裂区域(图1),其中:秭归盆地是一个扳手形状的侏罗纪沉积盆地,表现为近NS向的向斜构造,盆地长江以北轴向为近SN向,长江以南轴向为NW向(宋庆伟等,2014;王泽等,2020);黄陵背斜是华南地区最古老的出露前寒武纪花岗岩基底的地块(Huang et al,2018),长期以来构造相对稳定;仙女山断裂由数条NE−NS向断层斜列组成(孟庆筱,2012),九畹溪断裂沿线多呈V型沟谷或狭窄的河谷,两条断裂均在中更新世中晚期具有较强的活动性(吴海波等,2015)。
![]() 图 1 2009—2021年期间地震和本文所用地震台站的分布地震分布参考郑秀芬等 (2009),盆地和背斜区域划分参考李小勇等(2014)Figure 1. Distribution of earthquakes in the period of 2009−2021 and seismic stations used in the studyThe earthquake distribution refers to Zheng et al (2009),and division between basin and anticline refers to Li et al (2014)
图 1 2009—2021年期间地震和本文所用地震台站的分布地震分布参考郑秀芬等 (2009),盆地和背斜区域划分参考李小勇等(2014)Figure 1. Distribution of earthquakes in the period of 2009−2021 and seismic stations used in the studyThe earthquake distribution refers to Zheng et al (2009),and division between basin and anticline refers to Li et al (2014)秭归地区长期以来地震活动性较弱,但自从2003年三峡大坝蓄水以来,其地震活动性激增且发生多次中小浅震(李安然等,1996),给当地百姓生活带来了重大损失。这些地震主要呈面状分布于九畹溪断裂、仙女山断裂以及秭归盆地内部(图1),如2008年MS4.1,2014年MS4.2和MS4.5地震。关于这些地震的孕震机制目前尚存争议。车用太等(2009)认为,在水库水体荷载和库水下渗的共同作用下,沿仙女山断裂诱发了2008年11月22日胡家坪MS4.1构造型水库地震;马文涛等(2010)认为三峡库首区的地震多属于水库诱发地震,其中仙女山断裂北端附近的地震可能与仙女山断裂、牛口断裂等不连续结构面软化有关;王秋良等(2013)则认为仙女山断裂附近的地震为构造型地震,主要与区域断裂构造有关,在可能诱发水库地震的几个重点监视区中,仙女山断裂附近以及高桥断裂带与神龙溪交切部位的地震活动变化较为明显。基于三峡水库蓄水初期绝大部分微震和弱震以及大多数地震均发生于3—5 km深度的特点,夏金梧(2020)认为地震主要由浅表应力调整、岩溶及矿坑塌陷所引起,而MS>3.0地震一般发生于断裂附近,多由水库蓄水引发断裂构造活动引起。上述研究表明,秭归地区的孕震构造复杂,目前缺乏统一认识,尚需进一步研究。
秭归地区速度结构及其横向变化可为该研究区的孕震构造提供重要参考。廖武林等(2007)和李强等(2009)利用体波速度层析成像技术反演了水库坝址及近邻地区在蓄水前期的地壳P波和S波的三维速度结构图像,其结果表明库水渗透作用对浅表层地壳速度结构具有影响,且较大地震通常发生在高低速体之间。李强等(2011)利用Sg波成像获得三峡水库坝址及邻区的中上地壳S波速度结构,其结果显示秭归盆地的沉积层厚度不均匀,低速异常分布受构造控制。李小勇等(2014)反演了沿巴东—茅坪—土门方向的横波速度结构剖面,揭示了三峡地区上地壳的速度变化情况。吴海波等(2018)利用双差层析成像方法联合反演了三峡水库库区及近邻地区的上地壳P波三维速度结构,并讨论了库水渗透对速度结构的影响以及库区地震活动与速度结构的关系。上述研究主要是就库区较大地质构造讨论,缺乏对三峡库区特别是秭归地区上地壳浅层速度结构的研究。
鉴于此,本文拟利用在秭归地区架设的24个短周期地震仪记录到的长达一个月的连续波形数据,采用背景噪声成像方法反演秭归及邻区的浅层S波速度结构,以期为该区孕震环境以及相关的防震减灾研究提供参考。
1. 数据和方法
本研究在湖北秭归及其周边地区(30.75°N—31.15°N,110.6°E—111.0°E)共架设了24台短周期地震仪器(图1),收集了2020年6月20日到7月20日的竖直分量连续波形数据。台站分布于长江两侧,平均台间距为5 km,最大台间距为38.99 km。
本文利用背景噪声成像技术对研究区进行三维横波速度结构反演,参考Bensen等(2007)对数据进行处理,主要步骤为单台数据预处理、互相关计算与叠加、提取群速度频散曲线。首先,对原始台站的连续波形数据依次进行降采、去均值、去线性趋势。由于所有台站的仪器型号一致,所以未开展去除仪器响应的处理。仪器采样率为100 Hz,后期处理数据时,仅关注包含数秒周期范围内的信号,并且为了节省计算时间、提高效率,将数据重采样为10 Hz。为提升计算效率并便于数据质量监控,对连续波形进行截取,然而这可能会对最终信号的信噪比产生影响(谢军,2016),为此将连续波形分别截取为5,10,30,60,120,240,480,720,1440 min长度分段,进行不同台站地震背景噪声的互相关计算。之后计算面波信号的信噪比,这里信噪比定义为面波信号最大振幅与后续噪声最大振幅的均方根比值。通过对比发现截取长度为240 min或480 min时,信噪比相对较高(图2),因此后续计算均截取480 min时长进行。接下来我们使用基于绝对值滑动平均进行时间域归一化处理,用来去除背景噪声中的地震信号和仪器波动等,公式如下:
![]() 图 2 不同周期 T下信噪比随截取长度的变化图实线表示数据有50%的重叠,虚线表示没有重叠Figure 2. Variation of SNR with different interception lengths under different period TSolid lines represent 50% overlapping,while dashed lines represent no overlapping
图 2 不同周期 T下信噪比随截取长度的变化图实线表示数据有50%的重叠,虚线表示没有重叠Figure 2. Variation of SNR with different interception lengths under different period TSolid lines represent 50% overlapping,while dashed lines represent no overlapping$$ {{U_{\rm{n}}}} ( i ) = \frac{U_{\rm{o}} ( i ) }{\displaystyle\sum\limits _{j=n-N}^{n+N}\dfrac{\left|U_{\rm{o}} ( j ) \right|}{2N+1}}, $$ (1) 式中:Uo(i)为背景噪声记录或者滤波后的记录,Un(i)为时间域归一化波形,2N+1为滑动平均的时窗长度。分母波形经过0.06—3 Hz带通滤波,之后进行频率域谱白化,即对振幅进行归一化处理,目标频率为0.06—4 Hz。
获得每小段的数据之后进行互相关计算,也就是使用基于时间域的线性叠加方法对所有小段的互相关函数进行叠加,共得到276条互相关函数。图3为滤波频带为0.2—1.5 Hz的互相关函数结果,其群速度约为3 km/s,推测可以获得0—5 km深度范围的速度结构。从理论上来说,噪声源的分布是否均匀,是互相关函数的正负半轴信号是否对称的主要原因(王琼,高原,2014)。从图3a中可见部分台站在正半轴的信号较强,说明该地区的噪声源分布不均匀。为了降低噪声源分布不均的影响,对互相关函数的正负两支进行平均,得到对称相关函数(图3b),这样也能够有效地提高互相关函数的信噪比。
![]() 图 3 台站对的背景噪声互相关函数(a)及进行正反向反序求平均后的互相关函数(b)Figure 3. Cross-correlation functions (NCFs) of ambient noise for all station pairs (a) and NCFs after averaged over positive and negative lag (b)
图 3 台站对的背景噪声互相关函数(a)及进行正反向反序求平均后的互相关函数(b)Figure 3. Cross-correlation functions (NCFs) of ambient noise for all station pairs (a) and NCFs after averaged over positive and negative lag (b)图4展示了一个互相关函数面波频散图,可以看到频散比较清晰,因此使用该方法可以提取到比较准确的频散曲线。为了得到可靠的频散测量,根据Yao等(2011)的研究,我们保留了台站间距大于面波一倍波长的数据。本研究采用多重滤波方法(Herrmann,2013)手动提取噪声面波群速度频散,以确保频散曲线的质量,即主要剔除部分频散曲线的突变、多次负频散和一些能量信噪比较低等异常情况,以保证频散曲线的相对平滑。通过以上筛选,最终保留了群速度在2.0—3.5 km/s的频散曲线点,提取了周期在0.6—5 s的基阶瑞雷面波群速度频散曲线。由图4b可以看到群速度在2.0—3.5 km/s范围,且曲线比较离散,与当地的复杂浅层构造相对应。基于此,计算了各周期的频散曲线数量,如图5所示,可见周期在0.6—3.0 s内的频散曲线数量较多,故推测本文的层析成像结果比较可靠。
![]() 图 4 (a) S04-S21台站对叠加模型预测的瑞雷波群速度模态谱振幅和色散,图中黑色小方块为频散点,红色区域为最大振幅区域;(b)所有台站对的群速度频散曲线,红色虚线表示平均值Figure 4. (a) Modal spectrum amplitude and dispersion of Rayleigh wave group velocity predicted by the superposition model for the station-pair S04-S21. The small black square is the dispersion point,and the red area is the maximum amplitude area;(b) Group velocity dispersion curves for all station-pairs where the red dotted line represents the mean value
图 4 (a) S04-S21台站对叠加模型预测的瑞雷波群速度模态谱振幅和色散,图中黑色小方块为频散点,红色区域为最大振幅区域;(b)所有台站对的群速度频散曲线,红色虚线表示平均值Figure 4. (a) Modal spectrum amplitude and dispersion of Rayleigh wave group velocity predicted by the superposition model for the station-pair S04-S21. The small black square is the dispersion point,and the red area is the maximum amplitude area;(b) Group velocity dispersion curves for all station-pairs where the red dotted line represents the mean value2. 三维S波速度反演
为克服短周期面波的非大圆路径传播问题,本文使用快速行进面波层析成像(Fast Marching Surface Tomography,缩写为FMST)方法进行二维群速度反演(Rawlinson,Sambridge,2003)。为分析成像结果的分辨率及可靠性,对网格大小及对应周期进行棋盘检测,结果如图6所示,可见在0.6—3.6 s周期时,射线覆盖较密集的区域都能较好地恢复到理论速度棋盘模型。经测试,当网格大小为0.08°×0.08°时,检测板分辨率和可靠性达到最优。因此,本文选定该网格,加上±0.4 km/s的速度扰动并使用各周期的平均群速度值作为初始模型进行成像。
![]() 图 6 不同周期T下检测板测试恢复结果和射线覆盖Figure 6. Checkerboard test results and ray coverage with different periods T
图 6 不同周期T下检测板测试恢复结果和射线覆盖Figure 6. Checkerboard test results and ray coverage with different periods T然后计算周期为1.2 s时的反演走时残差并画出它的直方图,如图7所示,可见:六次迭代反演后,理论到时与实际到时之差显著降低,反演后的残差分布呈近似正态分布,说明反演结果可靠。因此,将研究区按0.08°×0.08°划分网格,利用快速行进算法和子空间方法,经过反复试验,选取合适的平滑参数和阻尼参数,迭代六次,反演获得了不同周期的瑞雷波群速度分布图,如图8所示。可以看出,随着周期的增大,局部速度异常越发明显,体现了研究区域速度结构的横向变化。
![]() 图 7 周期为1.2 s时基阶瑞雷波初始残差与反演模型走时残差直方图Figure 7. Histogram of initial (gray) and inversion (red) travel time residuals of base order Rayleigh wave with period of 1.2 s
图 7 周期为1.2 s时基阶瑞雷波初始残差与反演模型走时残差直方图Figure 7. Histogram of initial (gray) and inversion (red) travel time residuals of base order Rayleigh wave with period of 1.2 s![]() 图 8 不同周期T的瑞雷波群速度图像图中F1代表九畹溪断裂,F2代表仙女山断裂Figure 8. Rayleigh wave group velocity images of different periods TF1 stands for Jiuwanxi fault,and F2 for Xiannüshan fault
图 8 不同周期T的瑞雷波群速度图像图中F1代表九畹溪断裂,F2代表仙女山断裂Figure 8. Rayleigh wave group velocity images of different periods TF1 stands for Jiuwanxi fault,and F2 for Xiannüshan fault我们需要反演区域内每个网格点上的频散获得一维S波速度结构,以此来重建三维速度结构。由于本文研究区域范围过小,该区域缺乏较为精细的初始模型,因此参考全球速度模型并结合赵凌云等(2010)的秭归地区地壳速度模型给出初始模型,如图9所示。这里利用线性最小二乘法(Hermann,Ammon,2002)对每一个网格点下方的横波速度结构进行反演,得到研究区所有网格点下方的一维S波速度模型,之后通过线性插值最终得到研究区域的三维S波速度结构(图10)。
![]() 图 9 S波反演模型及其频散曲线拟合图蓝线为初始模型,绿线为最终模型,红线为最终模型正演计算的理论频散,黑色三角为测量频散点(a) 无高低速异常的S波速度结构;(b) 含低速异常S波速度结构;(c) 含高速异常S波速度结构Figure 9. S-wave inversion model and its dispersion curve fitting diagramThe blue line is the initial model,the green line is the final model,the red line is the theoretical dispersion calculated by the forward modeling of the final model,and the black triangle is the measured dispersion point(a) S-wave velocity structure without low and high velocity anomalies;(b) S-wave velocity structure with low velocity anomalies;(c) S-wave velocity structure with high velocity anomalies
图 9 S波反演模型及其频散曲线拟合图蓝线为初始模型,绿线为最终模型,红线为最终模型正演计算的理论频散,黑色三角为测量频散点(a) 无高低速异常的S波速度结构;(b) 含低速异常S波速度结构;(c) 含高速异常S波速度结构Figure 9. S-wave inversion model and its dispersion curve fitting diagramThe blue line is the initial model,the green line is the final model,the red line is the theoretical dispersion calculated by the forward modeling of the final model,and the black triangle is the measured dispersion point(a) S-wave velocity structure without low and high velocity anomalies;(b) S-wave velocity structure with low velocity anomalies;(c) S-wave velocity structure with high velocity anomalies![]() 图 10 秭归地区三维S波速度结构(a) 不同深度h处的S波速度,F1:九畹溪断裂;F2:仙女山断裂;(b) 沿AA′,BB′以及CC′剖面(位置见图10a) 0—6 km深度的S波速度结构Figure 10. Maps of S-wave velocity structure at different depths in Zigui area(a) S-wave velocities at different depths h,F1:Jiuwanxi fault;F2:Xiannüshan fault;(b) S-wave velocity structure at the depth of 0−6 km along the sections AA′,BB′ and CC′ (locations are shown in Fig. 10a) respectively
图 10 秭归地区三维S波速度结构(a) 不同深度h处的S波速度,F1:九畹溪断裂;F2:仙女山断裂;(b) 沿AA′,BB′以及CC′剖面(位置见图10a) 0—6 km深度的S波速度结构Figure 10. Maps of S-wave velocity structure at different depths in Zigui area(a) S-wave velocities at different depths h,F1:Jiuwanxi fault;F2:Xiannüshan fault;(b) S-wave velocity structure at the depth of 0−6 km along the sections AA′,BB′ and CC′ (locations are shown in Fig. 10a) respectively如图8所示,研究区不同周期(0.6 s,1.2 s,1.8 s,2.4 s,3.0 s,3.6 s)群速度均显示出大尺度的东西差异和构造地块差异。秭归盆地及其南向邻区的群速度较东侧仙女山断裂和九畹溪断裂区域明显要低;在断裂区,高速主要分布在长江南北两侧,越靠近长江速度越低且高速范围越小。
图10展示了研究区不同深度的S波速度结构分布,可见S波速度大致显示出与瑞雷波群速度类似的西部秭归盆地偏低、东部断裂区较高的特征。从地表到4 km深度,秭归盆地及其南邻区域的S波速度整体均低于3.0 km/s,而在断裂区核心部位普遍要高于3.0 km/s。
3. 讨论与结论
本文获得的研究区高低速分布特征与该区已有的层析成像结果(廖武林等,2007;李强等,2011)一致。但是前人结果主要是上地壳尺度的,本文结果主要在0—6 km深度且具有更高的横向分辨率。本文研究表明,秭归盆地及其南邻核心区域的沉积层厚度超过4 km,而断裂带核心区域沉积层厚度几乎为0 km,这与秭归盆地和黄陵背斜两个构造地块的形成和演化历史是一致的。秭归盆地是侏罗纪四川盆地的东延部分,其间充填巨厚的晚三叠世—侏罗纪沉积(张毅等,2012),沉积密度小且分布不均匀(李强等,2009),从侧面说明本文所得的浅地表低速特征的可靠性。断裂区位于西侧秭归盆地与东侧黄陵地块的交界区域,属于造山带,主要在中更新世中晚期具有较强的活动性(吴海波等,2015)。本文研究得到的该区速度相对秭归盆地偏高,与其所属造山带结构相一致。断裂区浅部较早的沉积层由于后期的各种构造作用如推覆逆冲等被剥蚀掉,形成了非典型沉积盆地的低速结构特征。
研究区微震与速度的关系(图1,图10)表明,微震大都发生在仙女山断裂和九畹溪断裂区上或者西侧区域,集中分布在长江周边。这些区域浅表速度都很低,可以延伸到3—4 km深度(图10)。已有研究表明,该区沉积层薄,浅层主要为风化花岗闪长岩、碳酸盐岩和碎屑岩层(于品清,1993;王秋良等,2016),这些岩层裂隙普遍发育,浅层透水性好。在4 km以下深度,由于压力增加,孔隙度减小,岩性渗透性弱。杨歧焱等(2018)等认为长江水沿着断裂的裂隙往下渗透,可以降低断层滑动所需的应力强度。陈俊华等(2016)分析2004年底至2015年初发生在仙女山断裂北端的微震的震源机制结果显示,该区微震以走滑为主、兼具大量正断或少量逆断的性质,属于高水位运行状态下易震区域的局部应力失稳,表明水库蓄水的附加压力有利于正断型地震的发生。本文推测该区可能由于长期以来长江水的下渗,改变了岩石物性,降低了岩石固结强度,进而导致了研究区的低速现象,并触发了微震的频发。王秋良等(2016)已表明MS4.1和MS4.5地震的震源深度都超过7 km,2014年MS4.2地震的震源深度约为5 km。进一步分析MS4.2地震可知,该地震发生在高低速转换区域,而震源深度上方速度整体偏低(图10),这表明三峡库区蓄水和长江水长期沿断裂往下渗透,可能与MS4.2地震的发生有一定的关联。
基于湖北省秭归地区24个短周期流动地震台站记录到的2020年6月到7月垂直分量的连续波形记录,本文利用波形互相关等技术得到了两两台站之间的经验格林函数,反演了秭归及邻区0.6—4 s周期的瑞雷波群速度分布图像以及地表至下方6 km深度范围的S波速度结构。研究结果揭示了秭归盆地以及断裂区S波速度的横向变化和区域差异特征,大致对应了研究区不同构造地块的构造演化和沉积分布。结果显示断裂区在长江区域速度明显降低,表明长江水对地下结构有影响,推测三峡库水荷载和渗透作用与研究区地震频发有一定的关系。本研究可为秭归地区的地震活动构造背景及防震减灾管理工作提供参考。
-
![]()
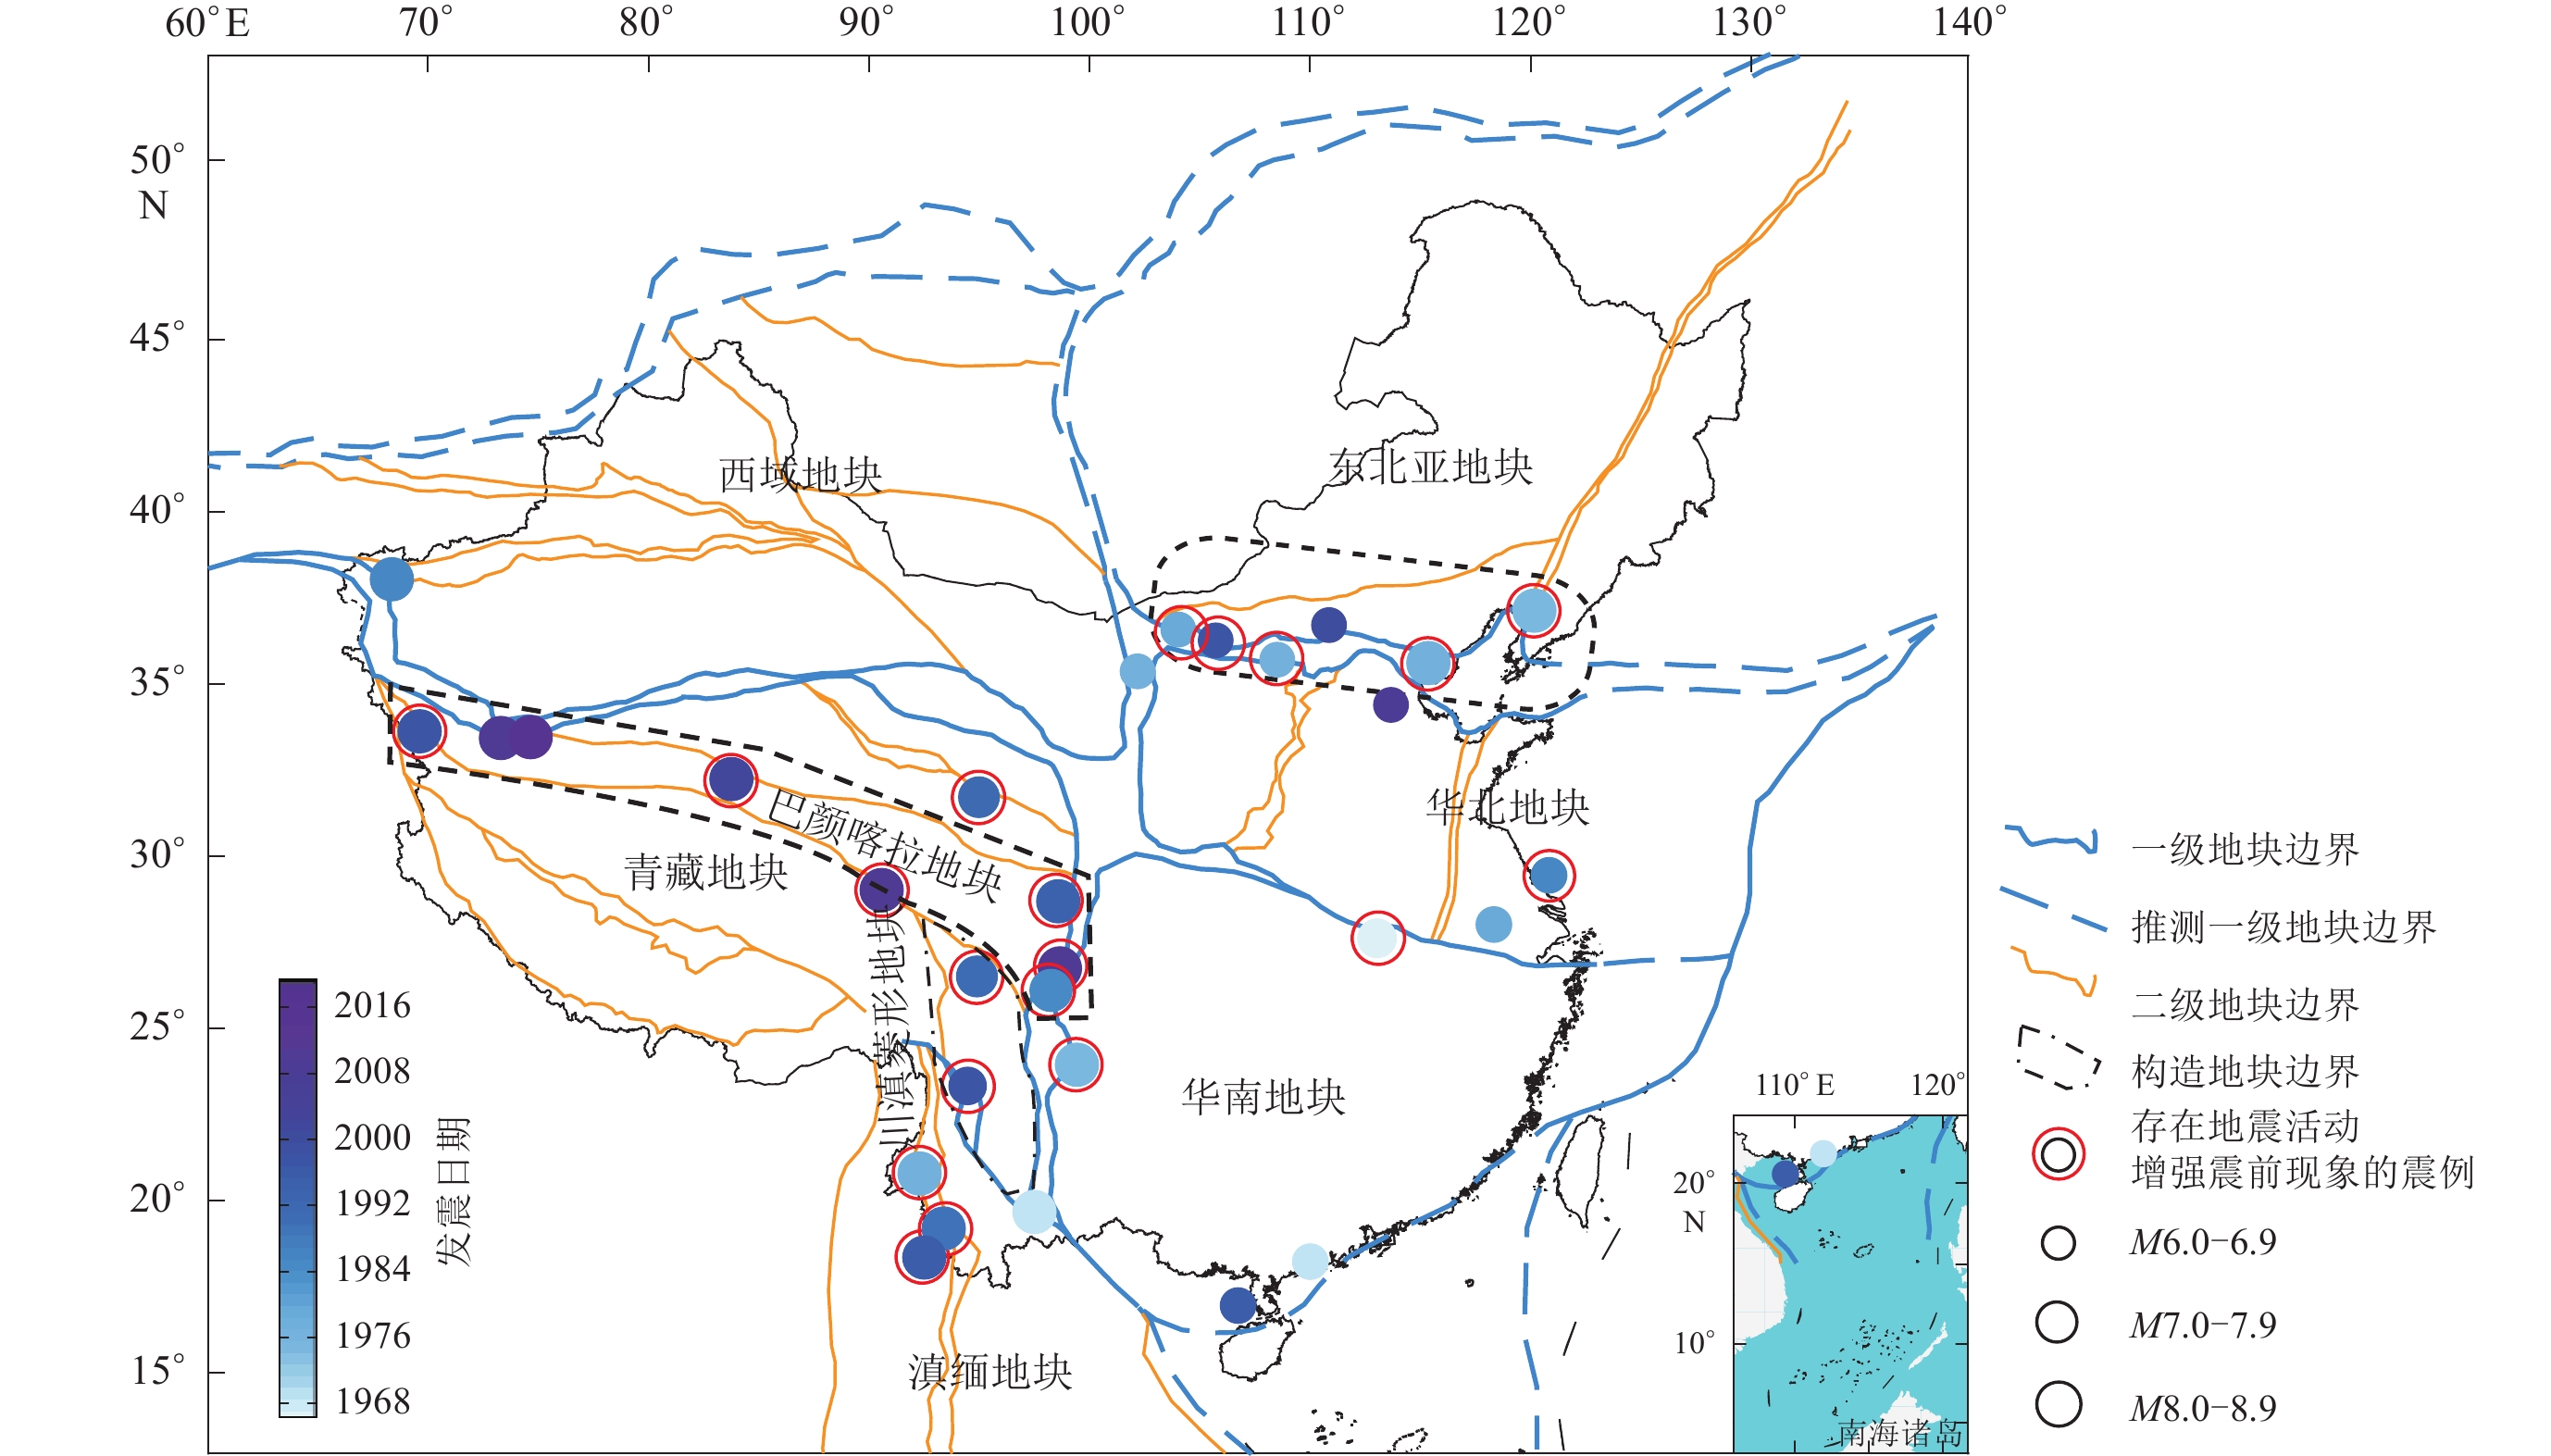
图 1 本文研究涉及的活动构造地块和震例时空分布图
图中地块边界据张培震等(2003),红色虚线圈代表震前存在地震活动显著增强现象的震例
Figure 1. Active tectonic blocks and the spatio-temporal distributions of earthquake cases used in this study
(The block boundaries refer to Zhang et al (2003),red dashed circles represents earthquake cases with enhanced seismicity prior to large earthquakes
![]()
图 2 中国大陆西部(a)和东部(b)不同震级档和空间尺度的地震前存在地震活动增强现象的震例个数
Figure 2. The number of earthquake cases with premonitory enhanced seismicity at different spatial scaleand magnitude class in western (a) and eastern (b) Chinese mainland,respectively
![]()
图 3 不同震级档和空间尺度的地震前存在地震活动增强现象的个数
Figure 3. The number of earthquake cases with premonitory enhanced seismicity at different spatial scale and magnitude
![]()
图 4 中国大陆西部(a)和东部(b)前兆地震活动增强的震级统计特征
Figure 4. Magnitude statistical characteristics of premonitory enhanced seismicity in western (a) and eastern (b) Chinese mainland respectively
![]()
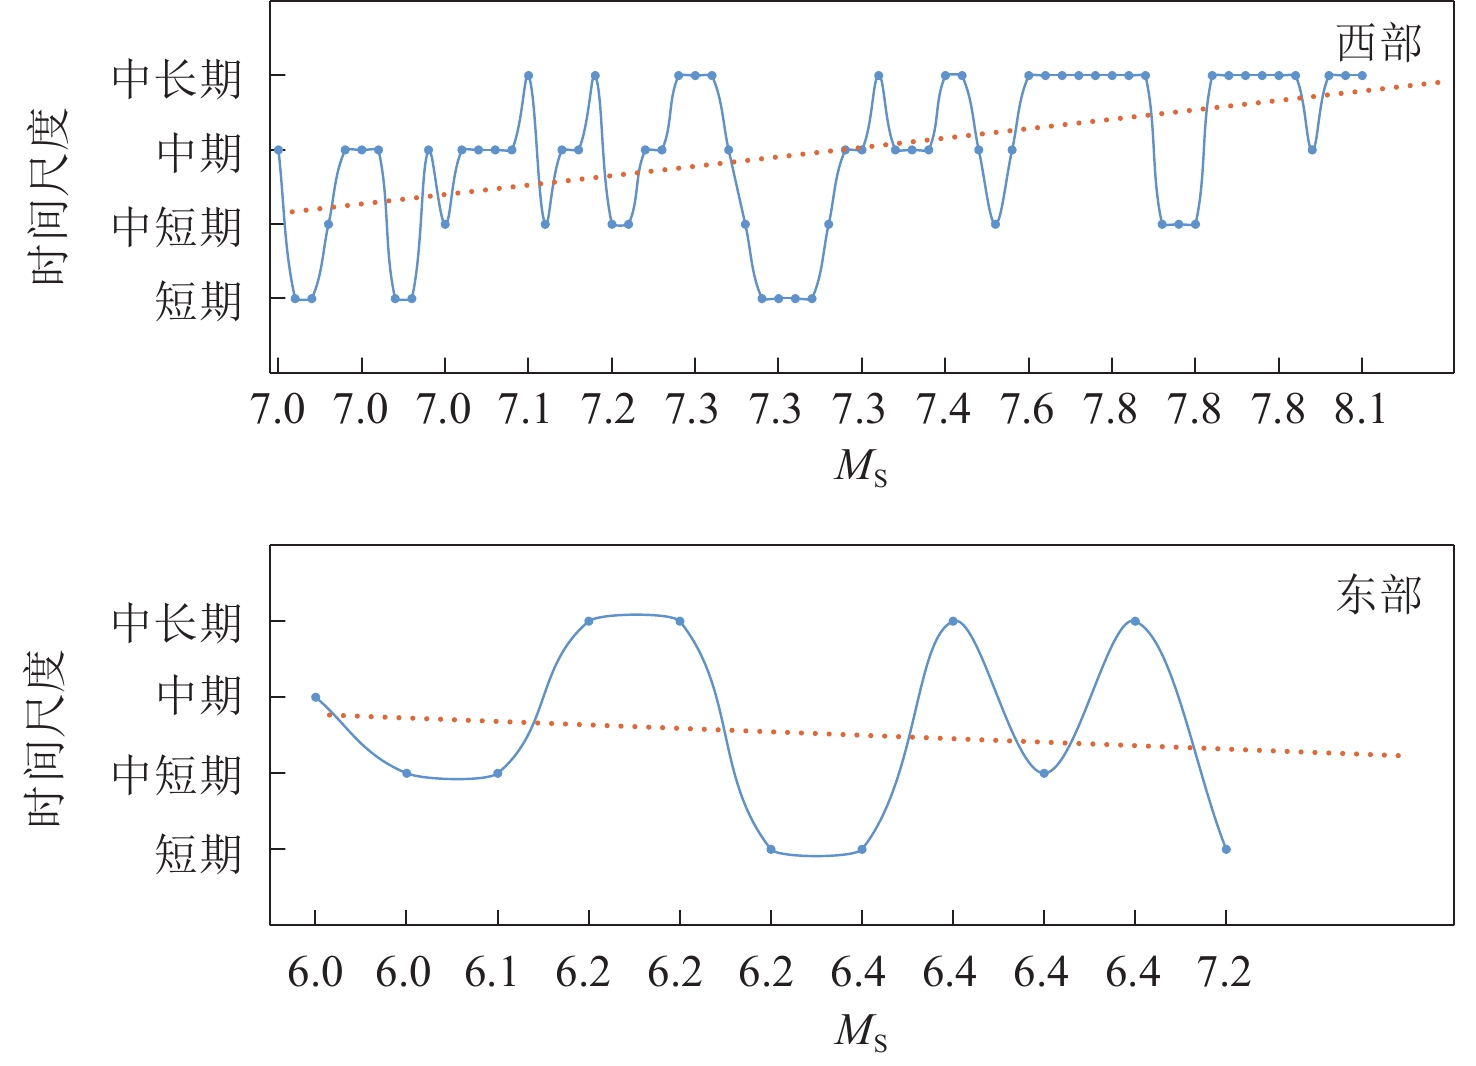
图 5 中国大陆西部和东部的前兆地震活动增强时间尺度统计特征
Figure 5. Temporal statistical characteristics of premonitory enhanced seismicity in western and eastern Chinese mainland respectively
![]()
图 6 中国大陆西部和东部地震活动增强的时间尺度随震级的变化
Figure 6. Temporal scales variation of premonitory enhanced seismicity with magnitude in western and eastern Chinese mainland respectively
![]()
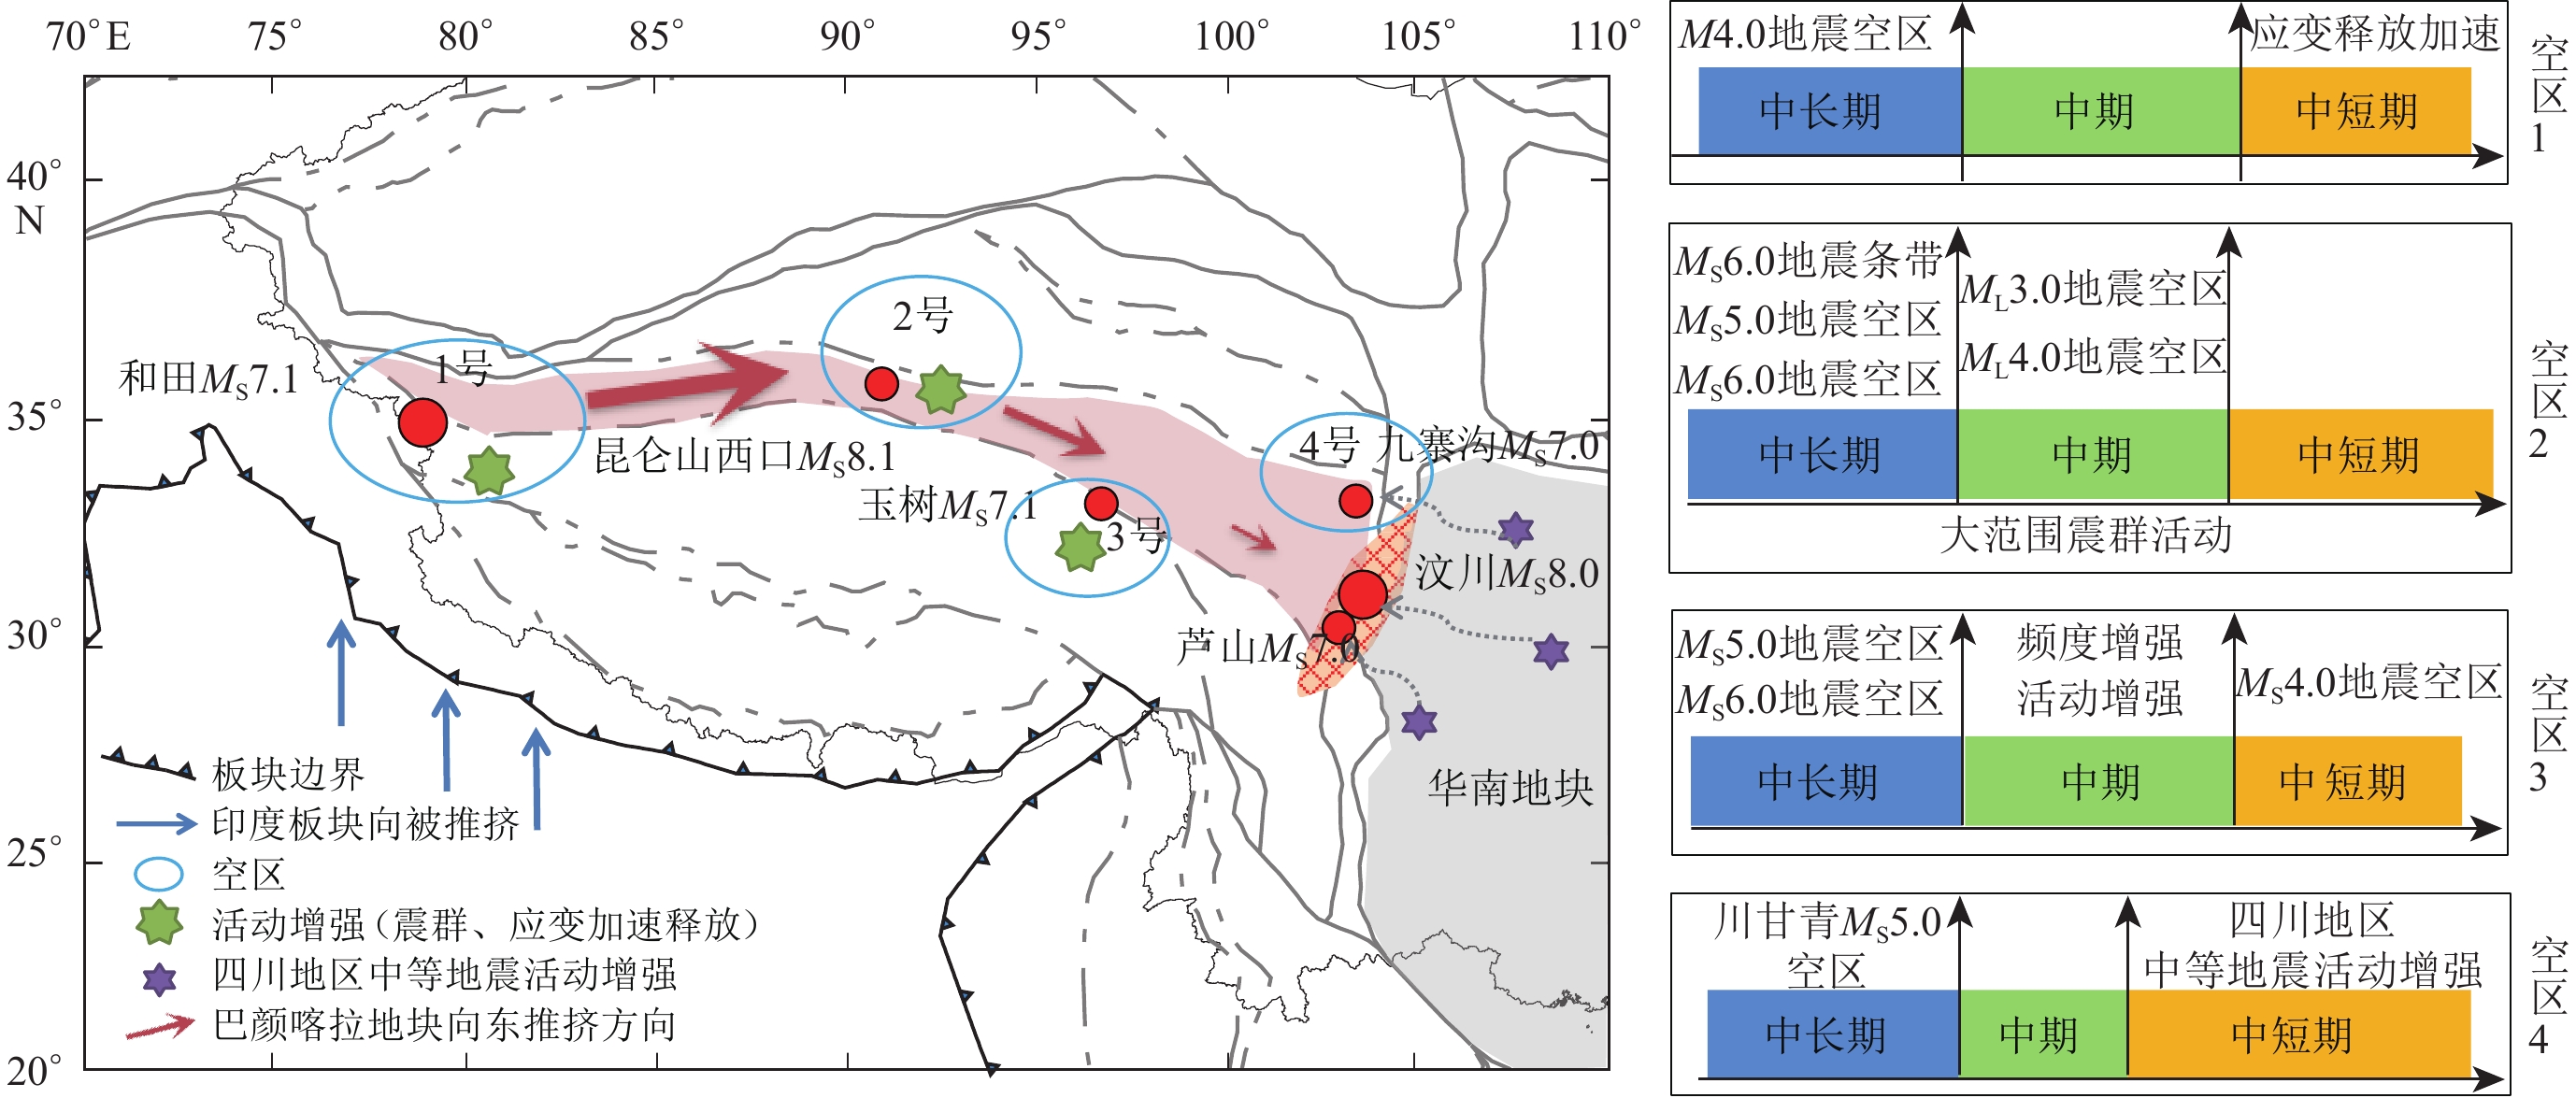
图 7 川滇菱形地块内震前地震活动增强的时空特征演化示意图
Figure 7. Schematic illustration of spatio-temporal evolution characteristics of premonitory enhanced seismicity in the Sichuan-Yunnan rhombic block
![]()
图 8 巴颜喀拉地块地震活动增强特征的时空演化示意图
Figure 8. Schematic illustration of the spatio-temporal evolution of the premonitory enhanced seismicity of the Bayan Har block
![]()
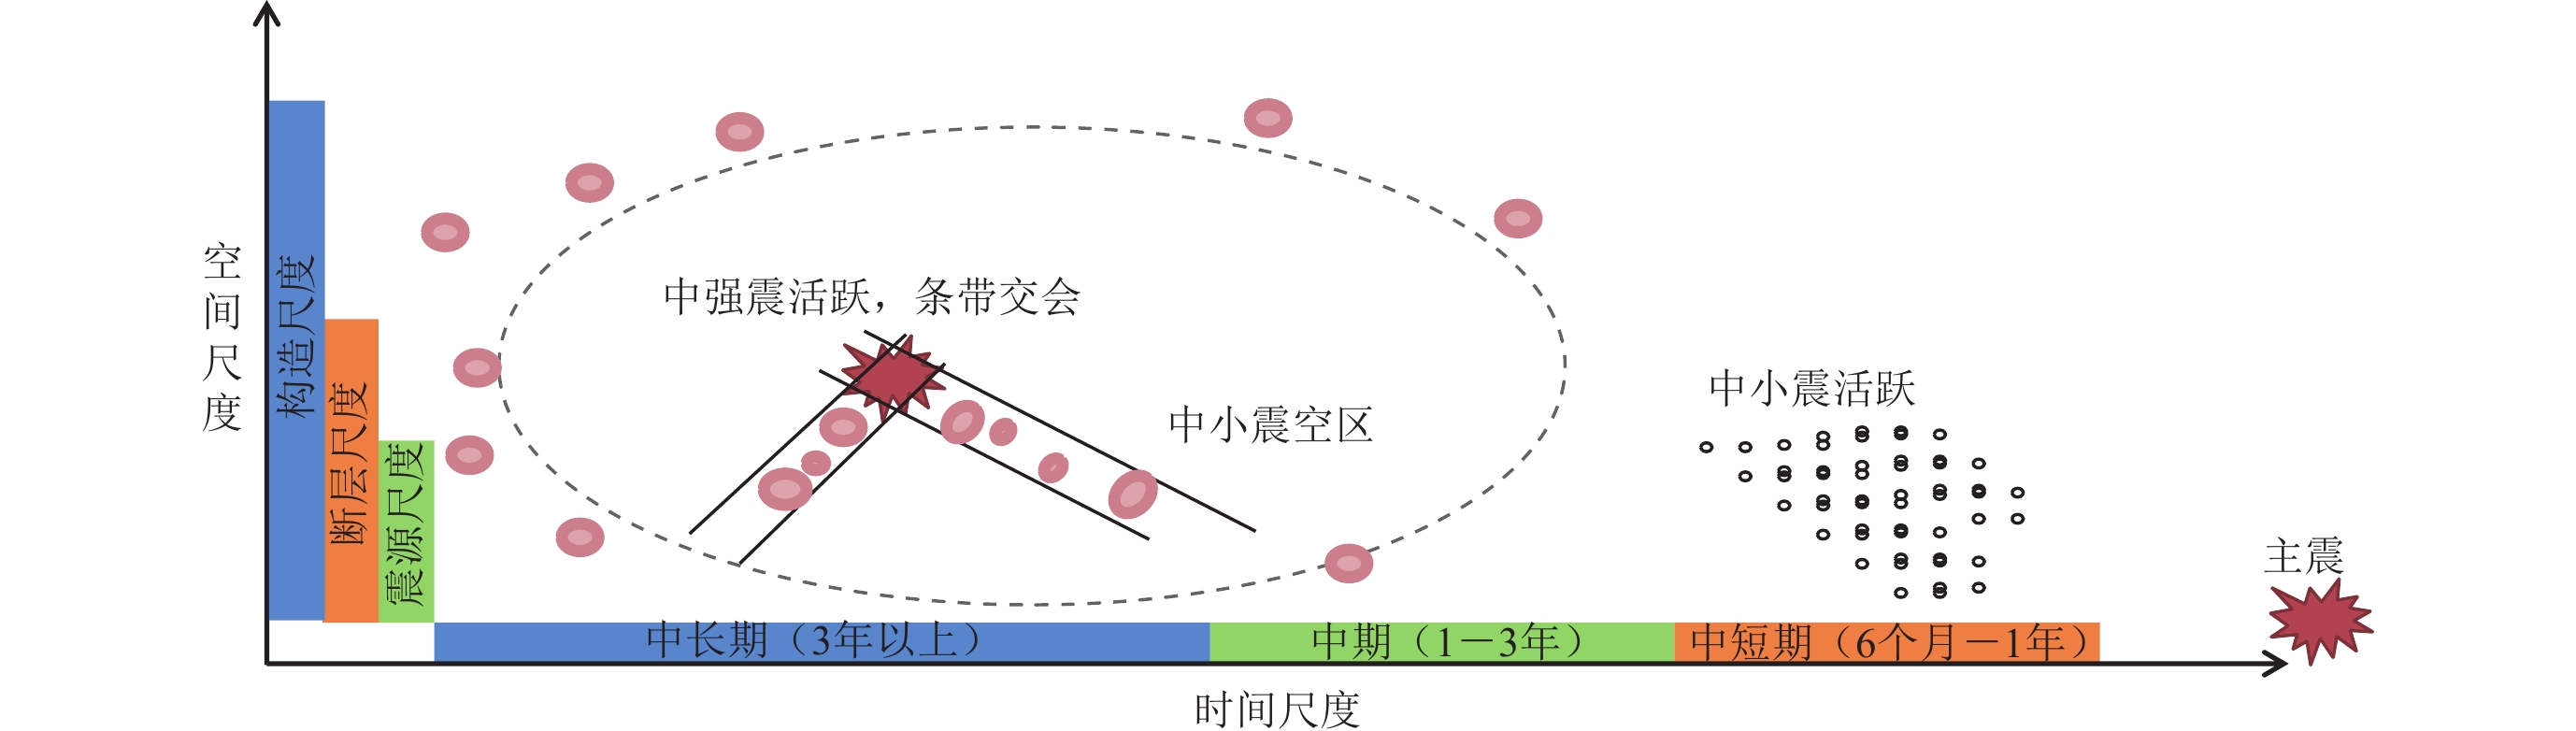
图 9 地震活动增强与大震孕育相互关系模式示意图(修改自Kato,Ben-Zion,2021)
(a) 地震活动增强引发较大范围的分布式岩石损伤;(b) 前震序列发生在大震时空紧邻区地区,岩石集中损伤;(c) 地震活动增强、前震组合形式的大震触发模型
Figure 9. Schematic illustrations of the relationship between enhanced seismicity and generation processes of strong earthquakes (modified from Kato and Ben-Zion,2021)
(a) Rock damage caused by enhanced seismicity in large scale;(b) Localization of deformation around the eventual rupture zone caused by foreshocks;(c) An integrated model including enhanced seismicity and foreshocks for the initiation of strong earthquake
表 1 本文所用具有前兆地震活动增强的震例基本信息
Table 1 Basic information of earthquake cases with premonitory enhanced seismicity used in this study
序号 发震时间
年-月-日北纬/° 东经/° MS 深度/km 地点 是否存在震前
地震活动增强1 1 966−03−22 31.50 115.00 7.2 9 邢台 是 2 1 967−03−27 38.50 116.50 6.3 30 河间 3 1 969−07−26 21.75 111.75 6.4 5 阳江 4 1 970−01−05 24.10 102.60 7.8 13 通海 5 1 973−02−06 31.50 100.40 7.6 17 炉霍 是 6 1 974−05−11 28.10 104.00 7.1 14 大关 是 7 1 975−02−04 40.70 122.80 7.3 16 海城 是 8 1 976−04−06 40.20 112.10 6.3 18 和林格尔 是 9 1 976−05−29 24.55 98.75 7.4 21 龙陵 是 10 1 976−07−28 39.60 118.20 7.8 11 唐山 是 11 1 976−08−16 32.70 104.08 7.2 15 松潘 12 1 976−09−23 40.00 106.35 6.2 35 巴音木仁 13 1 977−05−12 39.20 117.70 6.2 1 9 宁河 14 1 979−07−09 31.50 119.30 6.0 12 溧阳 15 1 979−08−25 41.23 108.11 6.0 30 五原 是 16 1 984−05−21 32.70 121.60 6.2 17 南黄海 是 17 1 985−08−23 39.58 75.60 7.4 7 乌恰 18 1 988−11−06 22.83 99.72 7.5 13 澜沧-耿马 是 1 9 1 990−04−26 36.12 100.13 7.0 32 共和 是 20 1 994−12−31 20.52 109.32 6.1 7 北部湾 21 1 995−07−12 21.98 99.07 7.3 10 孟连西 是 22 1 996−02−03 27.30 100.22 7.0 10 丽江 是 23 1 996−11−19 35.43 78.35 7.1 16 和田 是 24 1 998−01−10 41.10 114.30 6.2 10 尚义 25 2 001−11−14 35.93 90.53 8.1 10 昆仑山西口 是 26 2 008−03−21 35.80 81.43 7.3 33 于田 27 2 008−05−12 31.00 103.40 8.0 14 汶川 是 28 2 010−04−14 33.10 96.70 7.1 33 玉树 是 29 2 013−04−20 30.30 103.00 7.0 13 芦山 是 30 2 014−02−12 36.10 82.50 7.3 12 于田 31 2 017−08−08 33.20 103.82 7.0 20 九寨沟 是 32 1 989−10−19 39.94 113.84 6.1 14 大同-阳高 是 33 1 996−05−03 40.83 109.62 6.4 20 包头 是  下载: 导出CSV
-
陈棋福. 2002a. 中国震例(1992—1994)[M]. 北京:地震出版社:1−428. Chen Q F. 2002a. Earthquake Cases in China (1992−1994)[M]. Beijing:Seismological Press:1−428 (in Chinese).
陈棋福. 2002b. 中国震例(1995—1996)[M]. 北京:地震出版社:1−488. Chen Q F. 2002b. Earthquake Cases in China (1995−1996)[M]. Beijing:Seismological Press:1−488 (in Chinese).
陈棋福. 2003. 中国震例(1997—1999)[M]. 北京:地震出版社:1−468. Chen Q F. 2003. Earthquake Cases in China (1997−1999)[M]. Beijing:Seismological Press:1−468 (in Chinese).
陈棋福. 2008. 中国震例(2000—2002)[M]. 北京:地震出版社:1−570. Chen Q F. 2008. Earthquake Cases in China (2000−2002)[M]. Beijing:Seismological Press:1−570 (in Chinese).
邓起东,张培震,冉勇康,杨晓平,闵伟,楚全芝. 2002. 中国活动构造基本特征[J]. 中国科学(D辑),32(12):1020–1030. Deng Q D,Zhang P Z,Ran Y K,Yang X P,Min W,Chu Q Z. 2003. Basic characteristics of active tectonics of China[J]. Science in China:Series D,46(4):356–372. doi: 10.1360/03yd9032
国家地震局 《一九七六年唐山地震》 编辑组. 1982. 一九七六年唐山地震[M]. 北京:地震出版社:171−180. Editorial Group of 1976 Tangshan Earthquake,State Seismological Bureau. 1982. 1976 Tangshan Earthquake[M]. Beijing:Seismological Press:171−180 (in Chinese).
蒋海昆. 2014. 中国震例(2003—2006)[M]. 北京:地震出版社:1−775. Jiang H K. 2014. Earthquake Cases in China (2003−2006)[M]. Beijing:Seismological Press:1−775 (in Chinese).
蒋海昆. 2018a. 中国震例(2007—2010)[M]. 北京:地震出版社:1−513. Jiang H K. 2018a. Earthquake Cases in China (2000−2002)[M]. Beijing:Seismological Press:1−513 (in Chinese).
蒋海昆. 2018b. 中国震例(2011—2012)[M]. 北京:地震出版社:1−437. Jiang H K. 2018b. Earthquake Cases in China (2011−2012)[M]. Beijing:Seismological Press:1−437 (in Chinese).
梅世蓉. 1960. 中国的地震活动性[J]. 地球物理学报,9(1):1–19. Mei S R. 1960. Seismicity in China[J]. Acta Geophysica Sinica, 9 (1):1−19 (in Chinese).
梅世蓉. 1995. 地震前兆场物理模式与前兆时空分布机制研究(一):固体孕震模式的由来与证据[J]. 地震学报,17(3):273–282. Mei S R. 1995. On the physical model of earthquake precursor fields and the mechanism of precursors’ time and space distribution ( Ⅰ ):Origin and evidences of the strong body earthquake-generating model[J]. Acta Seismologica Sinica, 8 (3):337−349.
梅世蓉. 1996. 地震前兆场物理模式与前兆时空分布机制研究(二) :强震孕育时应力、应变场的演化与地震活动、地震前兆的关系[J]. 地震学报, 18 (1):1−10. Mei S R. 1996. Physical models of earthquake precursor fields and spatial-temporal distribution mechanisms of precursors distribution mechanism study ( Ⅱ ):Evolution of stress and strain fields in relation to seismic activity and earthquake precursors[J]. Acta Seismologica Sinica,9(1):1–12.
宋治平,梅世蓉,尹祥础. 1999. 强大地震前地震活动增强区及其力学研究[J]. 地震学报,21(3):271–277. Song Z P,Mei S R,Yin X C. 1999. On seismic strengthening area before strong and great shocks and its mechanism[J]. Acta Seismologica Sinica, 12 (3):298−305.
王筱荣. 2005. 新疆强震前地震活动增强研究[J]. 华南地震,25(1):17–23. doi: 10.3969/j.issn.1001-8662.2005.01.003 Wang X R. 2005. Research on seismicity increasing before strong earthquake in Xinjiang[J]. South China Journal of Seismology,25(1):17–23 (in Chinese).
闻学泽,杜方,张培震,龙锋. 2011. 巴颜喀拉块体北和东边界大地震序列的关联性与2008年汶川地震[J]. 地球物理学报,54(3):706–716. doi: 10.3969/j.issn.0001-5733.2011.03.010 Wen X Z,Du F,Zhang P Z,Long F. 2011. Correlation of major earthquake sequences on the northern and eastern boundaries of the Bayan Har block,and its relation to the 2008 Wenchuan earthquake[J]. Chinese Journal of Geophysics,54(3):706–716 (in Chinese).
薛丁. 2003. 包头西6.4级地震前显著中等地震活动增强和丛集异常[J]. 地震,23(4):71–76. doi: 10.3969/j.issn.1000-3274.2003.04.011 Xue D. 2003. Obvious intensifying and swarming anomaly of moderate seismic activity before west Baotou earthquake with M=6.4[J]. Earthquake,23(4):71–76 (in Chinese).
薛艳,刘杰,宋治平,黎明晓. 2018. 汶川地震前地震活动特征的普遍性及其机理探讨[J]. 地球物理学报,61(5):1891–1906. Xue Y,Liu J,Song Z P,Li M X. 2018. On the universality and mechanism interpretation of the seismicity characteristics before the 2008 Wenchuan MS8.0 earthquake[J]. Chinese Journal of Geophysics,61(5):1891–1906 (in Chinese).
晏锐,田雷,王广才,钟骏,刘杰,周志华. 2018. 2008年汶川8.0级地震前地下流体异常回顾与统计特征分析[J]. 地球物理学报,61(5):1907–1921. Yan R,Tian L,Wang G C,Zhong J,Liu J,Zhou Z H. 2018. Review and statistically characteristic analysis of underground fluid anomalies prior to the 2008 Wenchuan MS8.0 earthquake[J]. Chinese Journal of Geophysics,61(5):1907–1921 (in Chinese).
张国民,马宏生,王辉,王新岭. 2005. 中国大陆活动地块边界带与强震活动[J]. 地球物理学报,48(3):602–610. doi: 10.3321/j.issn:0001-5733.2005.03.018 Zhang G M,Ma H S,Wang H,Wang X L. 2005. Boundaries between active-tectonic blocks and strong earthquakes in the China mainland[J]. Chinese Journal of Geophysics,48(3):602–610 (in Chinese). doi: 10.1002/cjg2.693
张培震,邓起东,张国民,马瑾,甘卫军,闵伟,毛凤英,王琪. 2003. 中国大陆的强震活动与活动地块[J]. 中国科学(D辑),33(增刊1):12–20. Zhang P Z,Deng Q D,Zhang G M,Ma J,Gan W J,Min W,Mao F Y,Wang Q. 2003. Active tectonic blocks and strong earthquakes in the continent of China[J]. Science in China:Series D,46(S2):13–24. doi: 10.1360/03dz0002
张培震,闻学泽,徐锡伟,甘卫军,王敏,沈正康,王庆良,黄媛,郑勇,李小军,张竹琪,马胜利,冉勇康,刘启元,丁志峰,吴建平. 2009. 2008年汶川8.0级特大地震孕育和发生的多单元组合模式[J]. 科学通报,54(7):944–953. Zhang P Z,Wen X Z,Xu X W,Gan W J,Wang M,Shen Z K,Wang Q L,Huang Y,Zheng Y,Li X J,Zhang Z Q,Ma S L,Ran Y K,Liu Q Y,Ding Z F,Wu J P. 2009. Tectonic model of the great Wenchuan earthquake of May 12,2008,Sichuan,China[J]. Chinese Science Bulletin,54(7):944–953 (in Chinese). doi: 10.1360/csb2009-54-7-944
张肇诚. 1988. 中国震例(1966—1975)[M]. 北京:地震出版社:1−222. Zhang Z C. 1988. Earthquake Cases in China (1966−1975)[M]. Beijing:Seismological Press:1−222 (in Chinese).
张肇诚. 1990a. 中国震例(1976—1980)[M]. 北京:地震出版社:1−294. Zhang Z C. 1990a. Earthquake Cases in China (1976−1980)[M]. Beijing:Seismological Press:1−294 (in Chinese).
张肇诚. 1990b. 中国震例(1981—1985)[M]. 北京:地震出版社:1−222. Zhang Z C. 1990b. Earthquake Cases in China (1981−1985)[M]. Beijing:Seismological Press:1−222 (in Chinese).
张肇诚. 1999. 中国震例(1986—1988)[M]. 北京:地震出版社:1−394. Zhang Z C. 1999. Earthquake Cases in China (1986−1988)[M]. Beijing:Seismological Press:1−394 (in Chinese).
张肇诚. 2000. 中国震例(1989—1991)[M]. 北京:地震出版社:1−453. Zhang Z C. 2000. Earthquake Cases in China (1989−1991)[M]. Beijing:Seismological Press:1−453 (in Chinese).
中国地震局. 2005. GB/T 18207.2—2005 防震减灾术语 第2部分:专业术语[S]. 北京:中国标准出版社:13−14. China Earthquake Administration. 2005. GB/T 18207.2−2005 Terminology of Protecting Against and Mitigating Earthquake Disasters:Part 2:Special Technical Terms[S]. Beijing:Standards Press of China:13−14 (in Chinese).
中国地震局. 2007. DB/T 24-2007 震例总结规范[S]. 北京:地震出版社:4. China Earthquake Administration. 2007. DB/T 24−2007 Specification for Earthquake Case Summarization[S]. Beijing:Seismological Press:4 (in Chinese).
Abercrombie R E. 2019. Small and large earthquakes can have similar starts[J]. Nature,573(7772):42–43. doi: 10.1038/d41586-019-02613-5
Ben-Zion Y. 2008. Collective behavior of earthquakes and faults:Continuum-discrete transitions,progressive evolutionary changes,and different dynamic regimes[J]. Rev Geophys,46(4):RG4006.
Ben-Zion Y,Zaliapin I. 2020. Localization and coalescence of seismicity before large earthquakes[J]. Geophys J Int,223(1):561–583. doi: 10.1093/gji/ggaa315
Burchfiel B C,Royden L H,van der Hilst R D,Hager B H,Chen Z,King R W,Li C,Lü J,Yao H,Kirby E. 2008. A geological and geophysical context for the Wenchuan earthquake of 12 May 2008,Sichuan,People’s Republic of China[J]. GSA Today,18(7):4–11. doi: 10.1130/GSATG18A.1
Fukao Y,Furumoto M. 1985. Hierarchy in earthquake size distribution[J]. Phys Earth Planet Inter,37(2/3):149–168.
Gomberg J. 2018. Unsettled earthquake nucleation[J]. Nat Geosci,11(7):463–464. doi: 10.1038/s41561-018-0149-x
Kato A,Ben-Zion Y. 2021. The generation of large earthquakes[J]. Nat Rev Earth Environ,2(1):26–39.
Lockner D A,Byerlee J D,Kuksenko V,Ponomarev A,Sidorin A. 1991. Quasi-static fault growth and shear fracture energy in granite[J]. Nature,350(6313):39–42. doi: 10.1038/350039a0
Lyakhovsky V,Ben-Zion Y. 2009. Evolving geometrical and material properties of fault zones in a damage rheology model[J]. Geochem Geophys Geosyst,10(11):Q11011.
Lyakhovsky V,Ben-Zion Y,Agnon A. 2001. Earthquake cycle,fault zones,and seismicity patterns in a rheologically layered lithosphere[J]. J Geophys Res:Solid Earth,106(B3):4103–4120.
Mogi K. 1969. Some features of recent seismic activity in and near Japan (2):Activity before and after great earthquakes[J]. Bull Earthq Res Inst,Univ Tokyo, 47 (3):395−417.
Reches Z,Lockner D A. 1994. Nucleation and growth of faults in brittle rocks[J]. J Geophys Res:Solid Earth,99(B9):18159–18173. doi: 10.1029/94JB00115
Renard F,Mcbeck J,Kandula N,Cordonnier B,Meakin P,Ben-Zion Y. 2019. Volumetric and shear processes in crystalline rock approaching faulting[J]. Proc Natl Acad Sci USA,116(33):16234–16239. doi: 10.1073/pnas.1902994116
Ritter M C,Santimano T,Rosenau M,Leever K,Oncken O. 2018. Sandbox rheometry:Co-evolution of stress and strain in Riedel- and Critical Wedge-experiments[J]. Tectonophysics,722:400–409. doi: 10.1016/j.tecto.2017.11.018
Sadovsky M A,Nersesov I L,Nigmatullaev S K,Latynina L A,Lukk A A,Semenov A N,Simbireva I G,Ulomov V I. 1972. The processes preceding strong earthquakes in some regions of Middle Asia[J]. Tectonophysics,14(3/4):295–307.
Schrank C E,Boutelier D A,Cruden A R. 2008. The analogue shear zone:From rheology to associated geometry[J]. J Struct Geol,30(2):177–193. doi: 10.1016/j.jsg.2007.11.002
Tapponnier P,Peltzer G,Le Dain A Y,Armijo R,Cobbold P. 1982. Propagating extrusion tectonics in Asia:New insights from simple experiments with plasticine[J]. Geology,10(12):611–616. doi: 10.1130/0091-7613(1982)10<611:PETIAN>2.0.CO;2
Wan Y G,Shen Z K. 2010. Static Coulomb stress changes on faults caused by the 2008 MW7.9 Wenchuan,China earthquake[J]. Tectonophysics,491(1/2/3/4):105–118.
Wen X Z,Yi G X,Xu X W. 2007. Background and precursory seismicities along and surrounding the Kunlun fault before the MS8.1,2001,Kokoxili earthquake,China[J]. J Asian Earth Sci,30(1):63–72. doi: 10.1016/j.jseaes.2006.07.008
Добровольский ПП. 1991. Теорпя Поцотовп Тегтоппчесго нылдаов фыовлдыо[M]. Мосиова:П3в AH CCCP:1−30.
-
期刊类型引用(1)
1. 孙国栋,李翠平,董蕾,唐茂云. 三峡库区巫山段双差层析成像. 大地测量与地球动力学. 2025(04): 397-402 .  百度学术
百度学术
其他类型引用(0)


计量
- 文章访问数: 212
- HTML全文浏览量: 55
- PDF下载量: 70
- 被引次数: 1
