

Relocations and focal mechanism solutions characteristics of 2012 Yiliang MS5.7 and MS5.6 earthquake sequence
-
摘要: 利用地震科学探测台阵在云南、 贵州地区的17个流动台站的地震记录, 采用双差定位法对2012年9月7日云南彝良MS5.7和MS5.6地震及其余震序列(ML≥1.0)进行重定位. 在获得精确的震源位置后, 采用CAP法反演了MS≥4.0地震的震源机制解. 结果显示, 彝良MS5.7主震位于(27.509°N, 103.971°E), 震源深度为9.7 km, 震源机制解节面Ⅰ走向251°、 倾角66°、 滑动角150°, 节面Ⅱ走向354°、 倾角63°、 滑动角27°; 彝良MS5.6主震位于(27.563°N, 104.034°E), 震源深度为10.0 km, 震源机制解节面Ⅰ走向235°、 倾角39°、 滑动角147°, 节面Ⅱ走向352°、 倾角70°、 滑动角56°. 反演结果显示断层的几何形态、 余震分布特征、 震源机制解特征及构造应力场等均有很好的一致性. 综合断层的运动学特征、 地震活动规律和地质构造背景, 推测彝良地震的发震断裂为昭通断裂带的前缘断裂, 即NE走向的石门断裂. 导致震区受灾严重的主要原因是由于彝良地震震源深度较浅, 能量释放多发生在地壳浅部所致.
-
关键词:
- 彝良MS5.7和MS5.6地震 /
- 双差定位法 /
- CAP法 /
- 震源机制解
Abstract: Based on the recordings of 17 portable seismographs of ChinArray deployed in Yunnan-Guizhou region, the Yiliang MS5.7 and MS5.6 earthquakes happened on September 7, 2012 and the aftershocks with ML≥1.0 were relocated by double-difference hypocenter location algorithm (hypoDD), and then the focal mechanism solutions of earthquakes (MS≥4.0) were determined by CAP (cut and paste) method. Our results show that the Yiliang MS5.7 mainshock is located at (27.509°N, 103.971°E) with initial rupture depth of 9.7 km. The best double-couple solutions for the Yiliang MS5.7 earthquake have one nodal plane with strike 251°, dip 66°, rake 150°, and another plane with strike 354°, dip 63° and rake 27°. The Yiliang MS5.6 mainshock is relocated at (27.563°N, 104.034°E) with initial rupture depth of 10.0 km, and the mechanism solutions of two nodal planes are 235°, 39°, 147° and 352°, 70°, 56°, respectively. The fault geometry, aftershock distribution characteristics, focal mechanism solutions and the tectonic stress field are in good consistency. Combining with the characteristic of fault kinematic, seismicity and the geological structure, we infer that Yiliang MS5.7 and MS5.6 earthquakes occurred on the NE-striking Shimen fault which is the leading edge of Zhaotong fracture. The shallow focal depth of Yiliang earthquake and the energy release occurred in shallow crust are the major reasons for serious damage in the hypocentral region. -
引言
前人对于动态和静态应力变化的研究表明, 同震过程导致了断层的相互作用和地震的触发. 大震后区域静态库仑应力变化常常被用于解释区域地震活动性速率的变化(Reasenberg,Simpson, 1992; Simpson,Reasenberg, 1994; Harris,Simpson, 1998; Toda et al, 1998)、 主震断层外余震的发生(Dieterich, 1972, 1994; Rybicki, 1973; Das, Scholz, 1981; Stein et al, 1992, 1994; Dieterich,Kilgore, 1996; Gross,Kisslinger, 1997; Gross, Bürgmann, 1998)以及即将失稳断层的地震发生概率的变化(Toda et al, 1998); 而动态模型则被用于研究由动态应力变化引起的断层间相互作用和地震的触发(Harris,Day, 1993; Gomberg et al, 1997, 1998). 1992年美国Landers地震为我们提供了一些小范围内断层相互作用和远距离地震活动性触发的实例. King等(1994)计算得到Landers地震对后续Big Bear MS6.5地震产生的库仑破裂应力增量约为0.2 MPa, 认为是Landers地震加速了Big Bear地震的发生. Spudich等(1995)还讨论了关于Big Bear余震是由1992年Landers地震触发的问题, 并指出无论用动态触发还是静态触发,都很难解释这3.5个小时的时间延迟.Gomberg等(1998)解释了摩擦失稳模型中近距离(静态和动态)触发和远距离(动态)触发的主要特征, 并讨论了静态和动态加载是怎样改变了断层的失稳时间.Harris(1998) 则详细地总结了应力触发、 应力影区及其对地震危险性的影响.
关于汶川地震应力触发的相关研究受到了国内外专家学者的重视. 汶川地震震中位于龙门山断裂的中段, 震源深度14 km(中国地震台网中心, 2013a), 破裂沿着北东走滑、 西部倾斜的龙门山逆冲断层带向前扩展. 该地震引起地壳深部的岩石破裂长达300多千米(陈运泰, 2008; 王卫民等, 2008). Toda等(2008)利用几条主要活动断裂插值得到了汶川地震产生的应力变化分布. 万永革等(2009)和单斌等(2009)计算了汶川地震导致的周围断层应力变化, 解朝娣等(2010)在其基础上探讨了汶川地震引起的周边断裂应力变化后地震活动性随时间变化的情况. Parsons等(2008)还初步探讨了汶川地震产生的应力变化和对周围断层的影响.
汶川地震发生近5年后, 2013年4月20日8点2分46秒, 我国四川省雅安市芦山县(30.3°N, 103.0°E)发生了MS7.0地震, 震区发生大面积的滑坡和建筑物损毁. 地震定位和震源机制结果显示该地震是发生在龙门山断裂带上的又一次逆冲型地震, 也是汶川地震后发生在龙门山断裂带上最强的一次地震. 芦山MS7.0地震发生在龙门山断裂带的南端, 在汶川地震发生时这一地段没有发生破裂滑动. “芦山地震是否为汶川地震的余震”在学界引起了一定的争论. 陈运泰等(2013)认为芦山地震是汶川地震的最强余震; 王卫民等(2013)指出“芦山地震在宏观上可视为汶川地震一次‘迟到’的强余震”; 而刘杰等(2013)认为两次地震的余震区存在约45 km的间隔, 芦山MS7.0地震不是汶川地震的余震.
然而, 无论持有哪种观点, 各位专家都不否认芦山MS7.0与汶川MS8.0地震有密切的联系. 汶川地震发生后, 雅安芦山地区的库仑应力增加的事实是肯定的(Parsons et al, 2008). 那么汶川地震究竟是怎样触发芦山地震? 是否还会有类似芦山地震的强余震在周围地区发生? 这才是研究汶川地震后区域库仑应力变化的最主要目的和最核心的问题.
本文利用含(滑移)速率和状态的摩擦定律(Dieterich, 1994), 结合汶川地震前后的地震活动性水平, 深入阐述了芦山MS7.0地震的静态应力触发过程, 从地震发生概率的变化上理解芦山地震的发震根源, 并计算周边的鲜水河断层和熊坡断层的发震概率变化, 从而为区域地震活动性以及危险性评价提供重要的参考.
1. 含(滑移)速率和状态的摩擦定律
含(滑移)速率和状态的摩擦本构关系为我们提供了一个对断层属性进行复杂的定量实验观测的基本框架(Dieterich, 1979, 1981, 1994; Ruina, 1983). 最简单地表述含(滑移)速率和状态的断层应力是由Ruina, 1983)基于Dieterich(1994))的理论提出的. 如果将其推广为多态变量(Rice,Gu, 1983), 则可以写作

This page contains the following errors:
error on line 1 at column 1: Start tag expected, '<' not foundBelow is a rendering of the page up to the first error.

![]() 图 1 弹簧-滑块模型示意图, 由此得到的滑块运动方程为:τ =-k(δ-δ0).其中τ为剪切摩擦应力, k为弹簧的有效弹性系数,δ和δ0分别为滑动位移和初始滑动位移Figure 1. Spring-slide block model. The equation of motion for the slider is τ =-k(δ-δ0), where k, δ, δ0,τ are the spring constant, the displacement of the block,the displacement of the right-hand end of the spring, and the shear friction, respectively
图 1 弹簧-滑块模型示意图, 由此得到的滑块运动方程为:τ =-k(δ-δ0).其中τ为剪切摩擦应力, k为弹簧的有效弹性系数,δ和δ0分别为滑动位移和初始滑动位移Figure 1. Spring-slide block model. The equation of motion for the slider is τ =-k(δ-δ0), where k, δ, δ0,τ are the spring constant, the displacement of the block,the displacement of the right-hand end of the spring, and the shear friction, respectivelyThis page contains the following errors:
error on line 1 at column 1: Start tag expected, '<' not foundBelow is a rendering of the page up to the first error.

进一步, 假设第n次子事件的失稳时间tf=nΔt, 其中Δt是第n-1次事件到第n次事件的时间间隔, 那么可以得到第n次子事件的滑动速率


将式(4)代入式(5), 可得地震(事件)次数

This page contains the following errors:
error on line 1 at column 1: Start tag expected, '<' not foundBelow is a rendering of the page up to the first error.

This page contains the following errors:
error on line 1 at column 1: Start tag expected, '<' not foundBelow is a rendering of the page up to the first error.
由于地震活动性与区域应力场有关, 那么区域应力场的改变必将导致相应的地震危险性概率的变化. 假定地震序列在时间t内, 对震级M以上的发震概率服从泊松模型(Dieterich,Kilgore, 1996)

那么, 利用式(8)的概率分布, 结合式(7)可以计算在应力Δτ的扰动下造成大于M级地震的发震概率.
2. 发震概率计算
截至2013年2月28日, 汶川地震已有M>5.0的余震128次, M>4.0的余震841次, M>2.0的余震2 174次(中国地震台网中心, 2013b), 而且余震还在持续. 图2显示了汶川地震前(1970-01-01—2008-05-11)后(2008-05-12—2010-05-11)的地震分布及M>2.0地震的年发生率. 震后汶川周边地区的应力状态发生了明显地变化(Parsons et al, 2008; Toda et al, 2008; 万永革等, 2009; 单斌等, 2009; 解朝娣等, 2010), 从而导致了地震活动性分布的显著不同.
![]() 图 2 汶川地震前(a)、 后(b)的M>2.0地震分布及地震年发生率网格大小为0.05°×0.05°, 右侧色标显示的年发生率为网格内M>2.0的年发生率. 红色圆圈代表M>5.0地震, 黑色圆圈代表2.0<M<5.0地震, 灰色实线代表断层位置Figure 2. Distribution of M>2.0 earthquakes and seismicity rate of Longmenshan fault before (a) and after (b) Wenchuan earthquake Red and black circles represent M>5.0 and 2.0<M<5.0 earthquakes, respectively.The seismicity on colorbar on the right is in the grid of 0.05°×0.05°. The gray line is the fault
图 2 汶川地震前(a)、 后(b)的M>2.0地震分布及地震年发生率网格大小为0.05°×0.05°, 右侧色标显示的年发生率为网格内M>2.0的年发生率. 红色圆圈代表M>5.0地震, 黑色圆圈代表2.0<M<5.0地震, 灰色实线代表断层位置Figure 2. Distribution of M>2.0 earthquakes and seismicity rate of Longmenshan fault before (a) and after (b) Wenchuan earthquake Red and black circles represent M>5.0 and 2.0<M<5.0 earthquakes, respectively.The seismicity on colorbar on the right is in the grid of 0.05°×0.05°. The gray line is the fault假设汶川地区的余震持续时间为85年(申文豪等, 2013), 大于设定震级M的地震在该地区的年发生率为0.01次, A=0.01, σn=10 MPa (Dieterich,Kilgore, 1996). 在不同应力扰动的情况下, 根据式(6)和(7)计算所得发生大于设定震级M的概率如图3所示. 从图3可见, 大应力扰动可导致地震发生率的快速上升, 因此在受到大应力扰动的地区地震发生的时间会大幅提前.
![]() 图 3 不同应力扰动下发生大于设定震级M的概率变化Figure 3. The probability of earthquake occurrence of magnitude >M on different shear stress disturbance
图 3 不同应力扰动下发生大于设定震级M的概率变化Figure 3. The probability of earthquake occurrence of magnitude >M on different shear stress disturbance对于雅安地区(30.0°—30.7°N, 102.5°—103.5°E), 汶川地震后库仑应力增加了0.1 MPa (Parsons et al, 2008). 从1970年1月1日—2008年1月1日, 共发生了23次M>4.0地震, 其中仅发生一次M>6.0的地震. 那么根据背景场地震活动性速率公式r≥M=N/Δt(其中N为发生大于震级M的地震次数, Δt为时间间隔)可以求出r≥6.0=0.026 3次/年. 依然假设A=0.01, σn=10 MPa (Dieterich,Kilgore, 1996), 那么在汶川地震后雅安地区的地震活动性概率变化如图4所示. 从图4可以看出, 发震断层的余震持续 时间对于发震
![]() 图 4 雅安地区发生M>6.0地震的概率变化不同颜色曲线代表了不同的余震持续时间, 黑色箭头所指位置为现今雅安地区对应的发震概率Figure 4. The probability of earthquake occurrence of M>6.0 in Ya'an area Different colors give difference aftershock durations, the black arrow shows the earthquake probability in Ya'an area now
图 4 雅安地区发生M>6.0地震的概率变化不同颜色曲线代表了不同的余震持续时间, 黑色箭头所指位置为现今雅安地区对应的发震概率Figure 4. The probability of earthquake occurrence of M>6.0 in Ya'an area Different colors give difference aftershock durations, the black arrow shows the earthquake probability in Ya'an area now概率的影响并不大, 而受到扰动之后的几年内发震概率的增幅较快. 芦山地震发生在汶川地震后近5年, 而由于受汶川地震的影响, 雅安地区此时发生M6.0地震的概率已经增加到25%—30%.
事实上, 汶川地震之后不仅雅安地区的库仑应力增加, 其周边的鲜水河断层和熊坡断层也存在库仑应力的明显增加(Parsons et al, 2008), 这些断层仍然是今后需要防范的重点地区. 图5显示了汶川地震后鲜水河断层不同震级的发震概率变化. 根据中国地震台网中心给出的地震目录, 从汶川地震后到2013年2月28日, 鲜水河断层已发生M>4.0地震10次, 其中2010年4月27日发生一次M5.0地震, 此时M>5.0的发震概率已超过80%, 而至今未发生M>6.0的地震, 而M>6.0的发震概率已约为60%, 所以鲜水河断层附近将成为M>6.0地震的重点防范地区. 鲜水河断层未来发生M>6.0地震概率由表1给出.
![]() 图 5 汶川地震后鲜水河断层发生地震的概率变化实箭头所指位置为现今鲜水河断层对应的M>6.0的发震概率, 虚箭头所指的位置为2010年4月27日发生的M5.0地震对应的发震概率Figure 5. The probability of earthquake occurrence of Xianshuihe fault after Wenchuan earthquake The black arrow shows the probabilities of earthquake occurrence of M>6.0 on Xianshuihe fault at present, the dashed arrow points out the probabilities of earthquake occurrence when the M5.0 earthquake happened on April 27, 2010表 1 鲜水河断层未来发生M>6.0的地震概率Table 1. The probabilities of earthquake occurrence of M>6.0 on Xianshuihe fault
图 5 汶川地震后鲜水河断层发生地震的概率变化实箭头所指位置为现今鲜水河断层对应的M>6.0的发震概率, 虚箭头所指的位置为2010年4月27日发生的M5.0地震对应的发震概率Figure 5. The probability of earthquake occurrence of Xianshuihe fault after Wenchuan earthquake The black arrow shows the probabilities of earthquake occurrence of M>6.0 on Xianshuihe fault at present, the dashed arrow points out the probabilities of earthquake occurrence when the M5.0 earthquake happened on April 27, 2010表 1 鲜水河断层未来发生M>6.0的地震概率Table 1. The probabilities of earthquake occurrence of M>6.0 on Xianshuihe fault
图6显示了汶川地震后熊坡断层不同震级的发震概率变化. 根据中国地震台网给出的地震目录, 从汶川地震后到2013年2月28日, 尚未发生M>4.0地震, 此时M>4.0的发震概率已接近90%,虽然M>5.0的发震概率仅为26%, 但是该地区将来仍旧有发生中强地震的危险性. 熊坡断层未来发生M>4.0地震概率由表2给出.
![]() 图 6 汶川地震后熊坡断层发生地震的概率变化黑色虚线所指的位置为现今对应的发震概率Figure 6. The probabilities of earthquake occurrence of Xiongpo fault after Wenchuan earthquake The dashed line shows the probabilities of earthquake occurrence at present表 2 熊坡断层未来发生M>4.0地震概率Table 2. The probabilities of earthquake occurrence of M>4.0 on Xiongpo fault
图 6 汶川地震后熊坡断层发生地震的概率变化黑色虚线所指的位置为现今对应的发震概率Figure 6. The probabilities of earthquake occurrence of Xiongpo fault after Wenchuan earthquake The dashed line shows the probabilities of earthquake occurrence at present表 2 熊坡断层未来发生M>4.0地震概率Table 2. The probabilities of earthquake occurrence of M>4.0 on Xiongpo fault
3. 讨论与结论
芦山MS7.0地震的发生重新引起了对汶川地震的热议. 本文利用含(滑移)速率和状态的摩擦定律(Dieterich, 1994), 结合汶川地震前后的地震活动性水平, 从地震发生概率 的变化上解释了芦山地震的发震根源; 计算得到了芦山地震发生时, 雅安地区发生M>6.0 地震的概率已经增加了25%—30%. 此外, 本文对于库仑应力增加的鲜水河断层和熊坡断层也进行了发震概率的计算. 根据中国地震台网中心给出的地震目录, 从M>4.0地震的发生情况来看, 计算结果与实际情况基本符合. 鲜水河断层从汶川地震后至今未发生M>6.0地震, 而M>6.0的发震概率已约为60%; 熊坡断层自汶川地震以来尚未发生M>4.0地震, 此时M>4.0的发震概率已接近90%. 所以, 我们认为鲜水河断层附近将成为M>6.0地震的重点防范地区, 熊坡地区将来仍旧有发生中强地震的危险性.
然而, 在计算过程中存在很多不确定性. 首先, 参数的选取可能带来一定误差, 比如A取0.01, σn取10 MPa (Dieterich,Kilgore, 1996)等, 与实际不完全一致; 其次, 库仑应力状态的计算过程依赖模型的选取, 不同研究者可能给出不同的应力变化值(Parsons et al, 2008; Toda et al, 2008; 单斌等, 2009; 万永革等, 2009; 解朝娣等, 2010). 本文仅选用Parsons等(2008)结果进行计算也会带来一定的误差; 最后, 地震目录特别是小震目录的缺失使得对背景场地震活动性的估计不够准确. 所以, 应用条件概率模型会更具可靠性. 但是由于缺乏发震断层的滑移历史、 发震的准周期及上次地震至今的时间, 条件概率模型在目前的研究中, 尤其对我国西南地区来讲, 仍然难以应用.
-
![]()
图 1 彝良MS5.7和MS5.6地震震中及其邻区构造图(闻学泽等,2013)黑色框所示范围为昭通断裂带. F1: 昭通—鲁甸断裂; F2: 石门断裂; F3: 龙树断裂; F4: 会泽—彝良断裂
Figure 1. Epicenters of Yiliang MS5.7 and MS5.6 earthquakes and the surrounding regional tectonic settings(after Wen et al,2013)The black rectangle delineates the Zhaotong fault zone. F1 : Zhaotong-Ludian fault; F2 : Shimen fault; F3: Longshu fault; F4: Huize-Yiliang fault
![]()
图 2 彝良MS5.7和MS5.6地震震中及台站分布
Figure 2. Epicenters of Yiliang MS5.7 and MS5.6 earthquakes and stations distribution
![]()
图 3 彝良MS5.7和MS5.6地震序列重定位前(a)、 后(b)的震中分布
Figure 3. Epicentral distribution of Yiliang MS5.7 and MS5.6 earthquake sequence before(a) and after(b)relocation
![]()
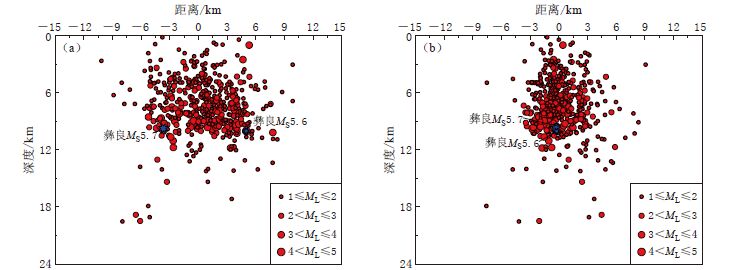
图 4 彝良MS5.7和MS5.6地震序列沿AA′(a)和BB′(b)剖面的震源深度分布
Figure 4. Focal depth distribution of Yiliang MS5.7 and MS5.6 earthquake sequence along the profiles of AA′(a) and BB′(b)
![]()
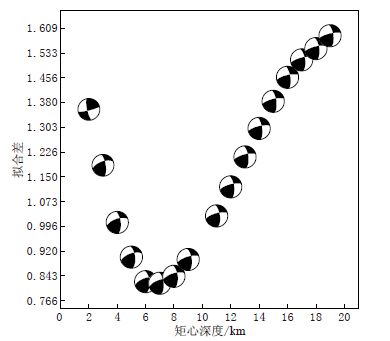
图 5 彝良MS5.7地震的拟合差和震源机制解(下半球投影)随矩心深度的变化
Figure 5. Misfit plots as a function of centroid depth for Yiliang MS5.7 earthquake(lower-hemisphere projection)
![]()
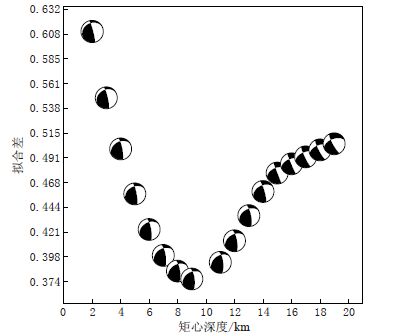
图 6 彝良MS5.6地震的拟合差和震源机制解(下半球投影)随矩心深度的变化
Figure 6. Misfit plots as a function of centroid depth for Yiliang MS5.6 earthquake(lower-hemisphere projection)
![]()
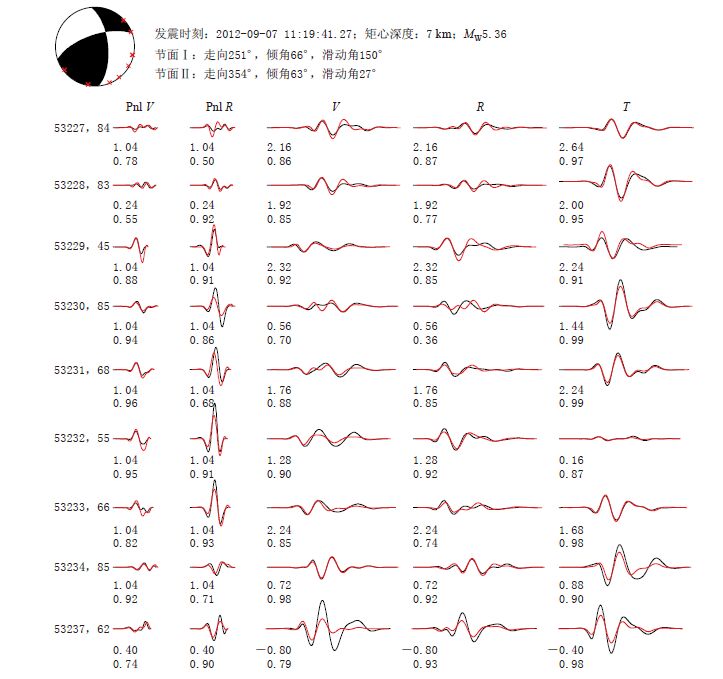
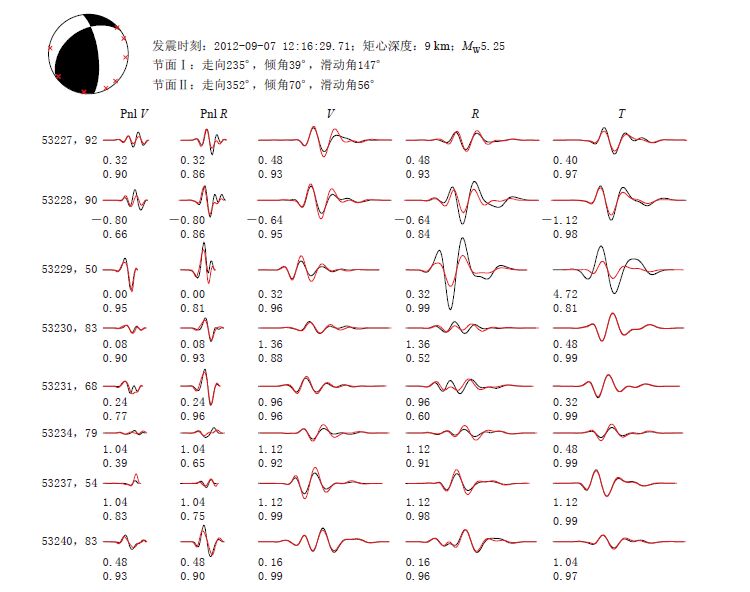
图 7 彝良MS5.7地震的理论地震波形(红色)与观测波形(黑色)对比 波形下方第一行数字为理论波形相对于观测波形的时移(单位: s),正值为理论波超前; 第二行数字为两波形的相关系数; 波形左侧数字为台站名及其震中距(单位: km)
Figure 7. Comparison between the theoretical(red lines) and observed(black lines)waveforms of the Yiliang MS5.7 earthquake The numbers of the first line below the waveforms are the time shift(in s)of theoretical waveforms relative to observed ones,and the positive values indicate the theoretical waveform being ahead of the observed one. The numbers of the second line indicate the correlative coefficients between them. The name of stations and corresponding epicentral distances(in km)are given at the left side of waveforms
![]()
表 1 地壳速度和密度参考模型
Table 1 Crustal velocity and density reference model
地壳厚度/km vP/(km·s-1) vS/(km·s-1) ρ/(g·cm-3) 0—5 5.680 3.114 2.645 5—10 5.889 3.387 2.829 10—20 6.008 3.395 2.832 20—32 6.344 3.590 2.906 32—36 6.408 3.625 2.920 36—40 6.345 3.590 2.906 40—45 6.800 3.863 3.000 >45 7.900 4.350 3.310  下载: 导出CSV
表 2 彝良MS5.7和MS5.6地震序列中4次MS≥4.0地震的震源机制解
Table 2 Focal mechanism solutions of four earthquakes with magnitude MS≥4.0 of Yiliang MS5.7 and MS5.6 earthquake sequence
地震编号 发震时刻 东经/° 北纬/° 矩心深度/km MS MW 走向/° 倾角/° 滑动角/° 年-月-日 时:分:秒 1 2012-09-07 11:19:41.27 103.971 27.509 7 5.7 5.36 251 66 150 2 2012-09-07 12:16:29.71 104.034 27.563 9 5.6 5.25 235 39 147 3 2012-09-07 11:58:00.41 104.032 27.553 7 4.4 4.36 216 25 105 4 2012-09-07 13:12:46.19 104.041 27.561 6 4.4 4.38 190 74 22
下载: 导出CSV
表 3 本文结果与不同文献给出的震源机制解结果对比
Table 3 Comparison of focal mechanism solutions by this paper with those from other studies
文献 走向/° 倾角/° 滑动角/° 矩心深度/km 韩立波和蒋长胜(2012) 248/233 59/39 149/151 10/10 吕坚等(2013a) 243/241 62/37 149/162 6/6 Global CMT(2012) 236/235 52/45 139/158 12/12 本文 251/235 66/39 150/147 7/9 注: 数据为同一节面的走向、 倾角和滑动角. “/”前、 后分别为彝良MS5.7和MS5.6地震的震源机制解结果.
下载: 导出CSV
-
韩立波, 蒋长胜. 2012. “中国地震科学台阵探测”项目快报: 2012年9月7日云南昭通5.7级和5.6级地震[EB/OL]. [2015-05-08]. http://www.cea-igp.ac.cn/tpxw/263563.shtml. Han L B, Jiang C S. 2012. “China Seismic Array” project bulletin: Zhaotong MS5.7 and MS5.6 earthquakes occured on September 7, 2012[EB/OL]. [2015-05-08]. http://www.cea-igp.ac.cn/tpxw/263563.shtml (in Chinese).
网易新闻. 2012. 云南彝良地震致80人遇难[EB/OL]. [2015-03-05]. http://news.163.com/12/0908/00/8ARCSCKP0001124J.html. Netease News. 2012. 80 people were dead in Yiliang earthquake occurred in Yunnan Province[EB/OL]. [2015-03-05]. http://news.163.com/12/0908/00/8ARCSCKP0001124J.html (in Chinese).
徐锡伟, 于贵华. 2012. 云南昭通5.7、 5.6级双震地震构造图[EB/OL]. [2015-03-05]. http://www.eq-igl.ac.cn/www-root/c_000000090002/d_0730.html. Xu X W, Yu G H. 2012. The seismotectonic map of MS5.7 and MS5.6 double earthquakes in Zhaotong, Yunnan Pro-vince[EB/OL]. [2015-03-05]. http://www.eq-igl.ac.cn/wwwroot/c_000000090002/d_0730.html (in Chinese).
中国地震台网中心. 2012a. 云南省昭通市彝良县、 贵州省毕节市威宁彝族回族苗族自治县交界发生5.7级地震[EB/OL]. [2015-03-05]. http://www.cenc.ac.cn/publish/cenc/904/20130528150011546350018/index.html. China Earthquake Networks Center. 2012a. The MS5.7 earthquake occurred in the border area of Yiliang, Zhaotong in Yunnan Province and Yi, Hui, Miao Nationality Autonomous County, Weining, Bijie in Guizhou Province[EB/OL]. [2015-03-05]. http://www.cenc.ac.cn/publish/cenc/904/20130528150011546350018/index.html (in Chinese).
中国地震台网中心. 2012b. 2012年9月7日云南彝良、 贵州威宁交界5.7级、 5.6级地震[EB/OL]. [2015-03-05]. http://www.cenc.ac.cn/publish/cenc/886/20130528145652625283910/index.html. China Earthquake Networks Center. 2012b. The MS 5.7 and MS5.6 earthquakes occurred in the border area of Yiliang in Yunnan Province and Weining in Guizhou Province[EB/OL]. [2015-03-05]. http://www.cenc.ac.cn/publish/cenc/886/20130528145652625283910/index.html (in Chinese).
Global CMT. 2012. Global CMT Catalog Search[EB/OL]. [2015-03-05]. http://www.globalcmt.org/cgi-bin/globalcmt-cgi-bin/CMT4/form?itype=ymd&yr=2012&mo=9&day=7&otype=ymd&oyr=2012&omo=9&oday=7&jyr=1976&jday=1&ojyr=1976&ojday=1&nday=1&lmw=0&umw=10&lms=0&ums=10&lmb=0&umb=10&llat=-90&ulat=90&llon=-180&ulon=180&lhd=0&uhd=1000<s=-9999&uts=9999&lpe1=0&upe1=90&lpe2=0&upe2=90&list=0.
-
期刊类型引用(5)
1. 吴微微,梁明剑,龙锋,苏金蓉,陈学芬. 青川断裂及邻区现今地震活动性研究. 地震研究. 2023(02): 188-203 .  百度学术
百度学术
2. 黄雄南,杨晓平,胡宗凯,杨海波. 白龙江断裂西段晚第四纪构造活动特征研究. 震灾防御技术. 2023(04): 701-717 . 百度学术
3. 靳志同,万永革,刘兆才,黄骥超,李瑶,杨帆. 2017年九寨沟M_S7.0地震对周围地区的静态应力影响. 地球物理学报. 2019(04): 1282-1299 . 百度学术
4. 程佳,姚生海,刘杰,姚琪,宫会玲,龙海云. 2017年九寨沟地震所受历史地震黏弹性库仑应力作用及其后续对周边断层地震危险性的影响. 地球物理学报. 2018(05): 2133-2151 . 百度学术
5. ZHANG Chongyuan,WU Manlu,CHEN Qunce,LIAO Chunting. Piezomagnetic In-situ Stress Monitoring and its Application in the Longmenshan Fault Zone. Acta Geologica Sinica(English Edition). 2014(05): 1592-1602 . 必应学术
其他类型引用(11)


计量
- 文章访问数: 868
- HTML全文浏览量: 502
- PDF下载量: 28
- 被引次数: 16
