

Vertical ionosonde net and its data application in southwestern China
-
摘要: 本文基于我国西南地区电离层垂测网普洱站和乐山站的基础数据,结合空间天气事件指数,通过限定不同阈值的滑动平均方法,提出靠近南部的普洱站应选取中值M±1.5σ(标准差)作为限定阈值,靠近北部的乐山站应选取中值M±IQR(四分位距)作为限定阈值.在此基础上,利用本文提出的扰动识别方法,对2015年4月25日尼泊尔MS 8.1地震予以分析.研究结果显示,震前1天普洱站和乐山站均出现了正向扰动,震前3小时乐山站持续出现负异常.根据规划,我们还将在西南地区建立1—2个垂测台站,架设数台被动接收垂测仪信号的电离层斜向探测仪,通过组网对西南地区上空的电离层进行监测,为分析震前电离层扰动提供数据支持.
-
关键词:
- 电离层垂测 /
- 异常提取 /
- 尼泊尔MS8.1地震
Abstract: In order to monitor the ionospheric change in southwestern China, two stations were established in Pu'er City of Yunnan Province and Leshan Normal University of Sichuan Province jointly by Institute of Earthquake Science, China Earthquake Administration and Wuhan University. Based on the vertical ionosonde data from the two stations and space weather events, we used the moving average method with different threshold to extract ionospheric perturbation, and selected median±1.5Std and median±IQR as the threshold at the stations Pu'er and Leshan, respectively. Furthermore, using this method, we analyzed the data before Nepal MS8.1 earthquake occurred at 14:11 on 25 April 2015. The results showed that there were positive anomalies in April 24 at the two stations Pu'er and Leshan, and negative anomalies lasting for three hours at Leshan station before the Nepal earthquake. According to our plan, besides the two stations, one or two vertical ionosonde stations and several oblique ionosondes will be set up in southwestern China, which will monitor the ionosphere over the region, and provide data for analyzing seismo-ionospheric disturbance.-
Keywords:
- vertical ionosonde /
- anomaly extraction /
- Nepal MS8.1 earthquake
-
-
![]()
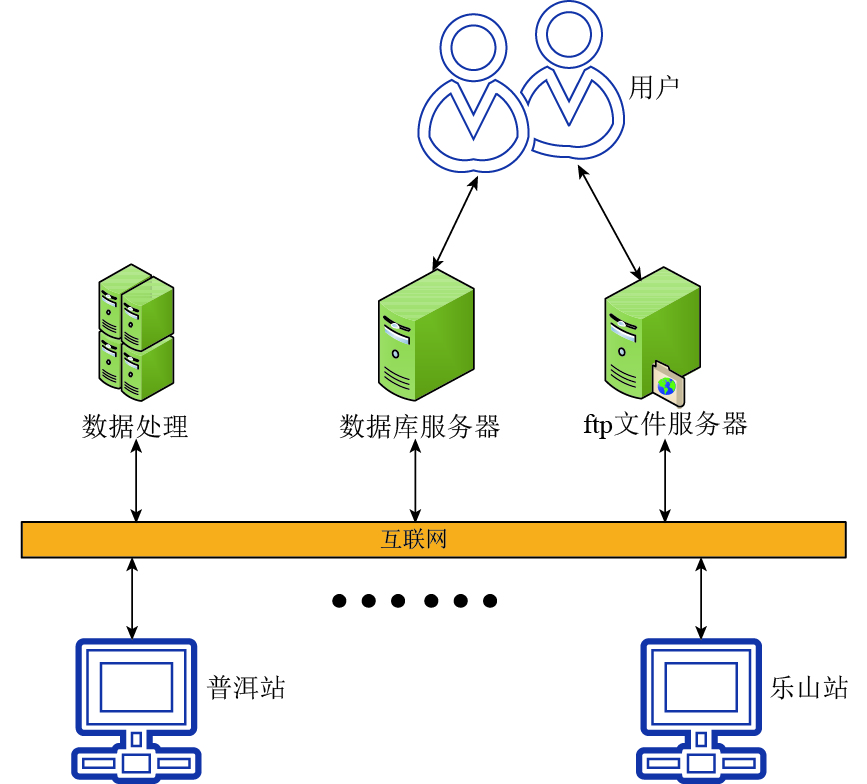
图 2 普洱和乐山电离层垂测站的数据管理系统示意图
Figure 2. Schematic diagram of data management system for ionosonde stations Pu'er and Leshan
![]()
图 5 2015年4月18—27日普洱站和乐山站相关指数及垂测数据
(a)表征太阳活动情况的F10.7指数,表征磁暴事件的KP和Dst指数,以及表征亚暴事件的AE指数,图中红线表示有事件活动的界限;(b)上图为普洱站垂测数据,如观测值连续2小时以上超出阈值,则用观测值与阈值相减,得到下图的差值图;(c)上图为乐山站垂测数据,下图为差值图,说明同图(b)
Figure 5. Ionosonde data and index for the stations Pu'er and Leshan from 18 to 27 April, 2015
(a) F10.7 index characterizing the solar activity, index KP and Dst characterizing the magnetic storm event, and AE index characterizing the substorm event, in which the red line represents the threshold. (b) The upper panel is the ionosonde data for Pu'er station where red, black, and blue lines denote observation, median, and threshold value, respectively. If the observation data exceed the threshold for more than two hours, the difference between observation and threshold data are obtained as shown in the lower panel, in which red points represent positive anomalies, and black points represent negative anomalies. (c) The upper panel is the ionosonde data for Leshan station, and anomalies are got in the lower panel, illustrations are the same as Fig.(b)
![]()
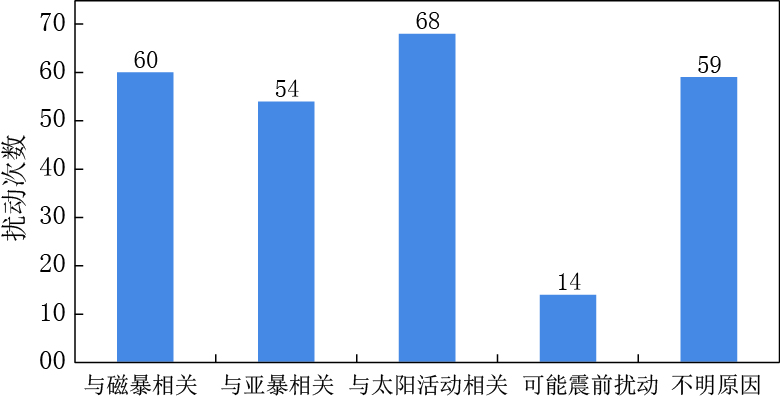
图 6 垂测数据扰动及其与各类事件的对应次数
Figure 6. Numbers of ionosonde disturbance corresponding to several kinds of events
表 1 普洱站和乐山站不同阈值条件下各类事件的R值、扰动提取比值及空报率
Table 1 R value, disturbance ratio and false rate of forecast for different thresholds at the stations Pu'er and Leshan
阈值 R值 扰动提取比值 空报率 普洱 乐山 普洱 乐山 普洱 乐山 太阳活动 M±IQR -0.0179 0.0914 32.00% 41.67% 0.3379 0.3253 磁暴 0.0984 0.2760 39.84% 53.85% 0.3000 0.2625 亚暴 0.0186 0.2881 34.75% 52.00% 0.3289 0.2319 太阳活动 M±1.5IQR -0.0599 0.0425 8.00% 13.89% 0.1399 0.0964 磁暴 0.0490 -0.0481 16.26% 7.69% 0.1136 0.1250 亚暴 0.0067 0.0186 13.56% 12.00% 0.1289 0.1014 太阳活动 M±2IQR 0.0020 0.0592 6.00% 8.33% 0.0580 0.0241 磁暴 0.0358 0.0519 8.13% 7.69% 0.0455 0.0250 亚暴 -0.0114 0.0655 5.08% 8.00% 0.0622 0.0145 太阳活动 M±σ -0.0797 -0.0311 48.00% 58.33% 0.5597 0.6145 磁暴 0.0961 0.2061 60.98% 74.35% 0.5136 0.5375 亚暴 0.0042 0.1983 55.08% 72.00% 0.5467 0.5217 太阳活动 M±1.5σ -0.0335 0.0321 26.00% 33.33% 0.2935 0.3012 磁暴 0.1077 0.1478 35.77% 41.03% 0.2500 0.2625 亚暴 0.1343 0.2226 32.20% 44.00% 0.1877 0.2174 太阳活动 M±2σ -0.0365 0.0305 10.00% 13.89% 0.1365 0.1084 磁暴 0.0743 -0.0224 17.89% 10.26% 0.1045 0.1250 亚暴 0.0325 0.1075 15.25% 18.00% 0.1200 0.0725 太阳活动 75% -0.0474 -0.0646 70.00% 69.44% 0.7474 0.7590 磁暴 25% 0.0877 0.0442 79.67% 76.92% 0.7091 0.7250 亚暴 -0.0179 0.0354 72.88% 76.00% 0.7467 0.7246 太阳活动 80% -0.0626 -0.1275 62.00% 58.33% 0.6826 0.7108 磁暴 20% 0.1035 0.1061 73.98% 74.36% 0.6364 0.6375 亚暴 0.0069 0.0823 67.80% 72.00% 0.6711 0.6377 太阳活动 90% -0.1920 -0.0402 18.00% 33.33% 0.3720 0.3735 磁暴 10% 0.1481 0.1490 43.90% 46.15% 0.2909 0.3125 亚暴 0.0311 0.2046 36.44% 48.00% 0.3333 0.2754 注:IQR为四分位距,σ为标准差.  下载: 导出CSV
-


计量
- 文章访问数: 552
- HTML全文浏览量: 258
- PDF下载量: 15
