

Strong ground motion simulation for the 2014 MW6.1 Ludian,Yunnan earthquake
-
摘要:
基于震源运动学模型,采用宽频带混合模拟方法,对2014年鲁甸MW6.1地震开展了考虑复杂震源破裂过程的地震动模拟,将代表性场点的模拟结果与实际观测的强震记录进行对比,分析了不同震源模型对场点强地面运动特征影响的差异。结果表明:就震源尺度有限的中等地震而言,地震矩相近的不同震源破裂模型对震中距稍远场点的地震动影响差异相对较小,而对近震源区场点的地震动特征影响差异则较为明显。此外,不同震源模型模拟的地震动参数空间分布结果显示,不同震源模型对地震动的空间分布形态具有显著影响。
Abstract:Based on the intensity and aftershock distribution, researchers unanimously agree that the rupture of the 2014 MW6.1 Ludian, Yunnan earthquake exhibits a certain degree of complexity. Zhang et al (2015) used broadband strong motion records within a 250 km range from the epicenter, along with full waveform data of near-field and far-field broadband body wave data, to invert the rupture process of the Ludian MW6.1 earthquake base on both a single fault model and two intersecting conjugate fault models. Their results indicate that the Ludian MW6.1 earthquake was a complex seismic event, characterized by the successive rupture of two conjugate faults in the northwest and northeast directions. Significant progress has been made in studying the characteristics of strong ground motion related to the Ludian earthquake and associated issues. The existing conclusions about the distribution of seismic parameters in affected region are directly inferred or indirectly synthesized from existing data, yet the seismic characteristics caused by complex seismic source ruptures have not been considered.
To investigate the influence of different rupture process models on ground motion simulation of the MW6.1 Ludian earthquake, a hybrid broadband ground motion simulation method known as the GP method (Graves, Pitraka, 2010) was applied to synthesize acceleration, velocity waveforms, and acceleration response spectra in the near-field area based on kinematic source models. The source models used for comparison in this study are derived from Zhang et al (2015), which includes two single fault rupture models and one intersecting conjugate fault model. The study adopted the crustal velocity structure model of the Yunnan region to calculate the Green’s function.
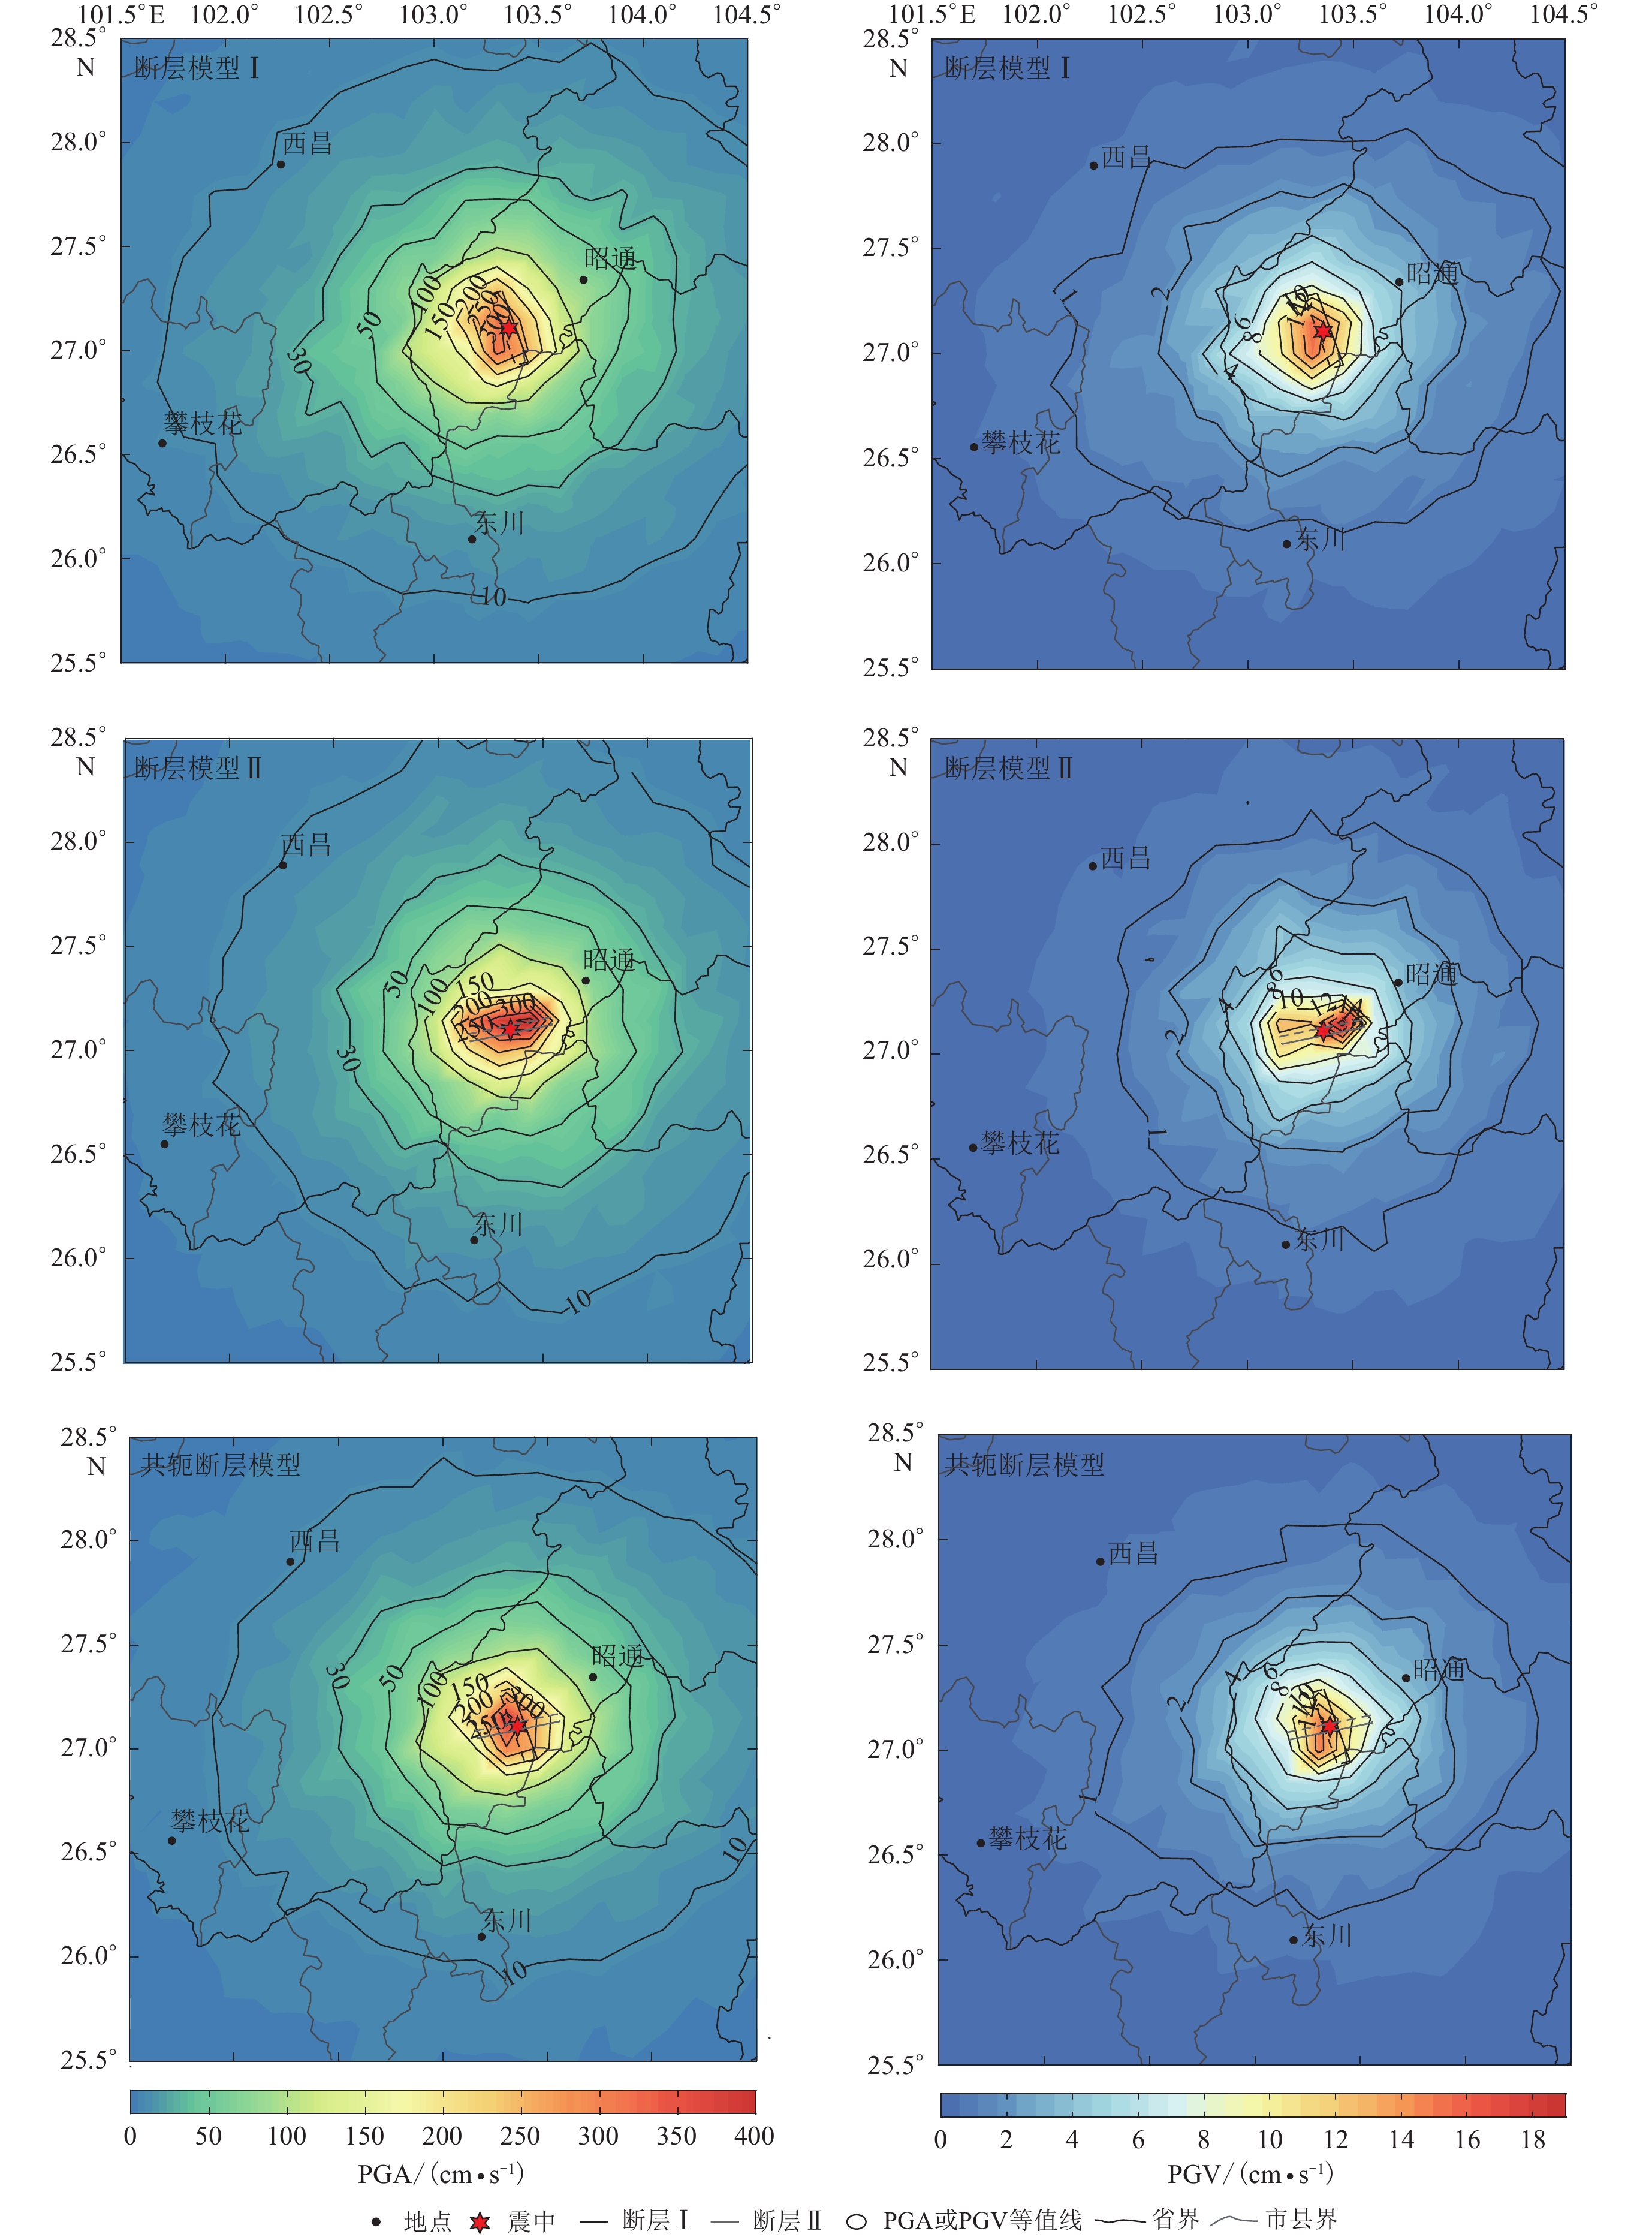
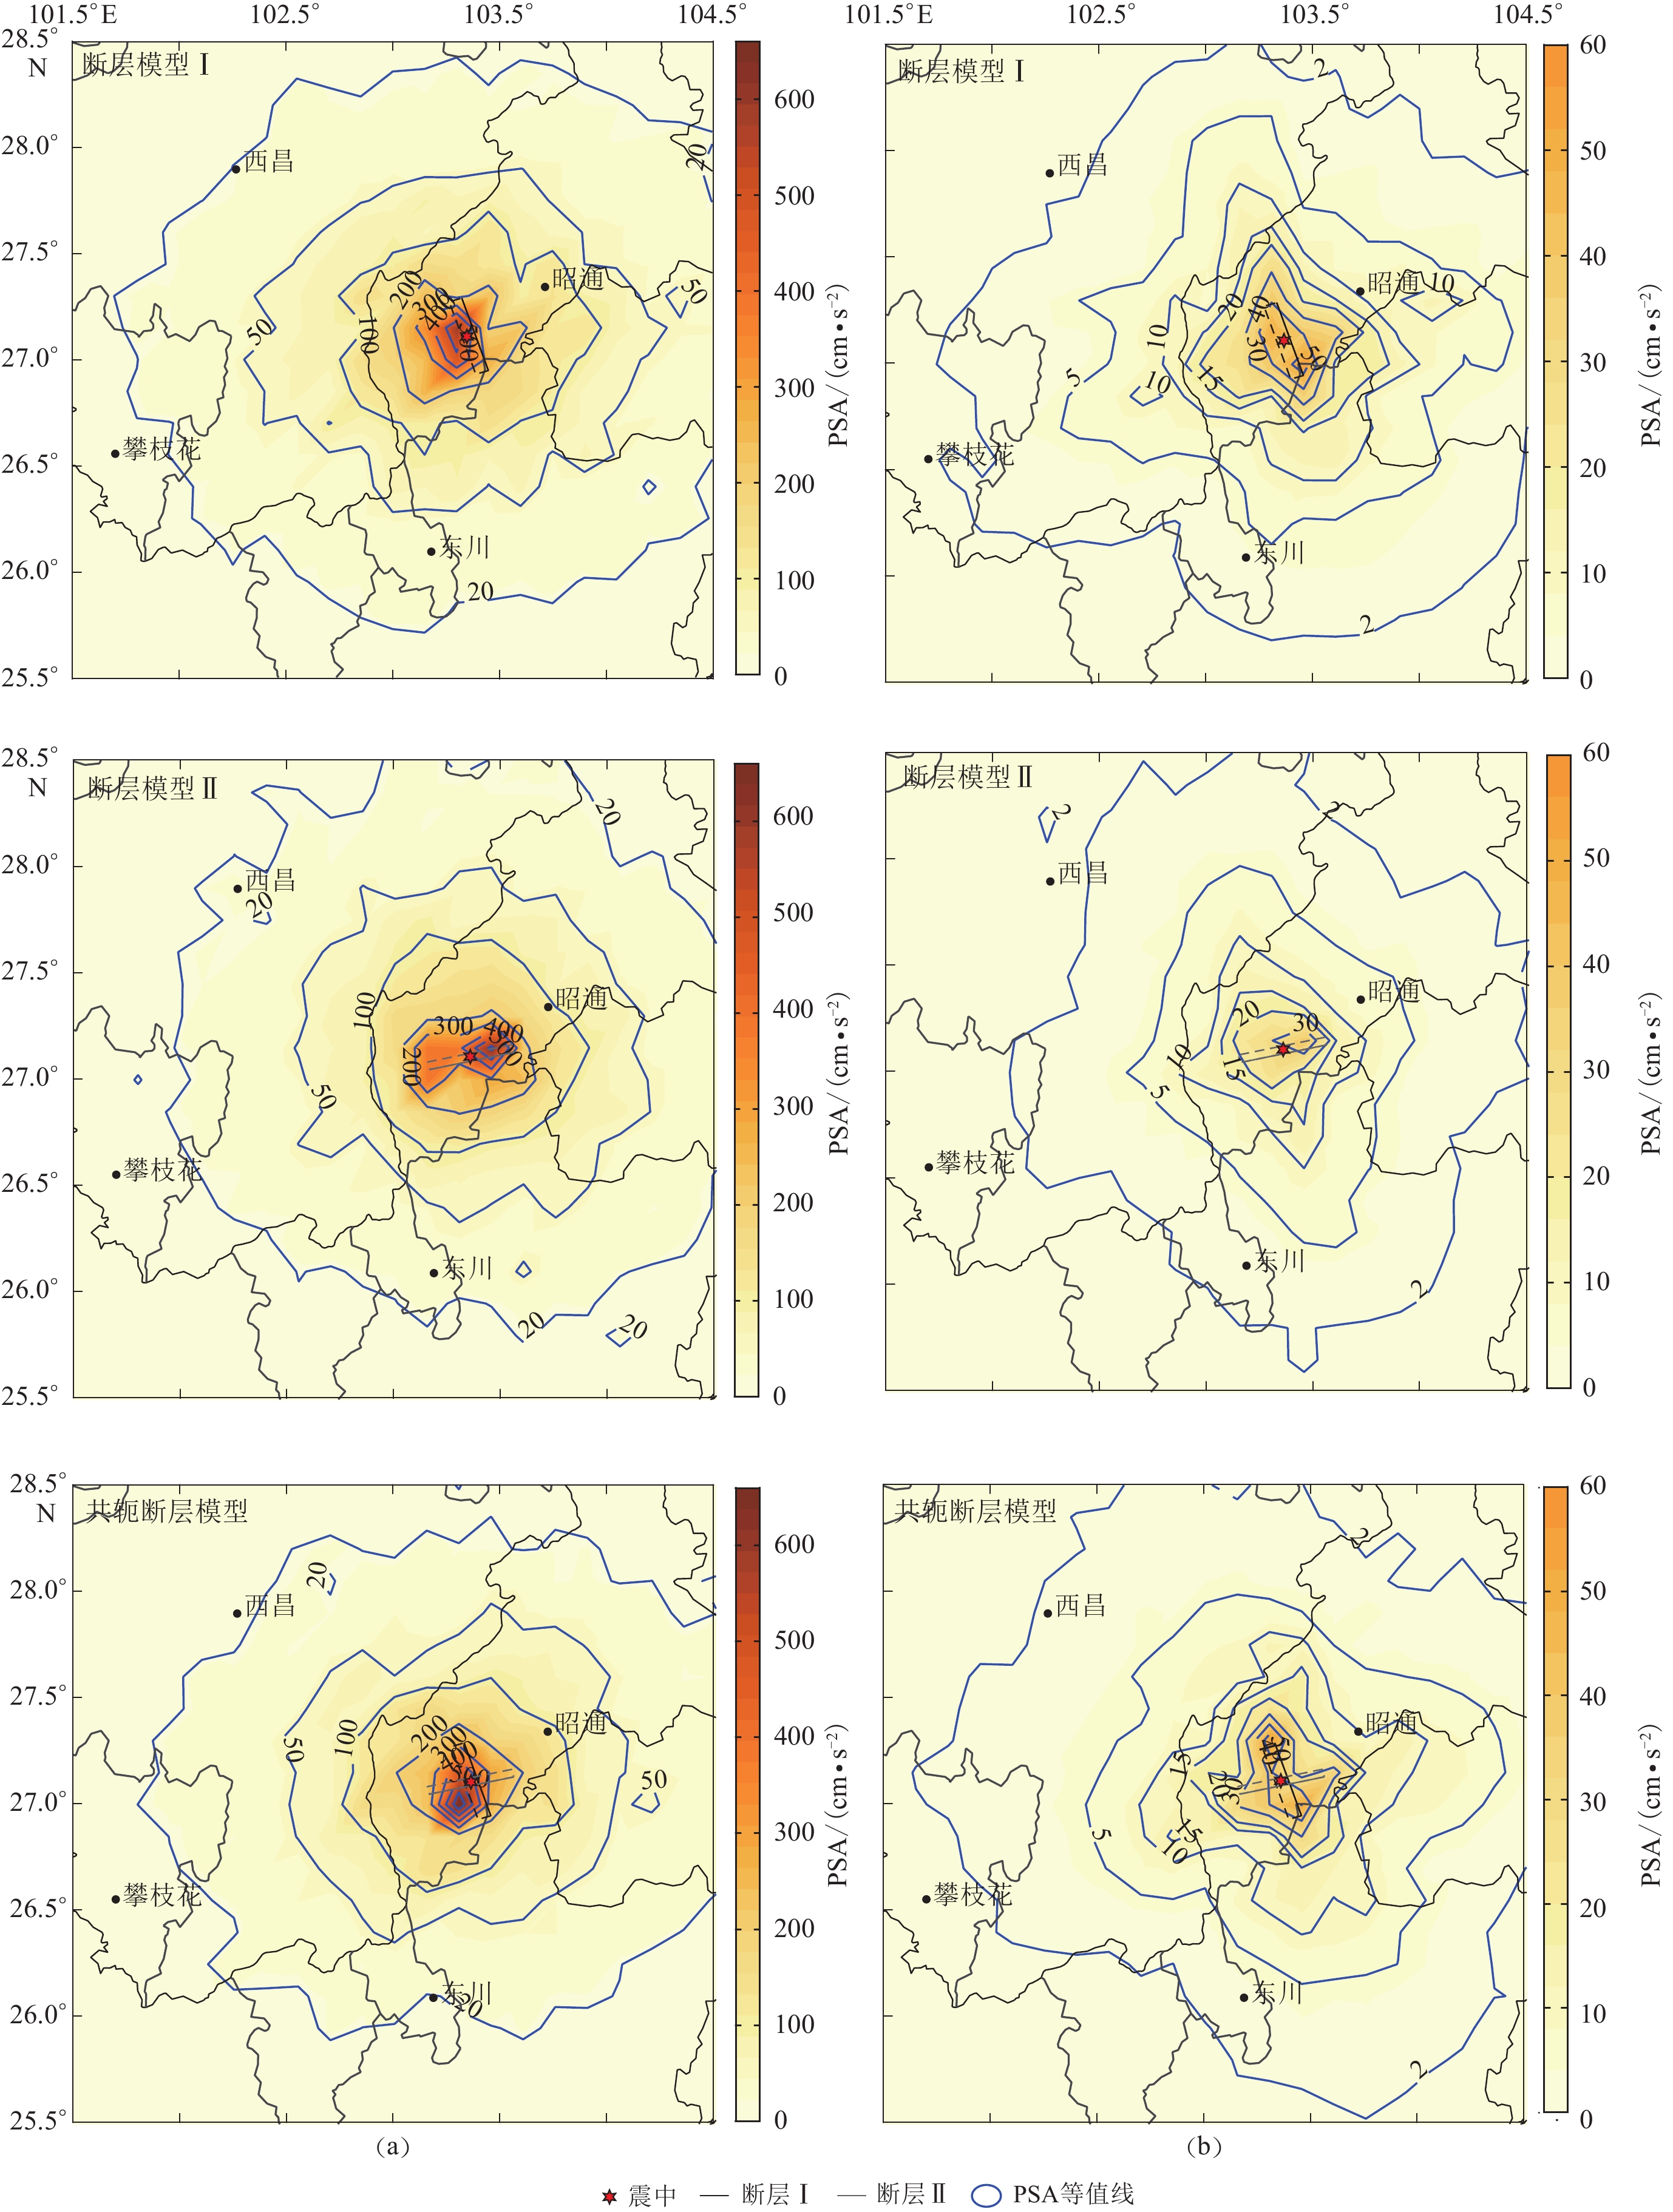
The GP method combines a deterministic approach in the low-frequency range ( f<1 Hz) with a semi-stochastic approach in the high-frequency range ( f >1 Hz). For f<1 Hz, this methodology allows for a theoretically rigorous representation of fault rupture and wave propagation effects, to generate ground motion waveforms and amplitudes. In contrast, high-frequency ( f >1 Hz) ground motions are modeled through random source radiation, simplified theoretical wave propagation, and scattering effects.Simulation results for representative sites were compared with observed strong motion recordings, and the impacts of three different source rupture models on strong ground motions were analyzed. The results demonstrate that for moderate earthquakes with limited fault dimensions, differences in strong ground motion characoncernedcteristics among different source rupture models with similar seismic moments are not pronounced in far fields but are distinct in near-fields. Additionally, the distributions of intensity measurements of ground motions are provided, and it is found that the simulation results based on the conjugate fault model are more consistent with the field-surveyed macroseismic intensity of MW6.1 Ludian earthquake, Yunnan in 2014. This indicates that the source rupture model plays a crucial role in the spatial distribution pattern of strong ground motions and their characteristics. Therefore, elaborate source rupture models are of great value for reasonably estimating the peak ground acceleration, peak ground velocity, frequency spectrum, duration, and time history of seismic motion in the near-source area, as well as assessing seismic hazard in area.
This article reveals the influence of complex focal rupture processes on the characteristics and spatial distribution of strong ground motion.
-
引 言
高烈度山区斜坡稳定性问题突出,在地震作用下,研究地质构造和地层结构与滑坡触发机制的关系具有重要意义。我国西部地区地震滑坡等地质灾害极为发育,“5·12”汶川特大地震触发了超过19万7 000处滑坡、崩塌等地质灾害(许冲等,2013),造成近三万余人遇难,约占总遇难人数的1/3 (黄润秋,2011)。汶川地震之后,大量学者对强震诱发滑坡的成因及其形成机制开展了研究:通过遥感解译和现场调查发现大型滑坡与发震断层瞬间的错动密切相关(黄润秋等,2009;许强,李为乐,2010),而断层上盘效应是触发高速远程滑坡的主要原因(汤明高等,2011);李强等(2019)对2017年九寨沟MS7.0地震中的地震滑坡分布特征开展分析,揭示了滑坡分布存在明显的断层效应;2022年泸定MS6.8地震中,地震滑坡分布与距断层的距离密切相关,滑坡主要分布在断层1 km范围内,若距离超过1 km则滑坡分布密度显著降低(范宣梅等,2022)。可见,断层与地震的滑坡成因具有密切联系。
典型地震滑坡研究表明,地震易诱发滑坡后缘形成陡倾的拉张破坏(Wang et al,2019)。青川东河口高速远程滑坡启动区的断层破碎带以及力学性质较差的千枚岩、板岩的存在,均对该滑坡的启动有着显著影响(孙萍等,2009)。刘家湾滑坡不同岩性组合斜坡具有明显的差异特性,软硬岩层交界面的动力突变效应耦合凸出地形是导致斜坡破坏的主要原因(何源等,2015;Luo et al,2021)。大量振动台试验揭示,在水平向地震波作用下上硬下软组合斜坡比上软下硬组合斜坡对加速度的放大程度更大(许强等,2010)。有限元分析表明,软弱夹层使坡体出现了局部放大效应,动力响应具有软岩大于硬岩、层状大于均质的特点(宋丹青等,2021)。地震作用下对某软硬互层斜坡的研究表明,软岩是坡体变形破坏的优势拉裂区域,在强震的应力挤压作用下,坡体内强风化千枚岩因其质软而变形强烈,有向外剪出的趋势(刘云鹏等,2012)。岩质斜坡稳定性受地层层面和节理面密度的控制,滑动面常为后缘节理面和软弱夹层的贯通面,地震时易沿软弱夹层和后缘节理贯通面发生破坏,如孙家滑坡、大竹坪滑坡等(刘新荣等,2019;谭明健等,2022)。以上研究表明,不同物理力学性质的岩性组合是诱发地震滑坡的重要因素。
受“5·12”汶川强震作用,青川县石坝乡刨地里形成了多处同震滑坡。本文拟以刨地里滑坡为研究对象,通过调查该滑坡发育特征构建地质模型,并结合数值模拟对其放大效应特征和变形破坏过程开展深入研究,对滑坡成因机制开展探讨,以期为同类地震滑坡分析提供有价值的参考。
1. 研究区地质概况
研究区位于四川省青川县石坝乡(图1),处于龙门山系北段,区域山脉走向与地质构造走向基本一致,大多呈NE—SW向,所在地层为寒武系下统邱家河组(Єq),岩性为深灰色千枚岩夹硅质岩。研究区内的石坎断层走向NE—SW,断层面产状为283°∠23°,可见断层泥,夹有少量假玄武玻璃和断层角砾岩,新鲜断层泥呈灰白色,稍湿,风化后呈深灰色,主要成分为方解石和黏土矿物。断层两侧岩性为薄层状千枚岩,并发育大量褶皱,总体上产状较平缓,局部可见钙华和碎裂岩体崩塌。
![]() 图 1 刨地里滑坡地理位置图(修改自黄润秋等,2009)Figure 1. Geographical location map of Paodili landslide (modified from Huang et al,2009)
图 1 刨地里滑坡地理位置图(修改自黄润秋等,2009)Figure 1. Geographical location map of Paodili landslide (modified from Huang et al,2009)2. 滑坡基本特征
刨地里地震滑坡共3处(图2),发育特征如下:1号滑坡位于图幅北侧,后缘高程约1 326 m,坡脚高程约1 050 m,高差约276 m,滑坡长约为750 m,宽约为350 m,平均厚度约为25 m,堆积方量约为1.84×10⁶ m3,地震发生时滑坡向南侧滑动,滑体运动距离约为250 m。滑坡后部高陡,坡度为35°—45°,中部坡度约为30°,前部堆积体较厚而坡度平缓,为10°—20°,滑坡地形具有上陡下缓的特征。2号滑坡位于南侧,后缘高程约1 280 m,坡脚高程约1 075 m,高差约205 m,坡角约34°,滑坡长约为450 m,宽约为200 m,平均厚度约为12 m,堆积方量约为2.4×10⁵ m3,地震发生时滑坡向北东侧滑动。3号滑坡位于东侧,平面形态呈舌型,后缘高程约为1 210 m,坡脚高程约为1 090 m,滑坡长约为230 m,宽约为100 m,平均厚度为6 m,堆积方量约3.5×10⁴ m3,地震发生时滑坡向南西侧滑动。
根据滑坡的发育、运动及堆积特征,将1号滑坡分为滑源区和堆积区(图2),其中堆积区又可分为硅质岩堆积区和千枚岩堆积区两个亚区。各区特征如下:
1) 滑源区。出露高程1 200—1 350 m,滑源区长约200 m,宽约200 m,地形坡度为40°—45°。顶部岩性出露为厚层状硅质岩(图3a,b),质地坚硬。岩层产状332°∠5°,两组节理面产状分别为68°∠81°和150°∠53°。下部岩性出露为土黄色薄层状千枚岩(图3c),节理裂隙发育,岩体力学性质较差,产状为338°∠8°。大量硅质岩巨石在此区堆积(图3d),块径多为5 m×4 m×3 m,平整面多为节理面,表面擦痕清晰,破裂的岩块、碎块尚可拼合。石坎断层贯穿滑源区,带内可见断层角砾岩,呈碎裂状。结合现场调查和已有资料,未发现研究区内在汶川地震期间存在地表破裂。
![]() 图 3 刨地里滑坡发育分布与堆积特征(a) 硅质岩;(b) 擦痕;(c) 千枚岩;(d) 滑源区巨块石;(e) 硅质岩堆积区;(f) 假基岩体Figure 3. Distribution and accumulation characteristics of Paodili landslide(a) Siliceous rock;(b) Scratches;(c) Phyllite;(d) Large block stones in the sliding source area; (e) Siliceous rock accumulation area;(f) Pseudobasic rock mass
图 3 刨地里滑坡发育分布与堆积特征(a) 硅质岩;(b) 擦痕;(c) 千枚岩;(d) 滑源区巨块石;(e) 硅质岩堆积区;(f) 假基岩体Figure 3. Distribution and accumulation characteristics of Paodili landslide(a) Siliceous rock;(b) Scratches;(c) Phyllite;(d) Large block stones in the sliding source area; (e) Siliceous rock accumulation area;(f) Pseudobasic rock mass2) 硅质岩堆积区。位于堆积区后侧,区域内由大量裂解的硅质岩块组成(图3e),块径多为1 m×0.6 m×0.5 m,明显小于滑源区的硅质岩大块石。
3) 千枚岩堆积区。位于堆积体前侧,物质组成主要为千枚岩块石,粒径范围1—25 cm,自滑源区方向碎块石粒径由大变小。可见数座小型假基岩,部分产状50°∠21°,25°∠38°,150°∠50°,与滑床产状差异较大。新鲜面形态不规整,推测为原斜坡的裂隙,其中典型的一座长宽高各约为15 m×10 m×8 m,与底部的板岩堆积体分界清晰(图3f)。
2号滑坡滑源区可见多级台坎分布,出露岩性为中风化千枚岩,产状313°∠40°。表层为第四系黄色黏土夹碎石,碎石呈次棱角状,粒径2—15 cm,下部为千枚岩,节理裂隙发育。2号滑坡堆积区为土黄色黏土夹碎石土。3号滑坡仅可见少量碎石和黏土。2号和3号滑坡与1号滑坡间可见清晰肉红色土体堆积边界,且均覆盖在1号滑坡堆积体之上(图2)。
针对各滑坡体的接触关系及边界行迹的调查表明,1号滑坡先于2号及3号滑坡失稳。下文对地震滑坡的影响因素及失稳过程均以1号滑坡为主进行论述。
3. 影响因素分析
3.1 上硬下软的岩体结构
刨地里1号滑坡为典型的近水平上硬下软结构(图4),其上部为硅质岩,相对坚硬,下部为薄层千枚岩,岩性较软且褶皱发育。受构造作用等影响,斜坡具有复杂的应力史,坡体内褶皱和节理裂隙发育,受风化作用影响岩体物理力学强度进一步弱化。根据振动台物理模拟、数值分析等研究(许强等,2010;宋丹青等,2021),上硬下软岩体组合斜坡在强震作用下斜坡动力响应强烈,对斜坡稳定性极为不利。
3.2 断层影响
研究区内石坎断层为顺扭走滑—逆冲型断层,在南坝地区存在一定的地表破裂(李传友,魏占玉,2009;张伟,2009),但无相关资料及现场证据表明该断层在刨地里附近存在地表破裂。斜坡内断层经过多次活动,断层角砾岩岩体破碎,沿断层带形成地下导水通道,进一步弱化岩体质量,在强震作用下不利于斜坡稳定性(图5a,b)。
![]() 图 5 石坎断层特征(a) 断层面;(b) 断层角砾岩Figure 5. Characteristics of Shikan fault(a) Fault plane;(b) Fault breccia
图 5 石坎断层特征(a) 断层面;(b) 断层角砾岩Figure 5. Characteristics of Shikan fault(a) Fault plane;(b) Fault breccia4. 滑坡失稳过程
由第2节可知,1号滑坡堆积体后侧主要为硅质岩块石,前侧主要为强风化千枚岩及黏土,表明斜坡下部千枚岩首先开始破坏,导致了顶部硅质岩失稳崩塌。失稳过程具体如下:
1) 斜坡地震动强烈放大
上硬下软的地层结构使得下部千枚岩岩体在长期的地质内外动力作用下发育裂隙,形成了斜坡易滑块体(图6a)。一方面,地震发生时岩性分界处产生极大的拉应力和剪应力,导致易滑块体下滑力增大而抗滑力减小(Luo et al,2021)。另一方面,强震动作用使得拉张裂隙向深部延伸,随之在地震动的循环荷载作用下形成贯通结构面,块体失稳下滑(图6b)。
![]() 图 6 刨地里1号滑坡破坏过程演示图(a) 斜坡震动强放大;(b) 下部岩体震裂破坏;(c) 上部岩体失稳滑动;(d) 运动堆积阶段Figure 6. Destruction process demonstration diagram of Paodili 1st landslide(a) Amplification effect of strong vibration on slope;(b) Seismic fracture failure of the lower rock structure;(c) Sliding after instability of the upper rock structure;(d) Motion and accumulation
图 6 刨地里1号滑坡破坏过程演示图(a) 斜坡震动强放大;(b) 下部岩体震裂破坏;(c) 上部岩体失稳滑动;(d) 运动堆积阶段Figure 6. Destruction process demonstration diagram of Paodili 1st landslide(a) Amplification effect of strong vibration on slope;(b) Seismic fracture failure of the lower rock structure;(c) Sliding after instability of the upper rock structure;(d) Motion and accumulation2) 下部岩体震裂破坏—上部岩体失稳滑动
在地震动作用下,软弱千枚岩体震裂破坏,以较高的初速度启动,并沿170°方向运移。顶部的硅质岩在底部失稳后,沿优势破裂面破坏后向下滑动(图6c)。
3) 运动堆积阶段
前侧滑坡体主要由千枚岩组成,部分未解体的大型千枚岩体成为假基岩体堆积于前侧。后侧滑坡体主要由硅质岩组成。1号滑坡体到达沟谷后遇阻(2号和3号滑坡体),受挤压变形后在原地堆积形成滑坡坝,上游形成堰塞湖(图6d)。
5. 数值模拟分析
5.1 离散元模型建立
基于以上定性分析,本节利用1号滑坡工程地质剖面原型建立离散元(universal distinct element code)二维模型(图7)。模型建立方法如下:① 由于刨地里斜坡岩体风化程度具有明显分带性,且地震对斜坡内部的稳定性影响较小(李龙起等,2020),模型按岩体风化程度分为上层风化岩体和下层微新岩体,二者根据岩性可进一步分为硅质岩和千枚岩;② 千枚岩和硅质岩的参数选择分别参考了刘家湾滑坡(距刨地里7.7 km)和唐家山滑坡等资料(曹琰波,2011;黄宇,2015;Luo et al,2021),经岩石力学参数类比后,选用的计算参数列于表1和表2;③ 为了分析滑坡随时间变化的变形破坏特征,模型采用摩尔-库仑(Mohr-Coulomb)屈服准则,单元采用刚性本构模型,滑床采用塑性本构模型和摩尔-库仑屈服准则,结构面均采用库仑滑动准则,底边界设置为黏滞边界,两侧为自由场边界,且对三侧边界进行约束;④ Kuhlemeyer和Lysmer (1973)建议模型划分的最大尺寸(Δl)小于输入地震波最短波长λ的1/10—1/8,才不会导致输入波形失真而造成不必要的误差,综合考虑模型大小和计算精度,本研究将单元网格设置为20 m;⑤ 为了研究斜坡对地震加速度的响应规律,本文设置了监测点D1—D8和基准监测点D0 (图7)。
表 1 岩体力学参数Table 1. Mechanics parameters of rock mass岩性 密度/(kg·m−3) 黏聚力
/MPa内摩擦角
/°体积模量/GPa 剪切模量/GPa 强风化
岩体硅质岩 2 700 2.34 35 39.0 20.00 千枚岩 2 200 0.50 23 9.6 5.76 微新
岩体硅质岩 2 750 2.40 38 39.8 20.60 千枚岩 2 250 0.50 25 9.6 5.92 表 2 结构面力学参数Table 2. Mechanics parameters of structural plane界面 法向刚度/(GPa·m−1) 剪切刚度/(GPa·m−1) 内摩擦角/° 黏聚力/MPa 抗拉强度/MPa 岩层面 2.32 1.33 30 1.23 0.41 节理面 1.90 1.20 29 0.50 0.30 断层面 1.81 0.92 26 0.48 0 5.2 地震波输入
本研究输入地震波采用距离研究区最近的石井台站记录的汶川地震数据,取其地震能量集中段50—115 s共长65 s,将加速度时程转化为速度时程后从底部输入模型(图8)。
![]() 图 8 汶川地震广元石井监测台站速度时程Figure 8. Velocity time history of Guangyuan Shijing monitoring station for Wenchuan earthquake
图 8 汶川地震广元石井监测台站速度时程Figure 8. Velocity time history of Guangyuan Shijing monitoring station for Wenchuan earthquake输入地震动力荷载后,最大不平衡力随时间的变化曲线如图9所示。由图可见,系统最大不平衡力在18—35 s保持在较高值,其中在22 s时达到最大值139.89 MPa,45 s后变得很小,50 s后趋近于0,表明基本达到稳定,计算收敛。
![]() 图 9 最大不平衡力时间变化曲线Figure 9. The variation curve of the maximum unbalanced force changing with time
图 9 最大不平衡力时间变化曲线Figure 9. The variation curve of the maximum unbalanced force changing with time5.3 加速度放大效应研究
经模拟发现,模型在4 s后开始变形,取0—3.5 s的数据进行分析。以监测点D0为参考点,定义PGA放大系数A为斜坡内监测点(D1—D8)与参考监测点(D0)加速度反应谱峰值之比,得到放大系数曲线(图10)。
取水平向与竖直向的平均值对比分析不同部位的放大效应,模拟结果如图10所示:① 各监测点的水平向放大系数总体上略大于竖直向。② 斜坡底部D6—D7的放大系数在1.3—2.0,上部D1—D5的放大系数在3.3—6.79,斜坡底部放大效应远低于上部。③ 硅质岩中D1,D2的放大系数分别为4.16和3.96;千枚岩中D3,D4,D5的放大系数分别为4.11,6.79,3.81。④ 岩性变化处(D2和D3)存在动力突变,断层带附近的D4放大系数最大,达到了6.79。
5.4 破坏运动过程模拟
经计算,汶川地震引起的刨地里1号滑坡从4 s开始出现大量裂隙并开始破坏,在33 s时破坏基本完成,整个变形破坏过程如图11a-e所示:
![]() 图 11 模型及其各时间点的运动状态Figure 11. The model and its motion state at each time point(a) t=7 s;(b) t=14 s;(c) t=20 s;(d) t=27 s;(e) t=33 s;(f) t=60 s
图 11 模型及其各时间点的运动状态Figure 11. The model and its motion state at each time point(a) t=7 s;(b) t=14 s;(c) t=20 s;(d) t=27 s;(e) t=33 s;(f) t=60 s4—7 s:首先在千枚岩尤其是陡缓交界处沿82°陡倾节理面形成大而深的拉张裂缝,并有向临空面挤出的趋势,顶部硅质岩裂缝自下向上延伸,受地震动持续作用和模型底部失稳的影响,具有向下坐落的趋势。7—14 s:坡体中上部裂缝持续发育,顶部硅质岩沿68°节理面向下剪切滑移,失稳的千枚岩从断层处自上而下拉裂解体,向外挤出。14—20 s:硅质岩和千枚岩快速溃滑,向下滚动跳跃。底部千枚岩裂隙沿已有结构面发育并逐渐贯通,整体未失稳,表层强风化岩体在滚石的带动下向下滑移。20—27 s:滚动的岩体势能转为动能,到达沟谷后向上爬升,前缘小碎石越过山脊向远处抛射。随着地震动能量的增大,中下部岩体开始产生裂隙并沿层面滑动,位移量约为1.5 m。27—33 s:大部分块石动能耗尽后堆积于沟谷,小碎石经弹跳后飞跃出模型。顶部残余的硅质岩块向下崩落,坡体不断有滚石滑动堆积于坡脚。33—60 s:堆积体基本稳定。通过与现场调查资料对比可以得出,模拟运动结果与滑坡堆积现状具有较好的一致性。
5.5 模拟结果分析
离散元数值模拟结果显示,刨地里滑坡放大效应最强处位于斜坡中上部,且在软硬岩性变化处存在动力突变效应。D4和D5位于断层带附近,由于地震波在断层面、风化带和斜坡表面的不断反射,具有复杂的动力响应,使得放大效应更强。数值模拟运动分析表明,在地震发生4 s时,1号滑坡千枚岩内部产生微破裂和变形,并向外挤出、滑移,顶部硅质岩失稳后沿节理面拉裂—滑移,整体失稳向下溃滑。岩体在向下滑动的过程中推动了中下部表层岩体滑动,使得堆积体前侧为千枚岩,后侧为硅质岩,模拟结果也与实际调查情况相符。
综上所述,通过对D4与D5的PGA加速度对比,发现断层上盘监测点放大效应强于下盘监测点,在断层带附近的D4动力放大效应最为强烈。断层带附近的千枚岩动力响应最为强烈,导致斜坡从断层带附近开始变形破坏。
值得注意的是,地震震中距刨地里滑坡和石井强震台站分别为216 km和268.5 km,滑坡更接近震中,因此刨地里滑坡实际的地震烈度应高于本次模拟。本文的数值模拟结果较好地反演了1号滑坡的破坏过程,其运动过程主要发生在前33 s,这也能合理地解释为何1号滑坡变形破坏时间早于2号滑坡。
6. 讨论与结论
地震滑坡具有复杂的动力响应特征,其成因机制常与不同的岩性组合和断层影响密切相关(许强,李为乐,2010)。虽然已有学者对不同岩性组合滑坡的成因机制开展了大量研究,但对上硬下软且含断层的地震滑坡研究较少。本文刨地里滑坡为这一类典型滑坡,现场调查表明,1号滑坡堆积区可分为前侧千枚岩区和后侧硅质岩区,表明斜坡下部千枚岩先于顶部硅质岩失稳,而上硬下软的岩体结构耦合断层影响是导致这一结果的主要原因。数值模拟显示断层带附近千枚岩首先沿陡倾面产生拉裂破坏,随后“上硬”硅质岩体产生拉裂破坏,“下软”千枚岩失稳后并导致“上硬”硅质岩失稳,结果与现场调查堆积物特征相吻合。
通过对各滑坡堆积体的接触方式和形状调查,以及对1号滑坡的数值模拟运动分析,揭示了刨地里各滑坡的形成先后期次首先为1号滑坡,其次为2号滑坡和3号滑坡。受前缘地形阻挡及2号、3号滑坡堆积挤压等影响,刨地里1号滑坡未形成高速远程碎屑流滑坡。
基于现场调查及分析,并结合数值模拟中各监测点的放大效应及破坏运动特征,获得的主要认识和结论如下:
1) 通过野外调查,揭示了刨地里1号滑坡具有近水平上硬下软的地层结构,斜坡节理裂隙发育,为强震诱发滑坡提供了有利的条件。与此同时,断层带穿越1号滑坡后缘较软的千枚岩。上硬下软的坡体结构与断层带对该滑坡动力响应、变形破坏起到了控制作用。
2) 数值模拟分析表明1号斜坡变形破坏持续时间约33 s,其过程可大致分为4个阶段: ① 斜坡断层带附近强动力放大效应阶段;② 断层带附近千枚岩震裂变形破坏阶段;③ 断层带上部硬质岩体失稳滑动阶段;④ 后缘整体滑动破坏并推动下部浅表滑动堆积阶段。
3) 对1号斜坡加速度的放大效应研究表明,斜坡下部的千枚岩尤其是断层带附近的千枚岩内放大系数达到最大值6.79,导致了斜坡变形破坏首先从断层带处的千枚岩开始。
-
![]()
图 10 三个震源模型模拟的加速度反应谱(PSA)在周期0.5 s (a)和1.5 s (b)时的分布
Figure 10. Distributions of simulated pseudo-spectral acceleration (PSA) at period of 0.5 s (a) and 1.5 s (b) that from three source fault models
![]()
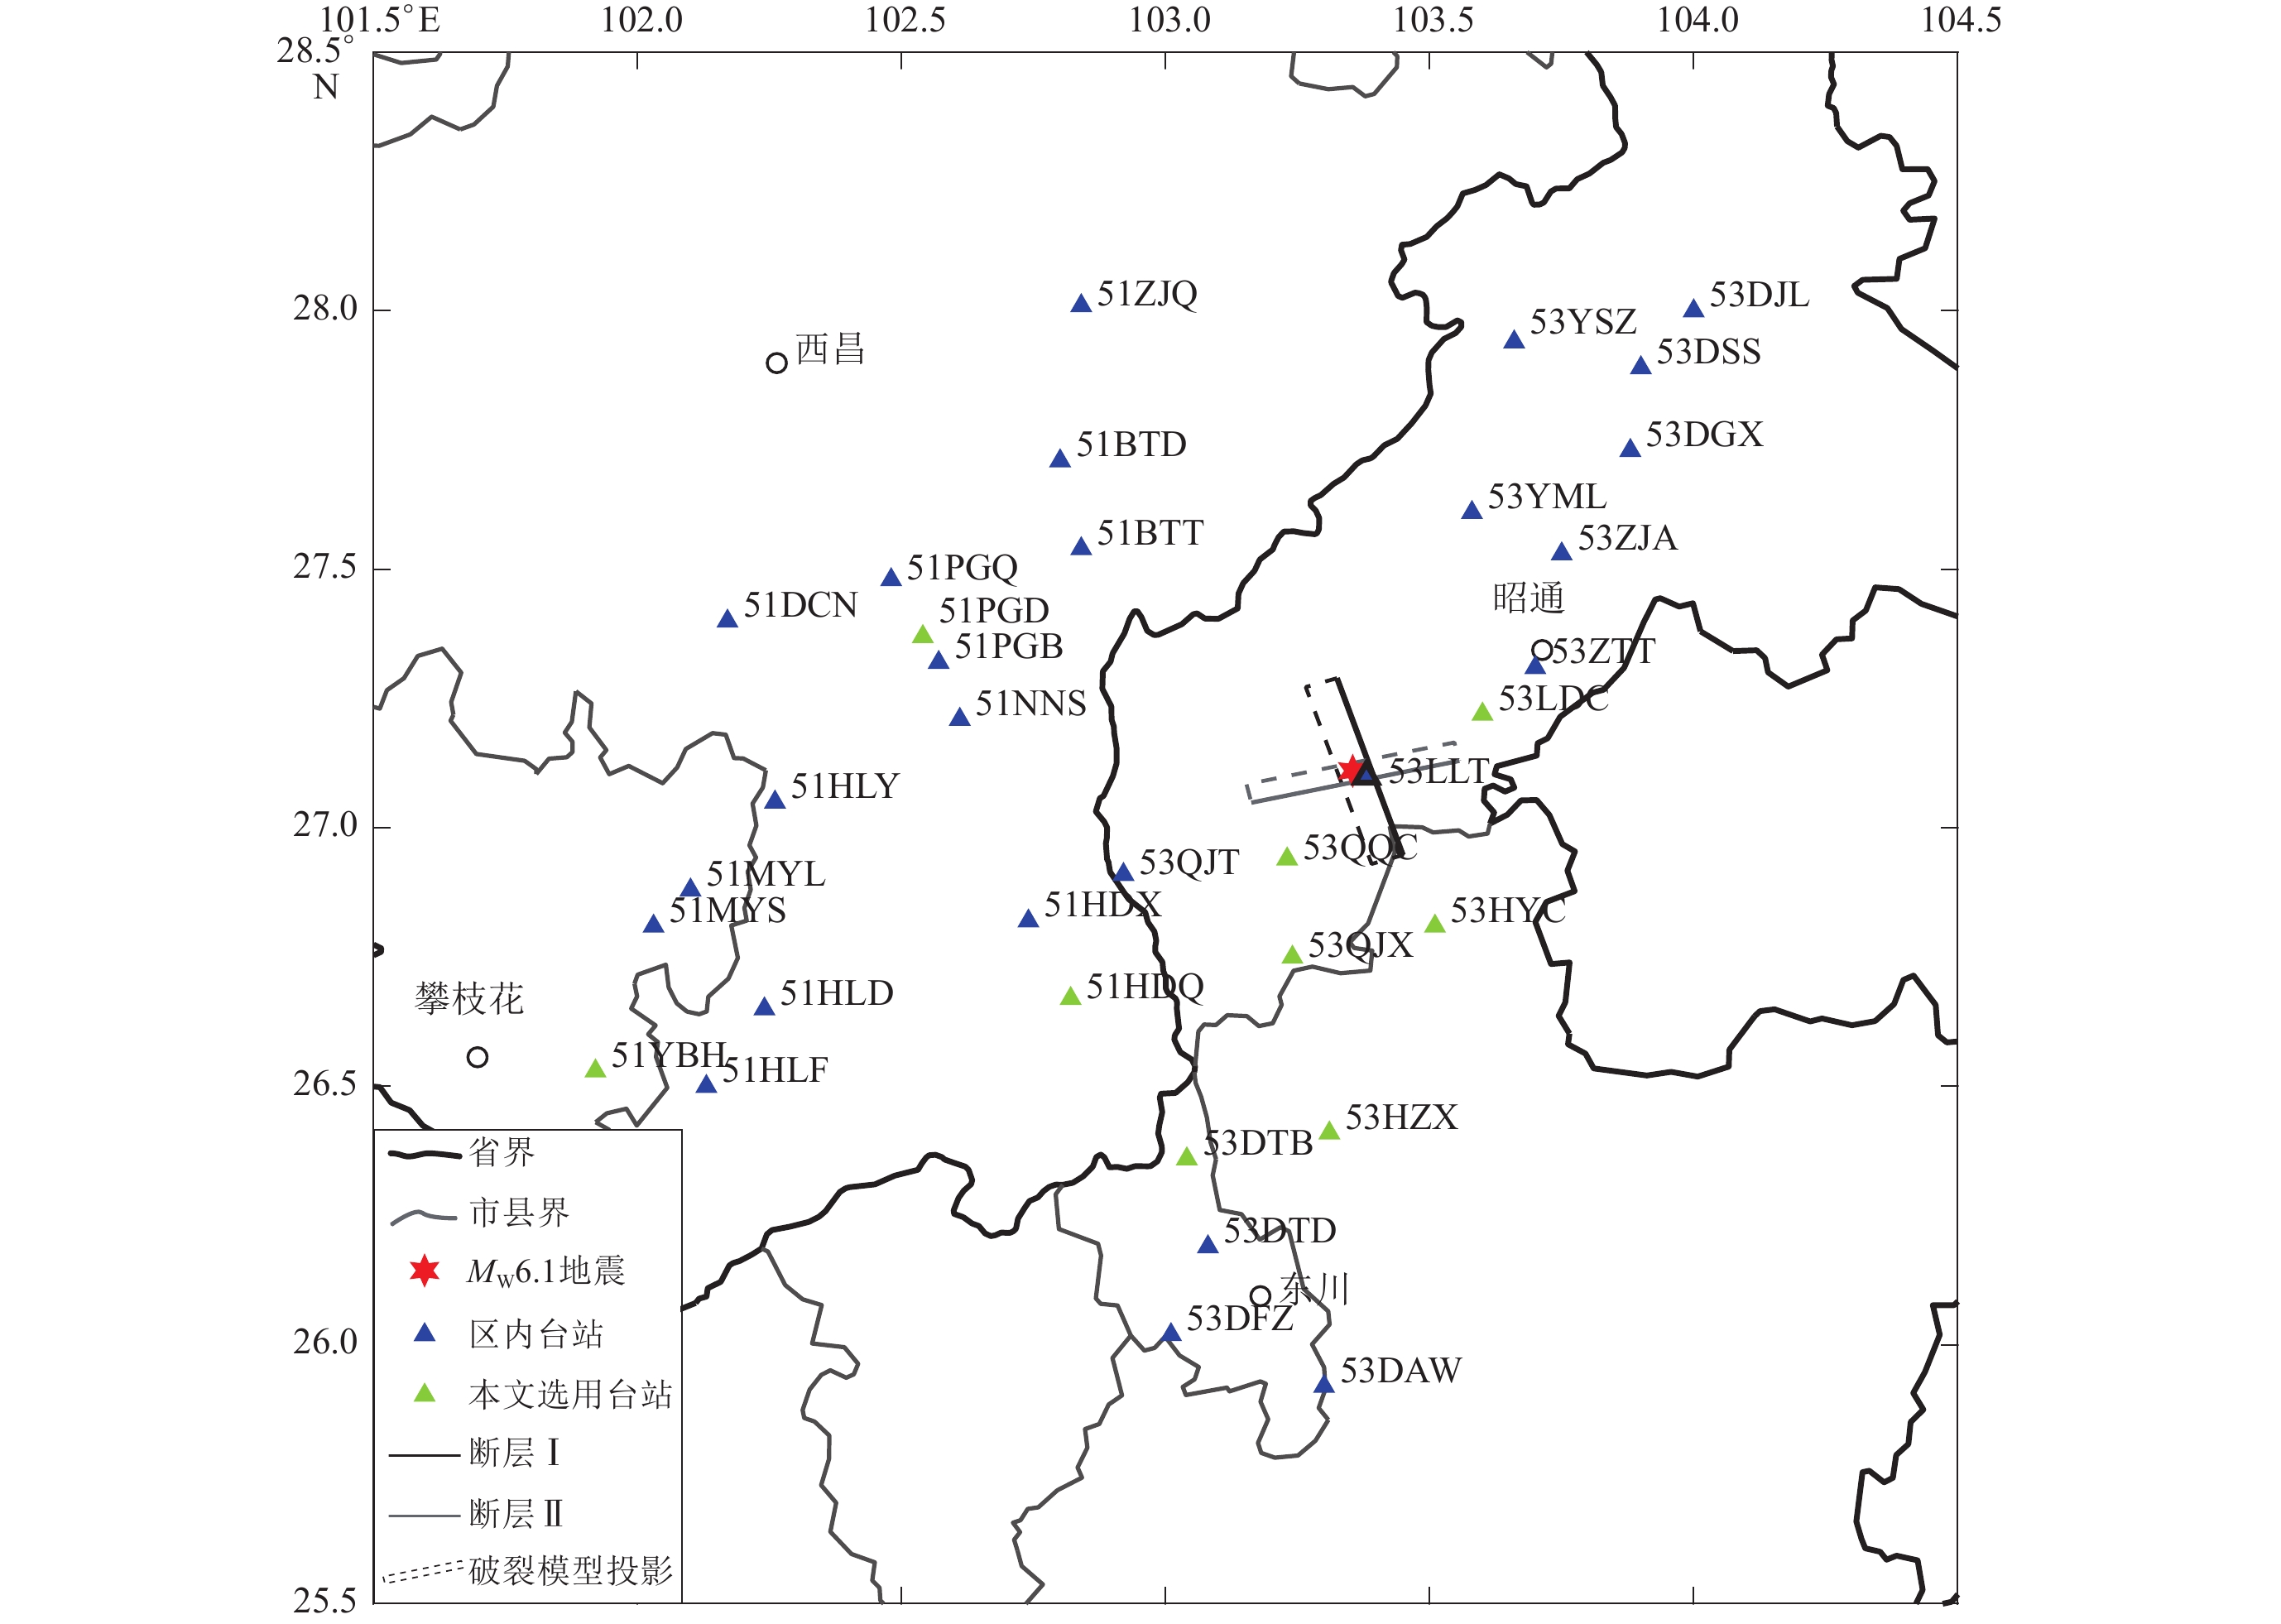
图 1 鲁甸地震研究区域内断层面投影及台站位置
Figure 1. Fault plane projection and station location of Ludian earthquake in the study region
![]()
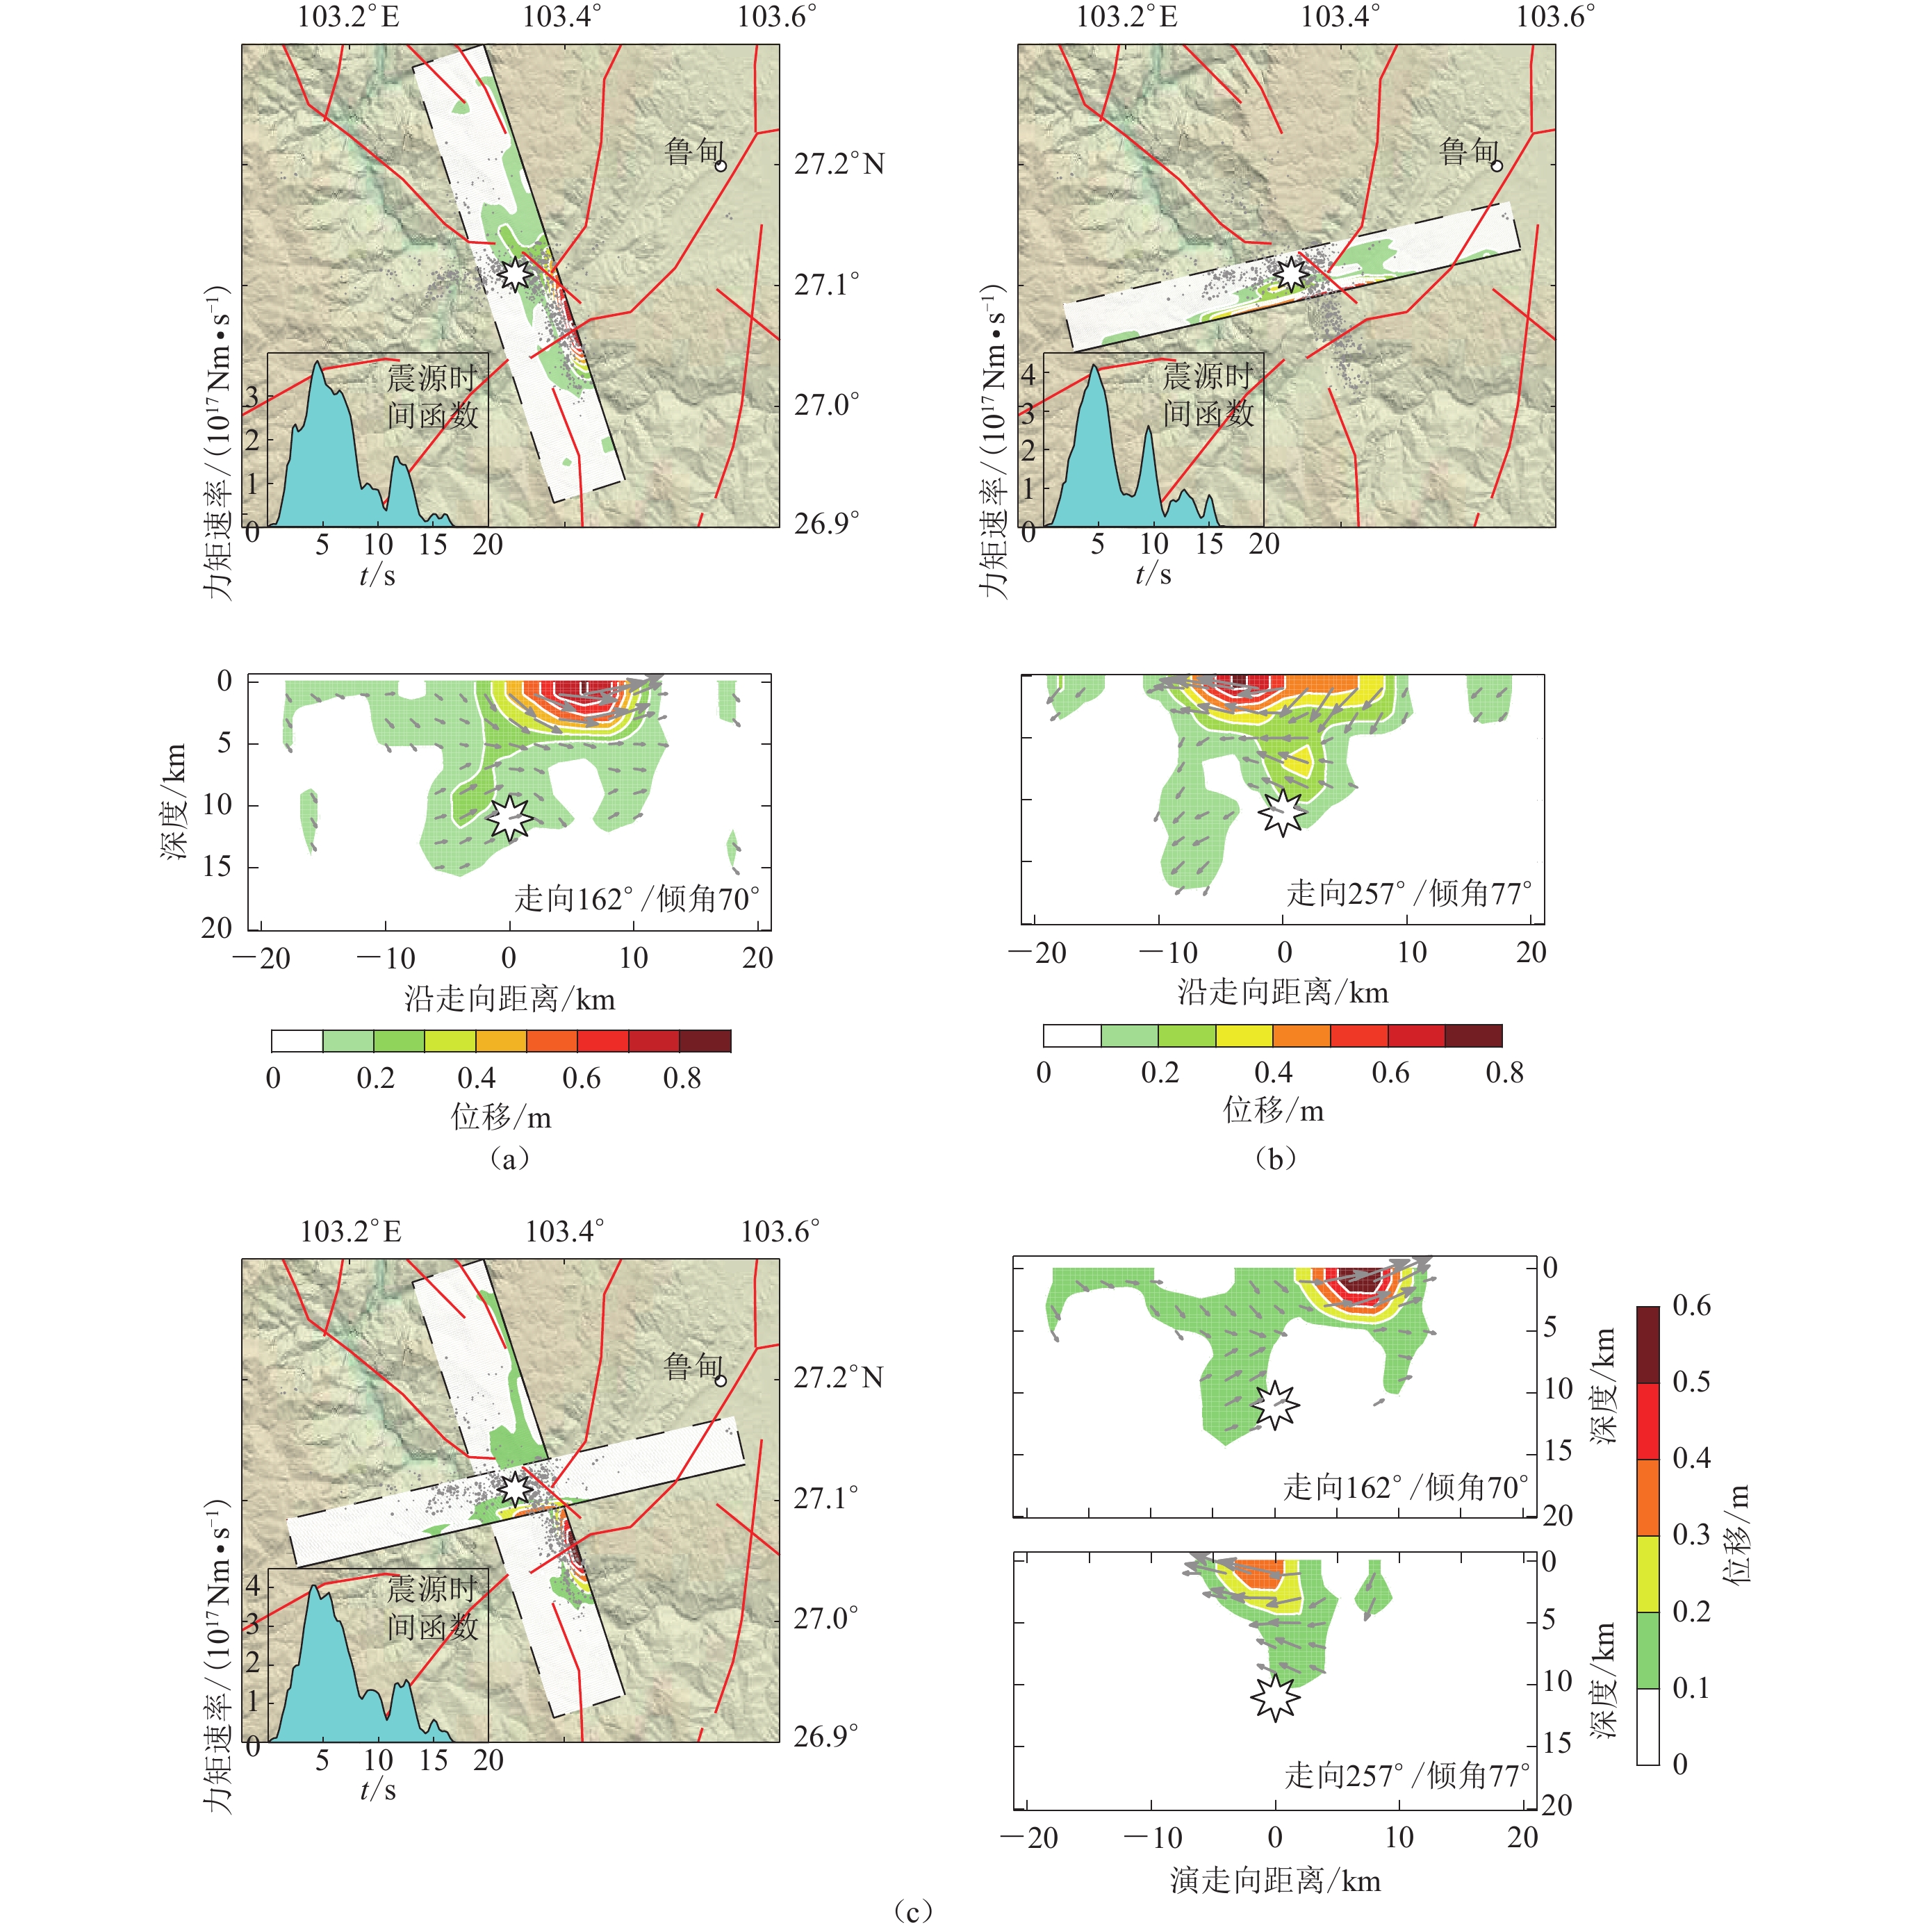
图 2 断层Ⅰ(a)、断层Ⅱ(b)及共轭复合断层(c)的震源模型(张勇等,2015)
Figure 2. Geometry,source time function and final slip distributions of source faultⅠmodel (a),fault Ⅱ model (b) and conjugated fault model (c)(Zhang et al,2015)
![]()
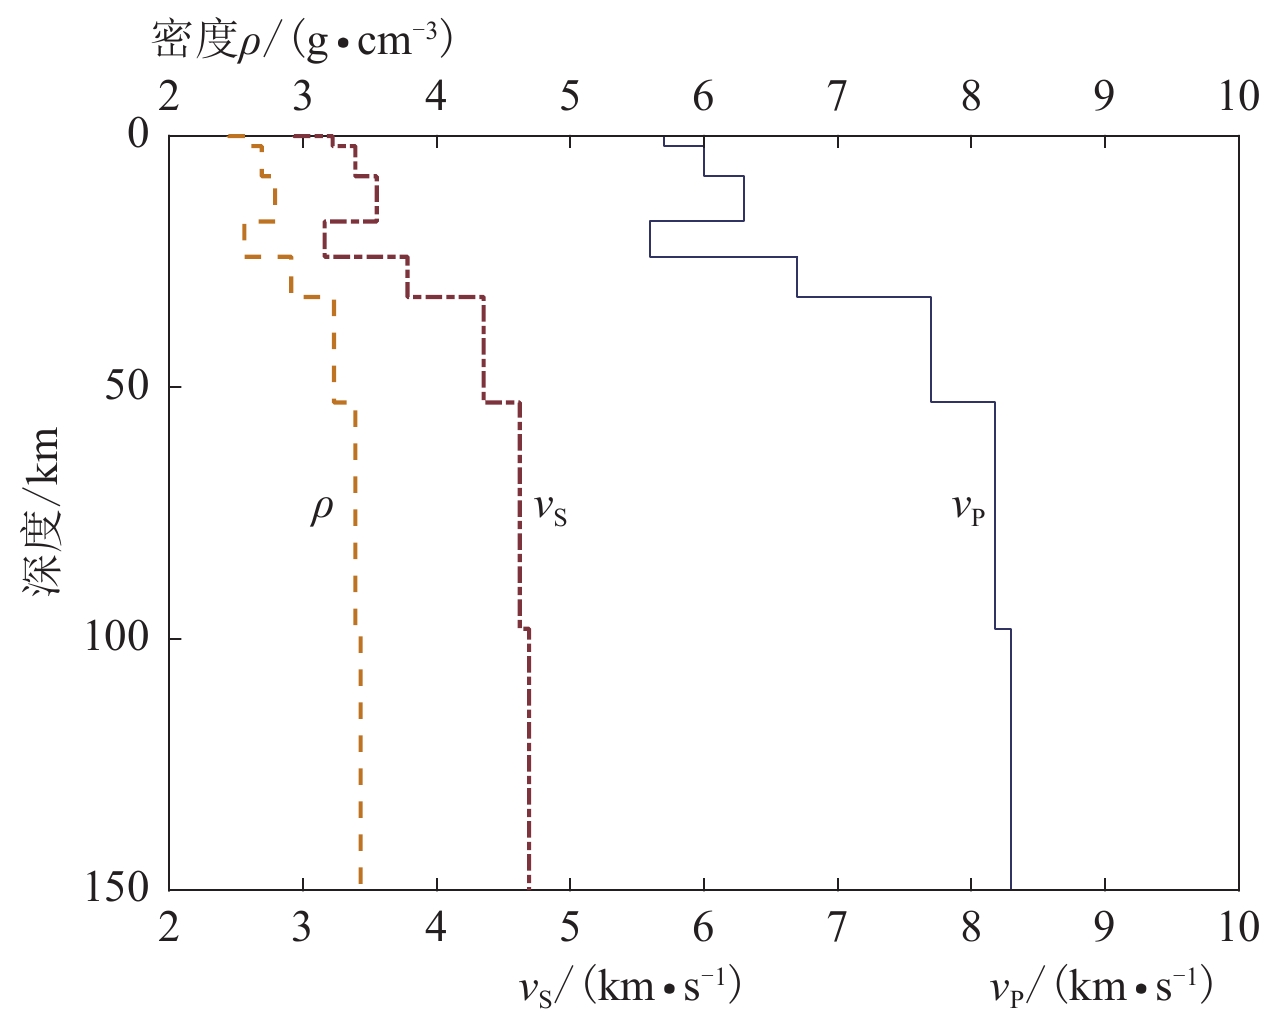
图 3 鲁甸地区一维速度结构及介质密度模型
Figure 3. One-dimensional velocity structure and medium density model in Ludian region
![]()
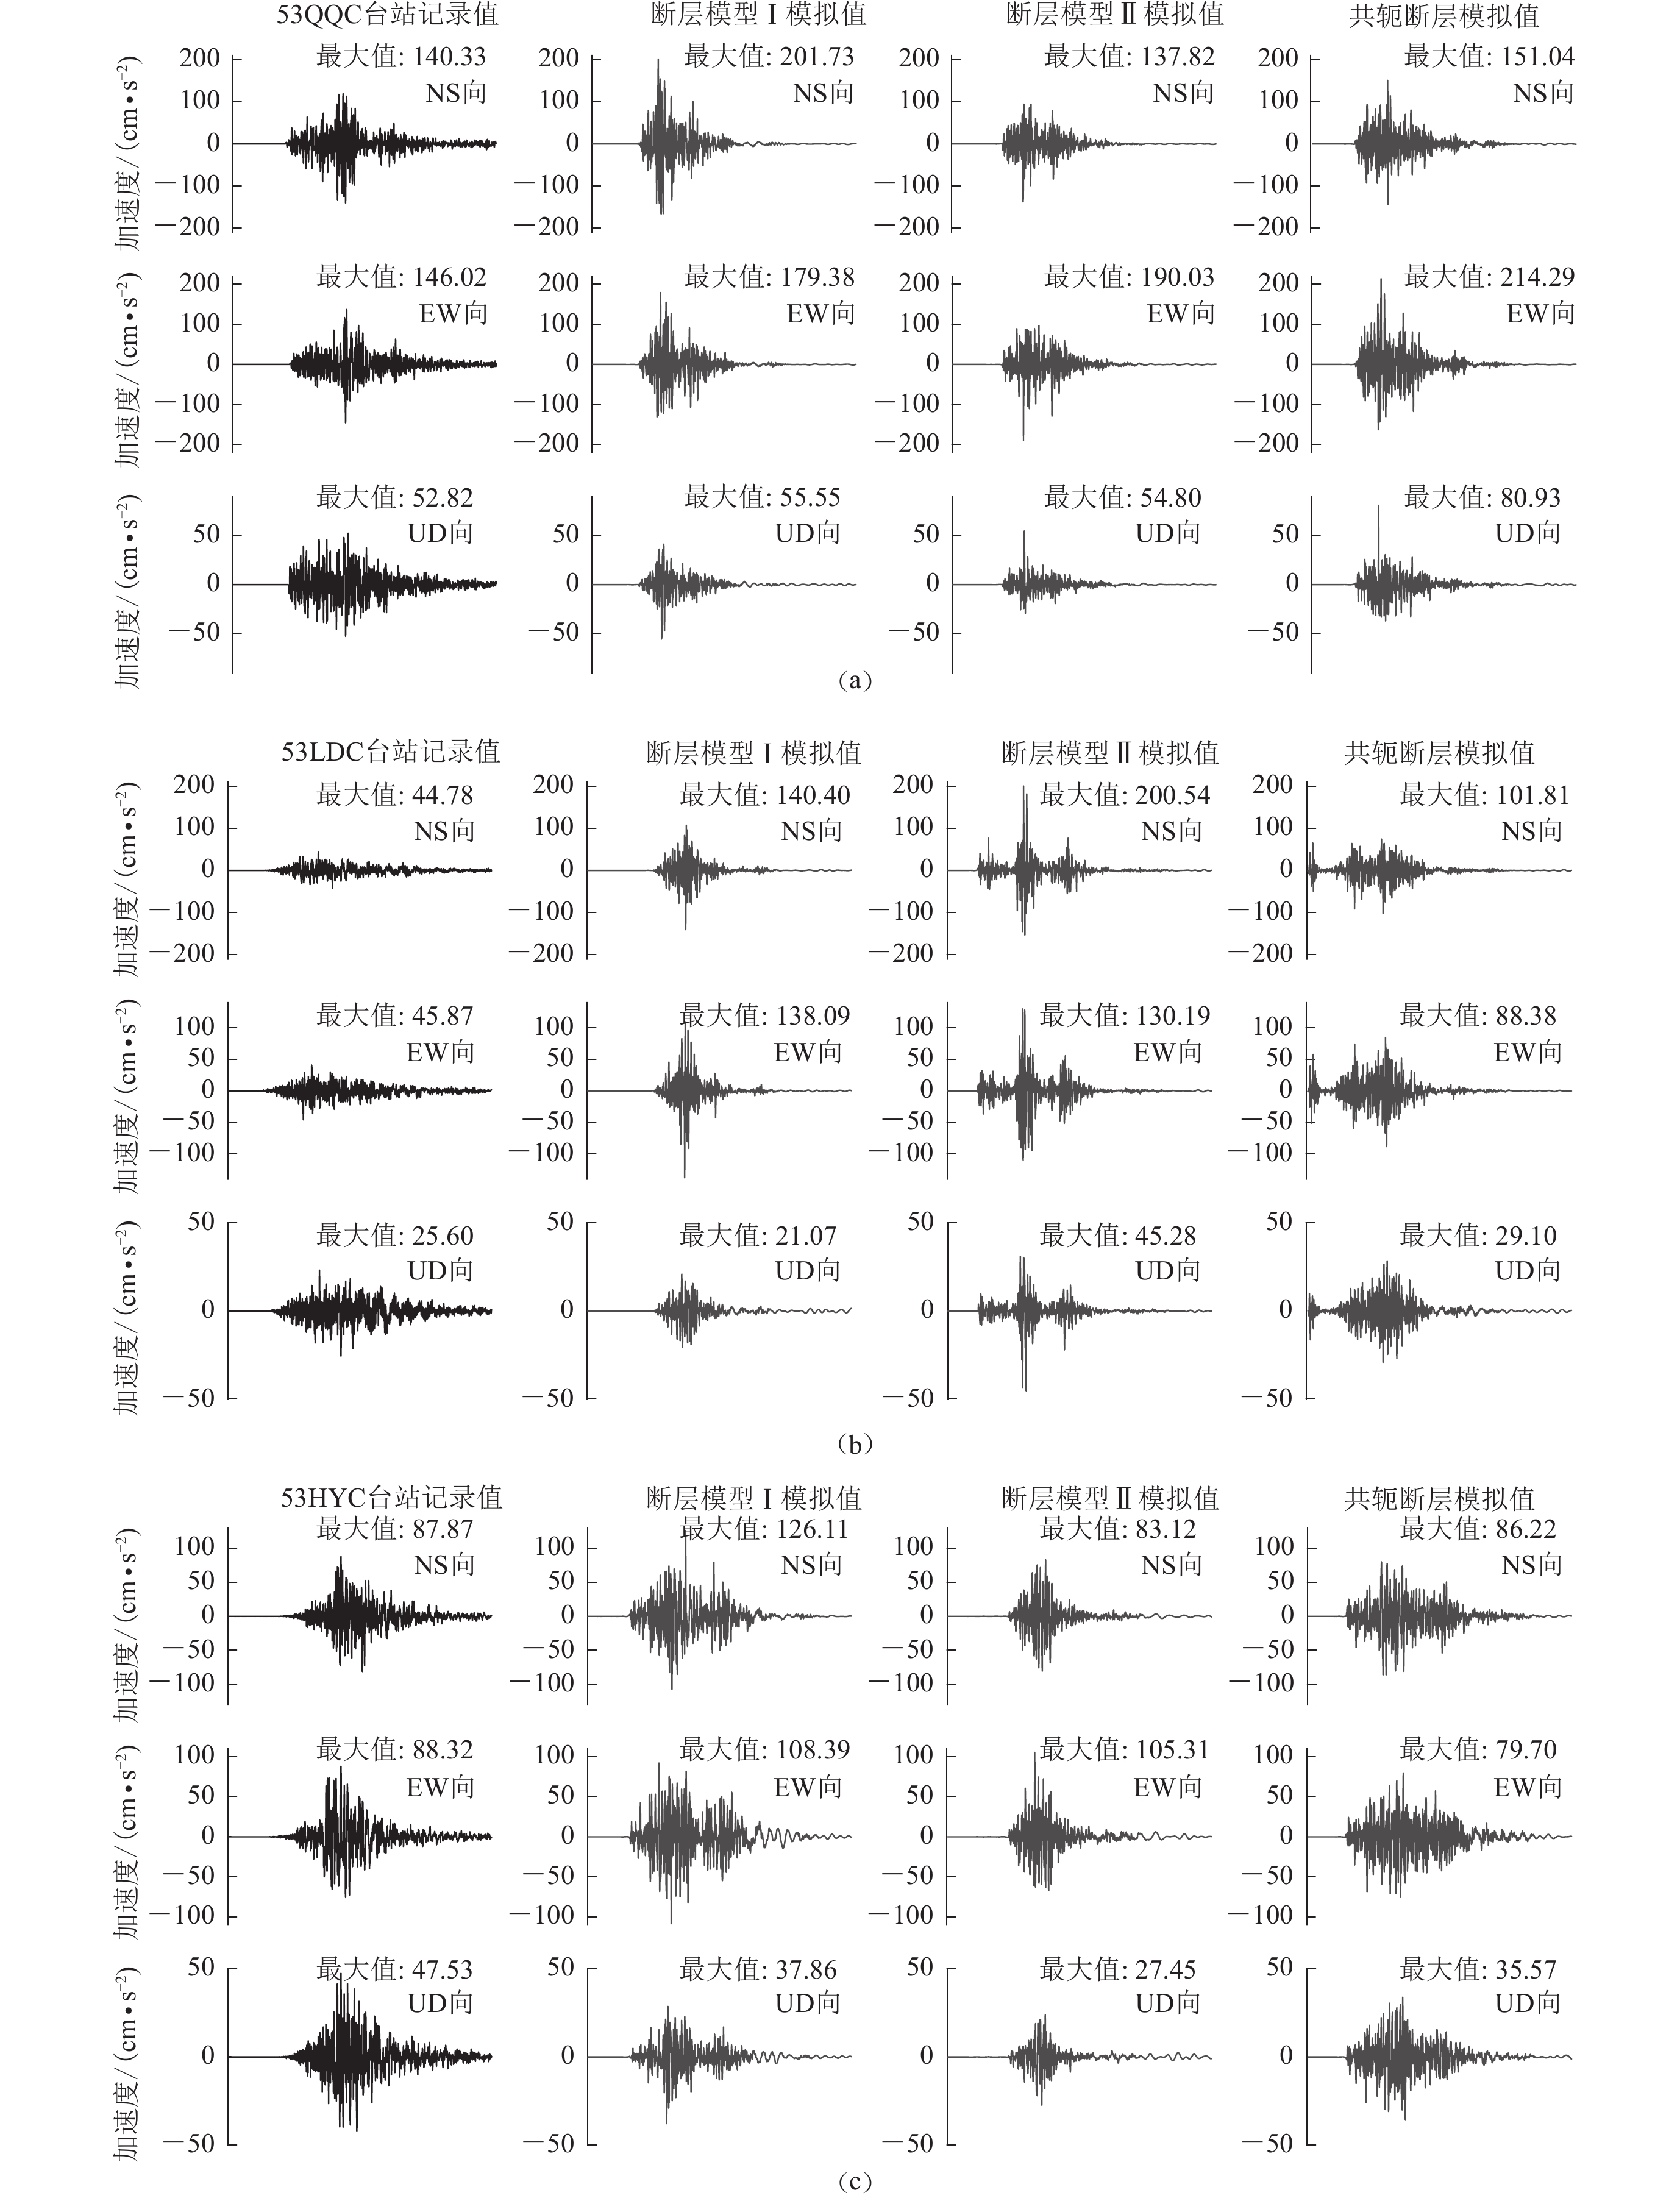
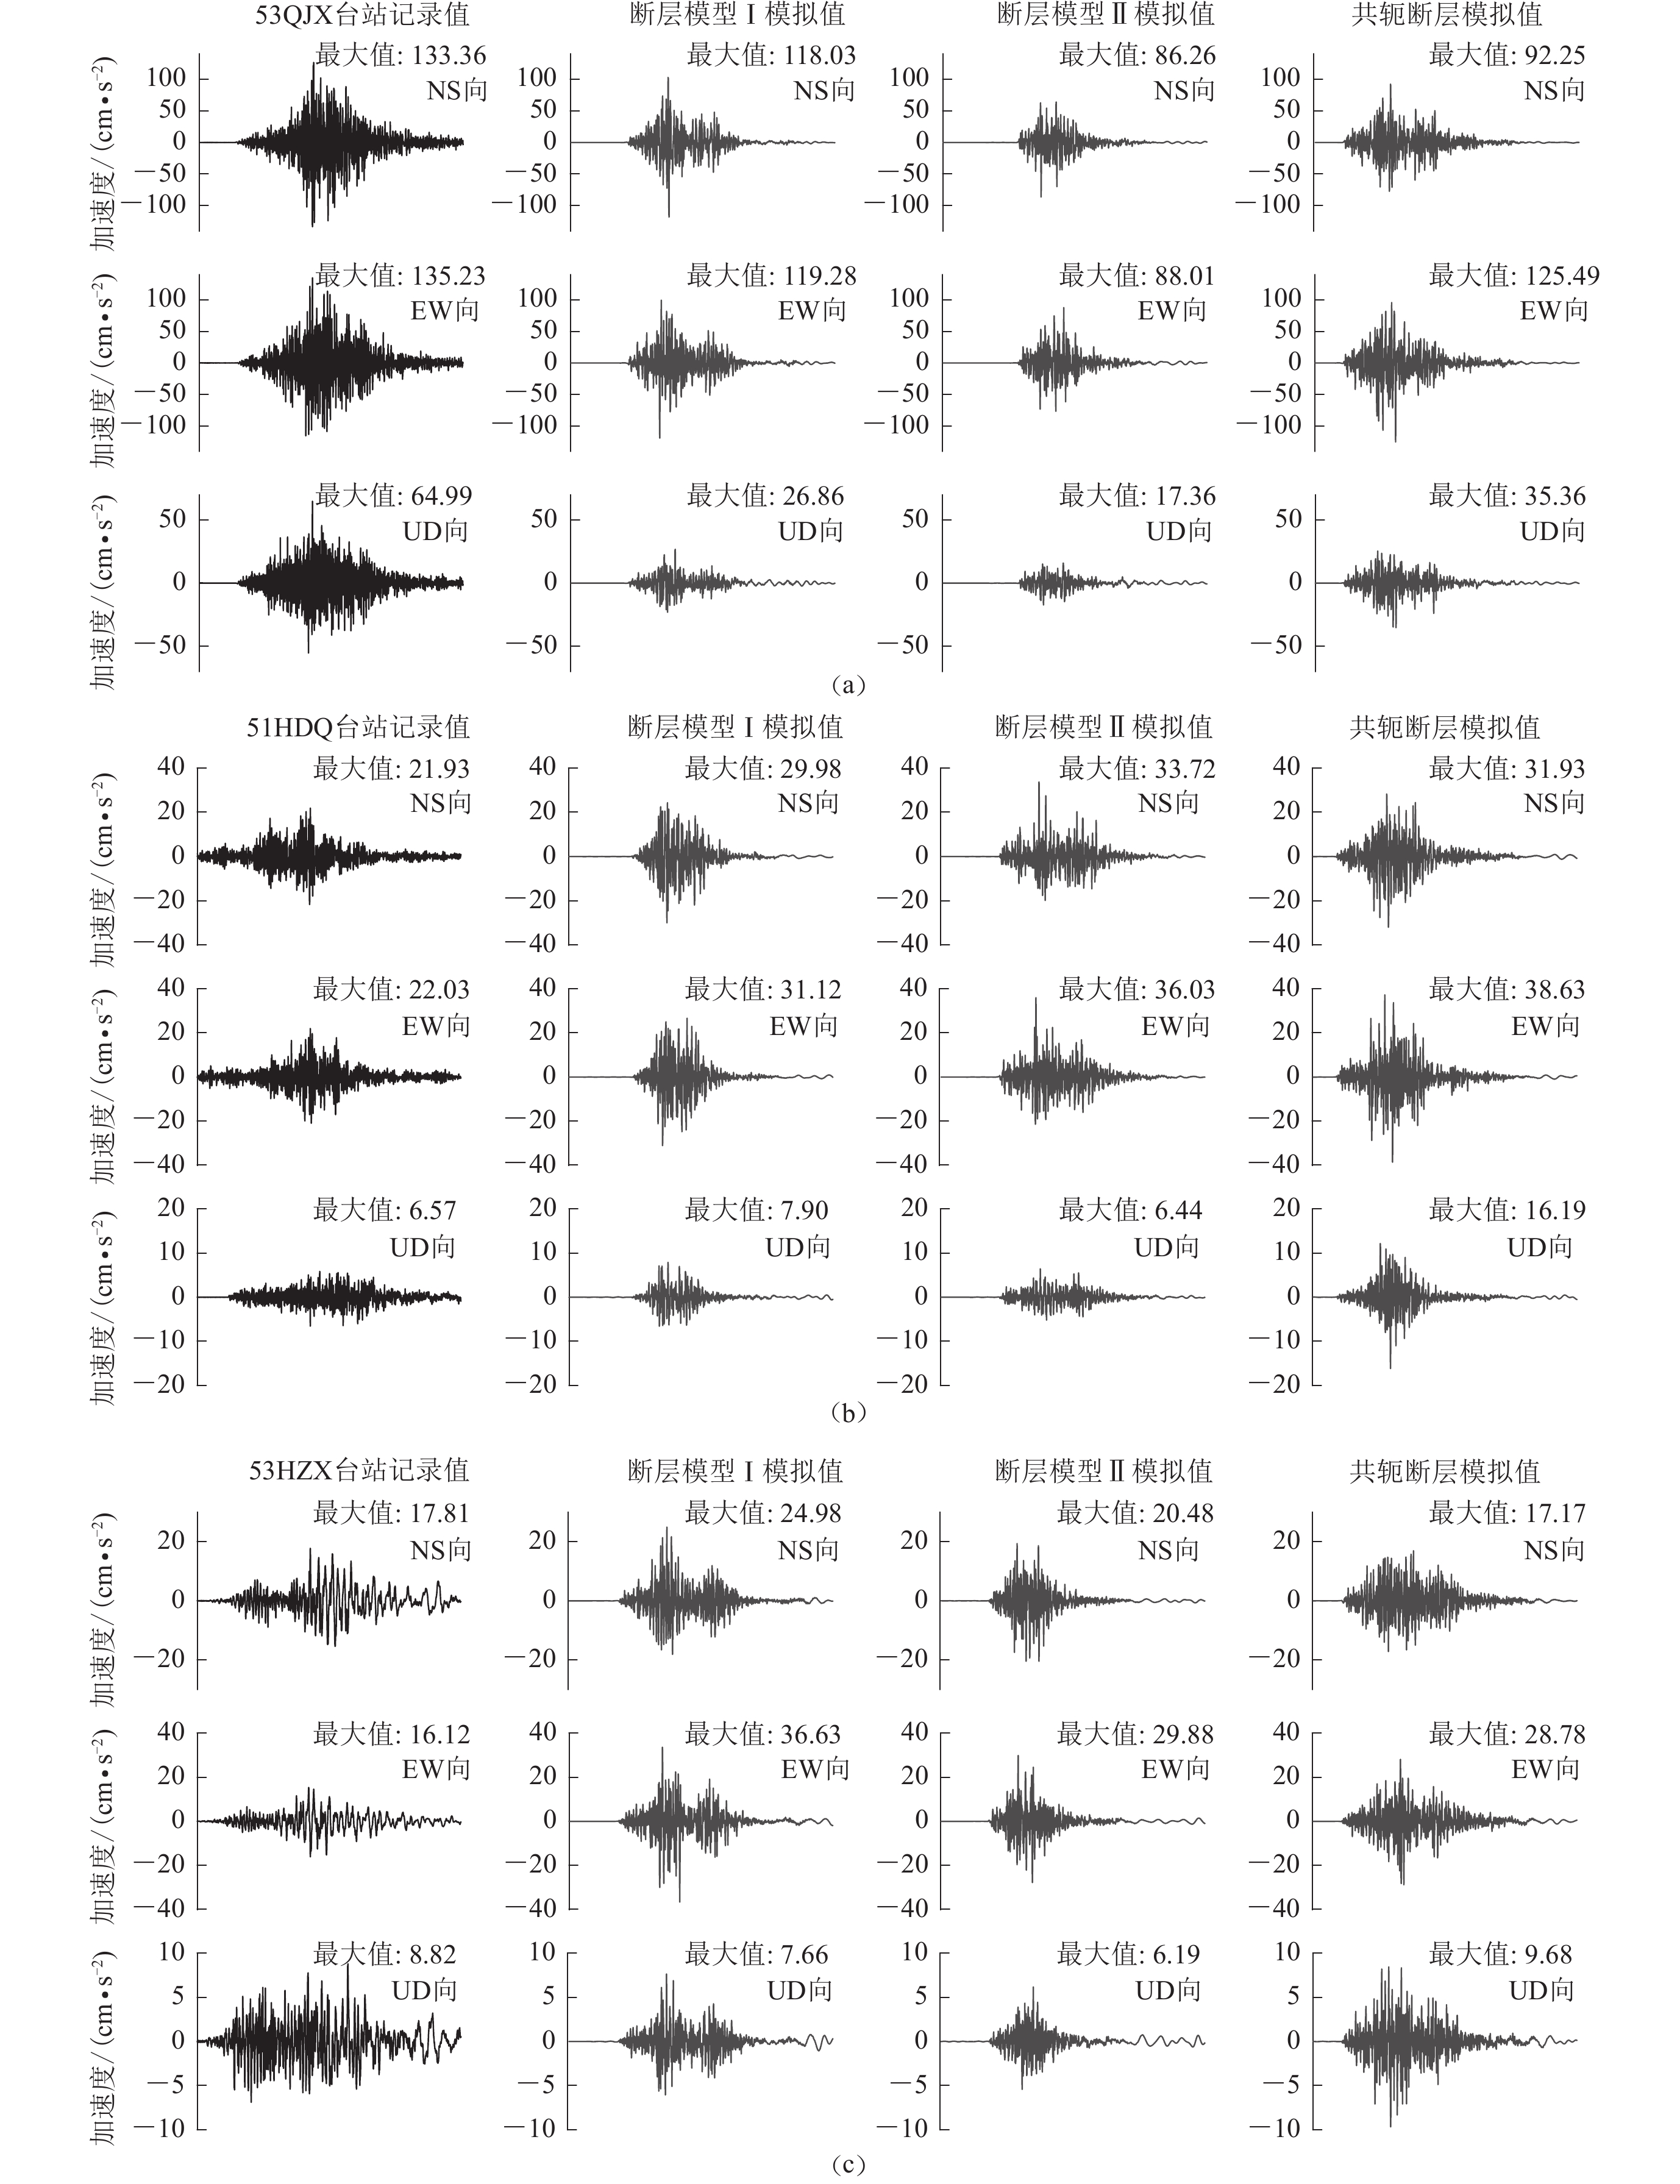
图 4 台站53QQC (a)、53LDC (b)和53HYC (c)的加速度记录及基于断层Ⅰ震源模型、断层Ⅱ震源模型和共轭复合震源模型合成的三分量加速度时程(持续时间35 s)
Figure 4. Recordings and simulated three component acceleration time-histories of the representative stations 53QQC (a),53LDC (b) and 53HYC (c) from source faultⅠmodel,fault Ⅱ model and conjugated fault model (duration of 35 s)
![]()
图 5 台站53QJX (a)、51HDQ (b)和53HZX (c)的加速度记录及基于断层Ⅰ震源模型、断层Ⅱ震源模型和共轭复合震源模型合成的三分量加速度时程(持续时间35 s)
Figure 5. Recordings and simulated three component acceleration time-histories of the representative stations 53QJX (a),51HDQ (b) and 53HZX (c) from source faultⅠmodel,fault Ⅱ model and conjugated fault model (duration of 35 s)
![]()
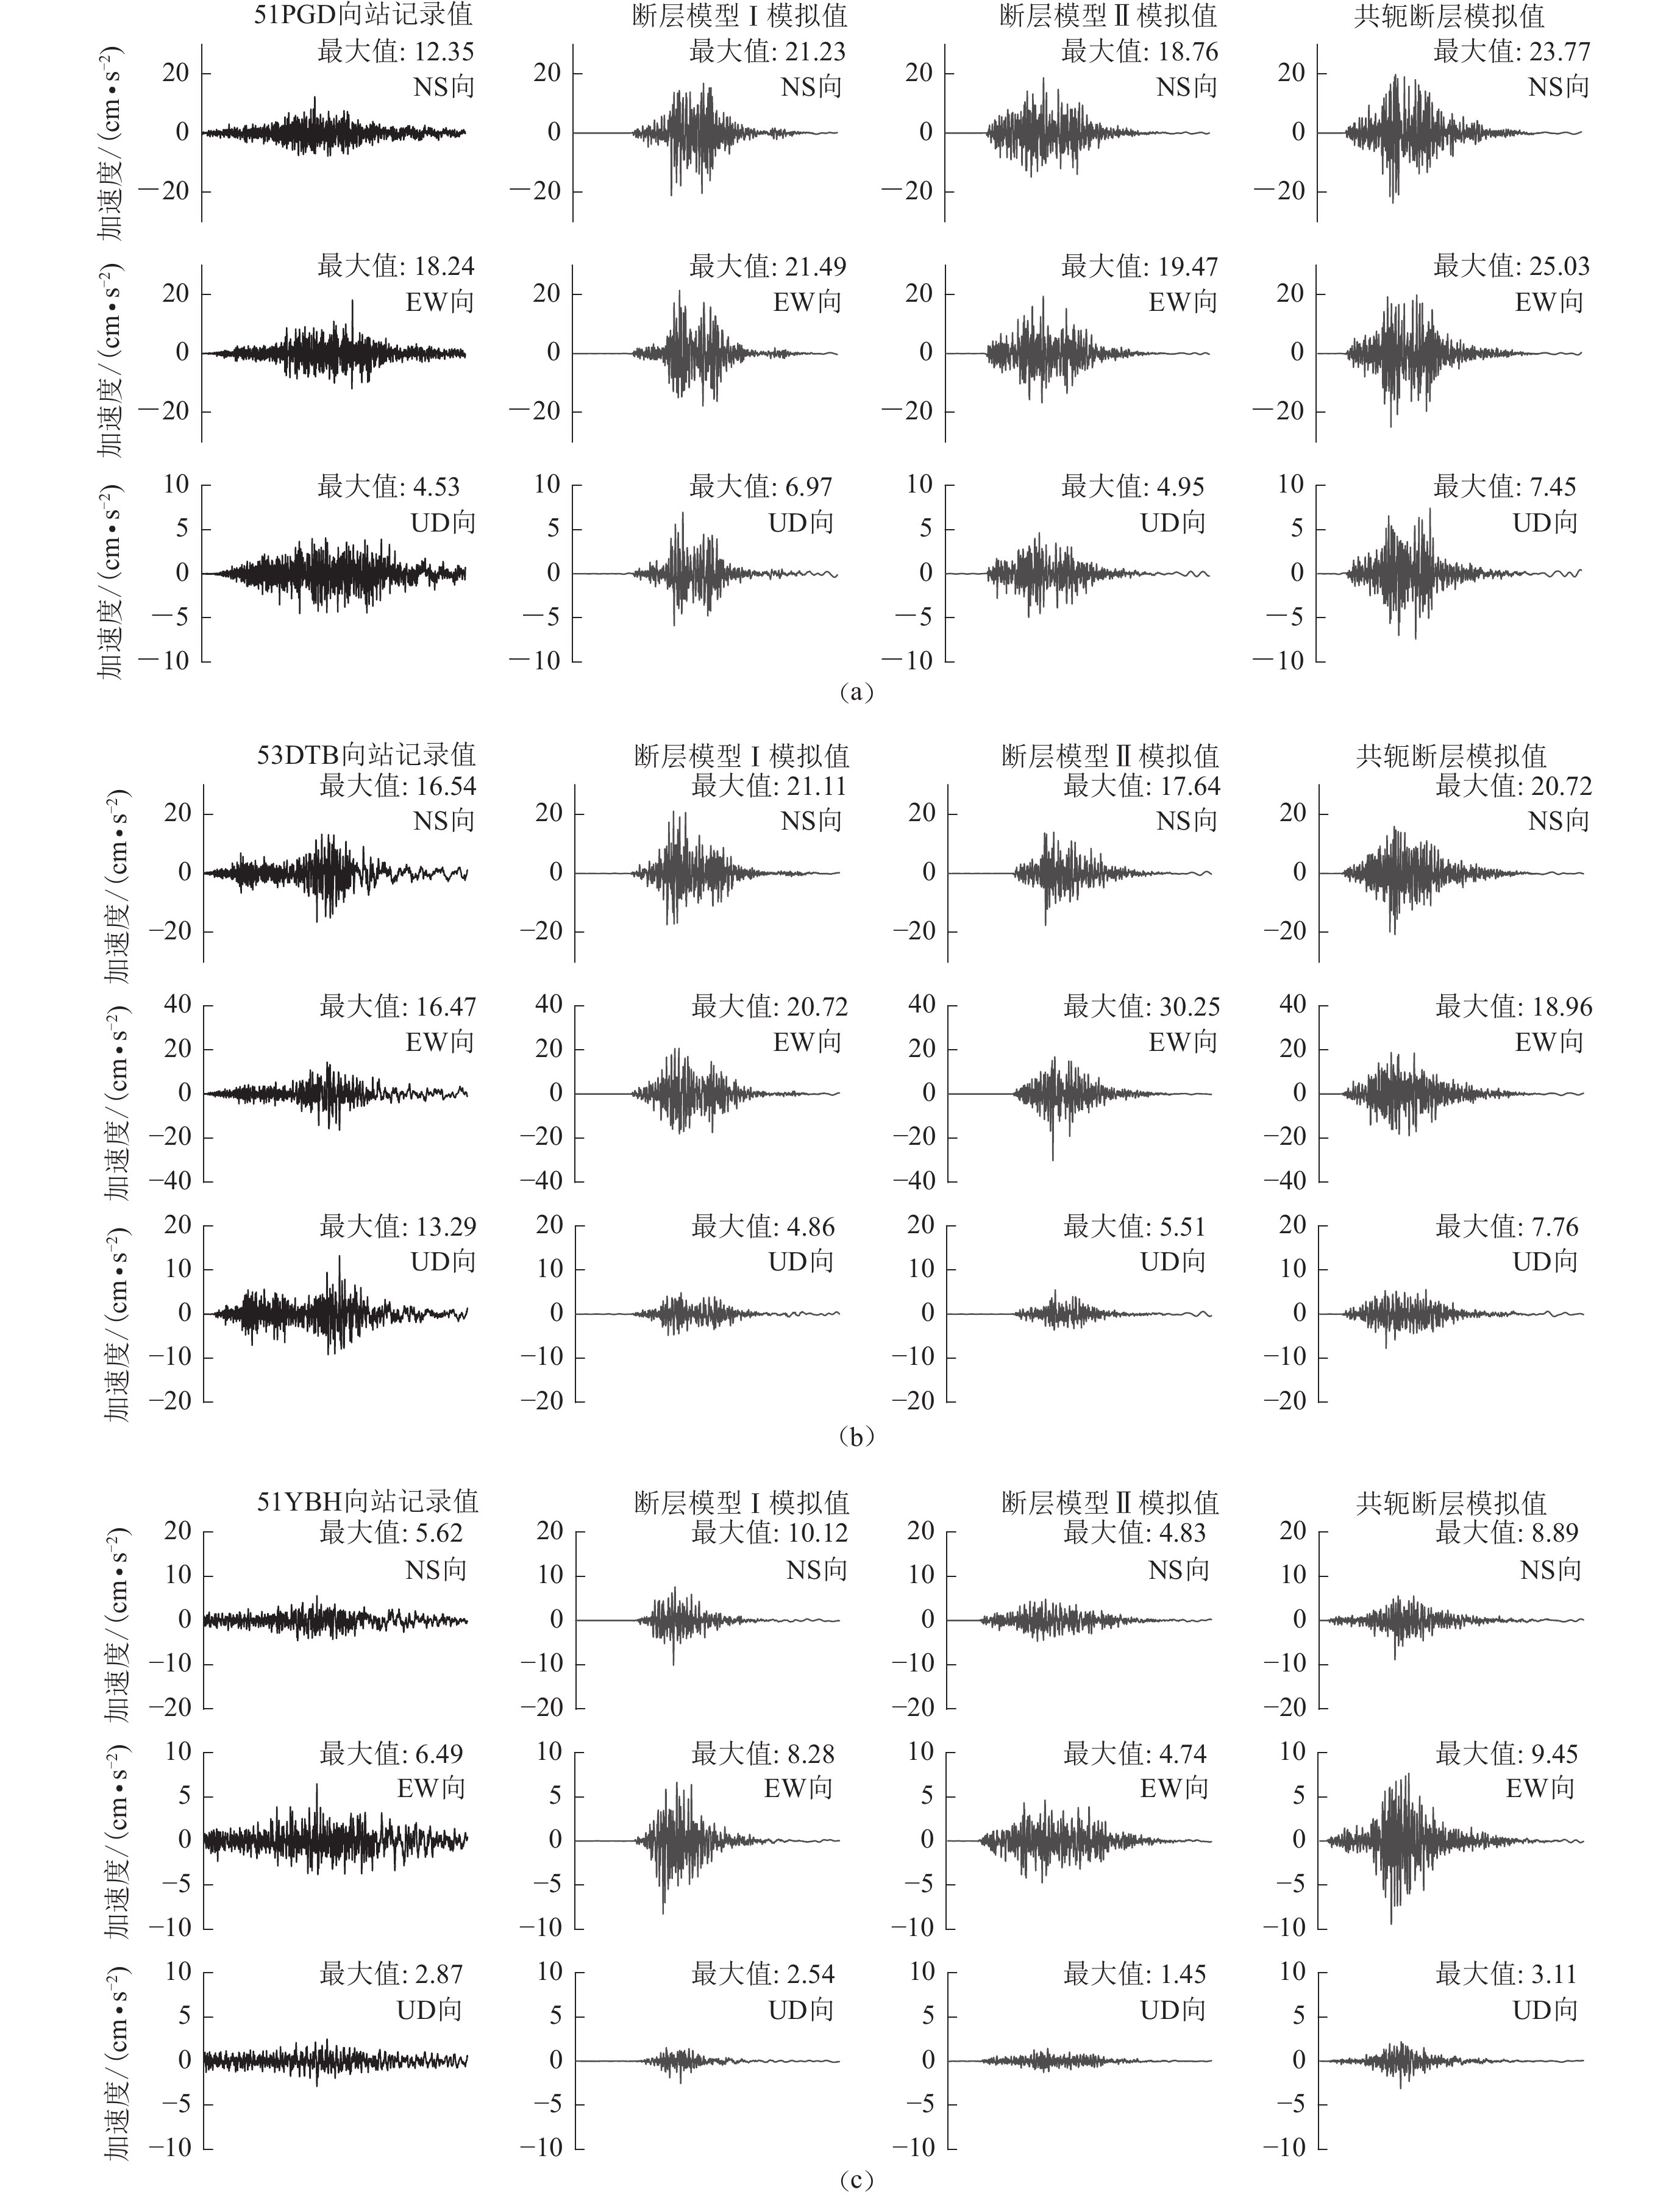
图 6 台站51PGD (a)、53DTB (b)和51YBH (c)的加速度记录及基于断层Ⅰ震源模型、断层Ⅱ震源模型和共轭复合震源模型合成的三分量加速度时程(持续时间35 s)
Figure 6. Recordings and simulated three component acceleration time-histories of the representative stations 51PGD (a),53DTB (b) and 51YBH (c) from source faultⅠmodel,fault Ⅱ model and conjugated fault model (duration of 35 s)
![]()
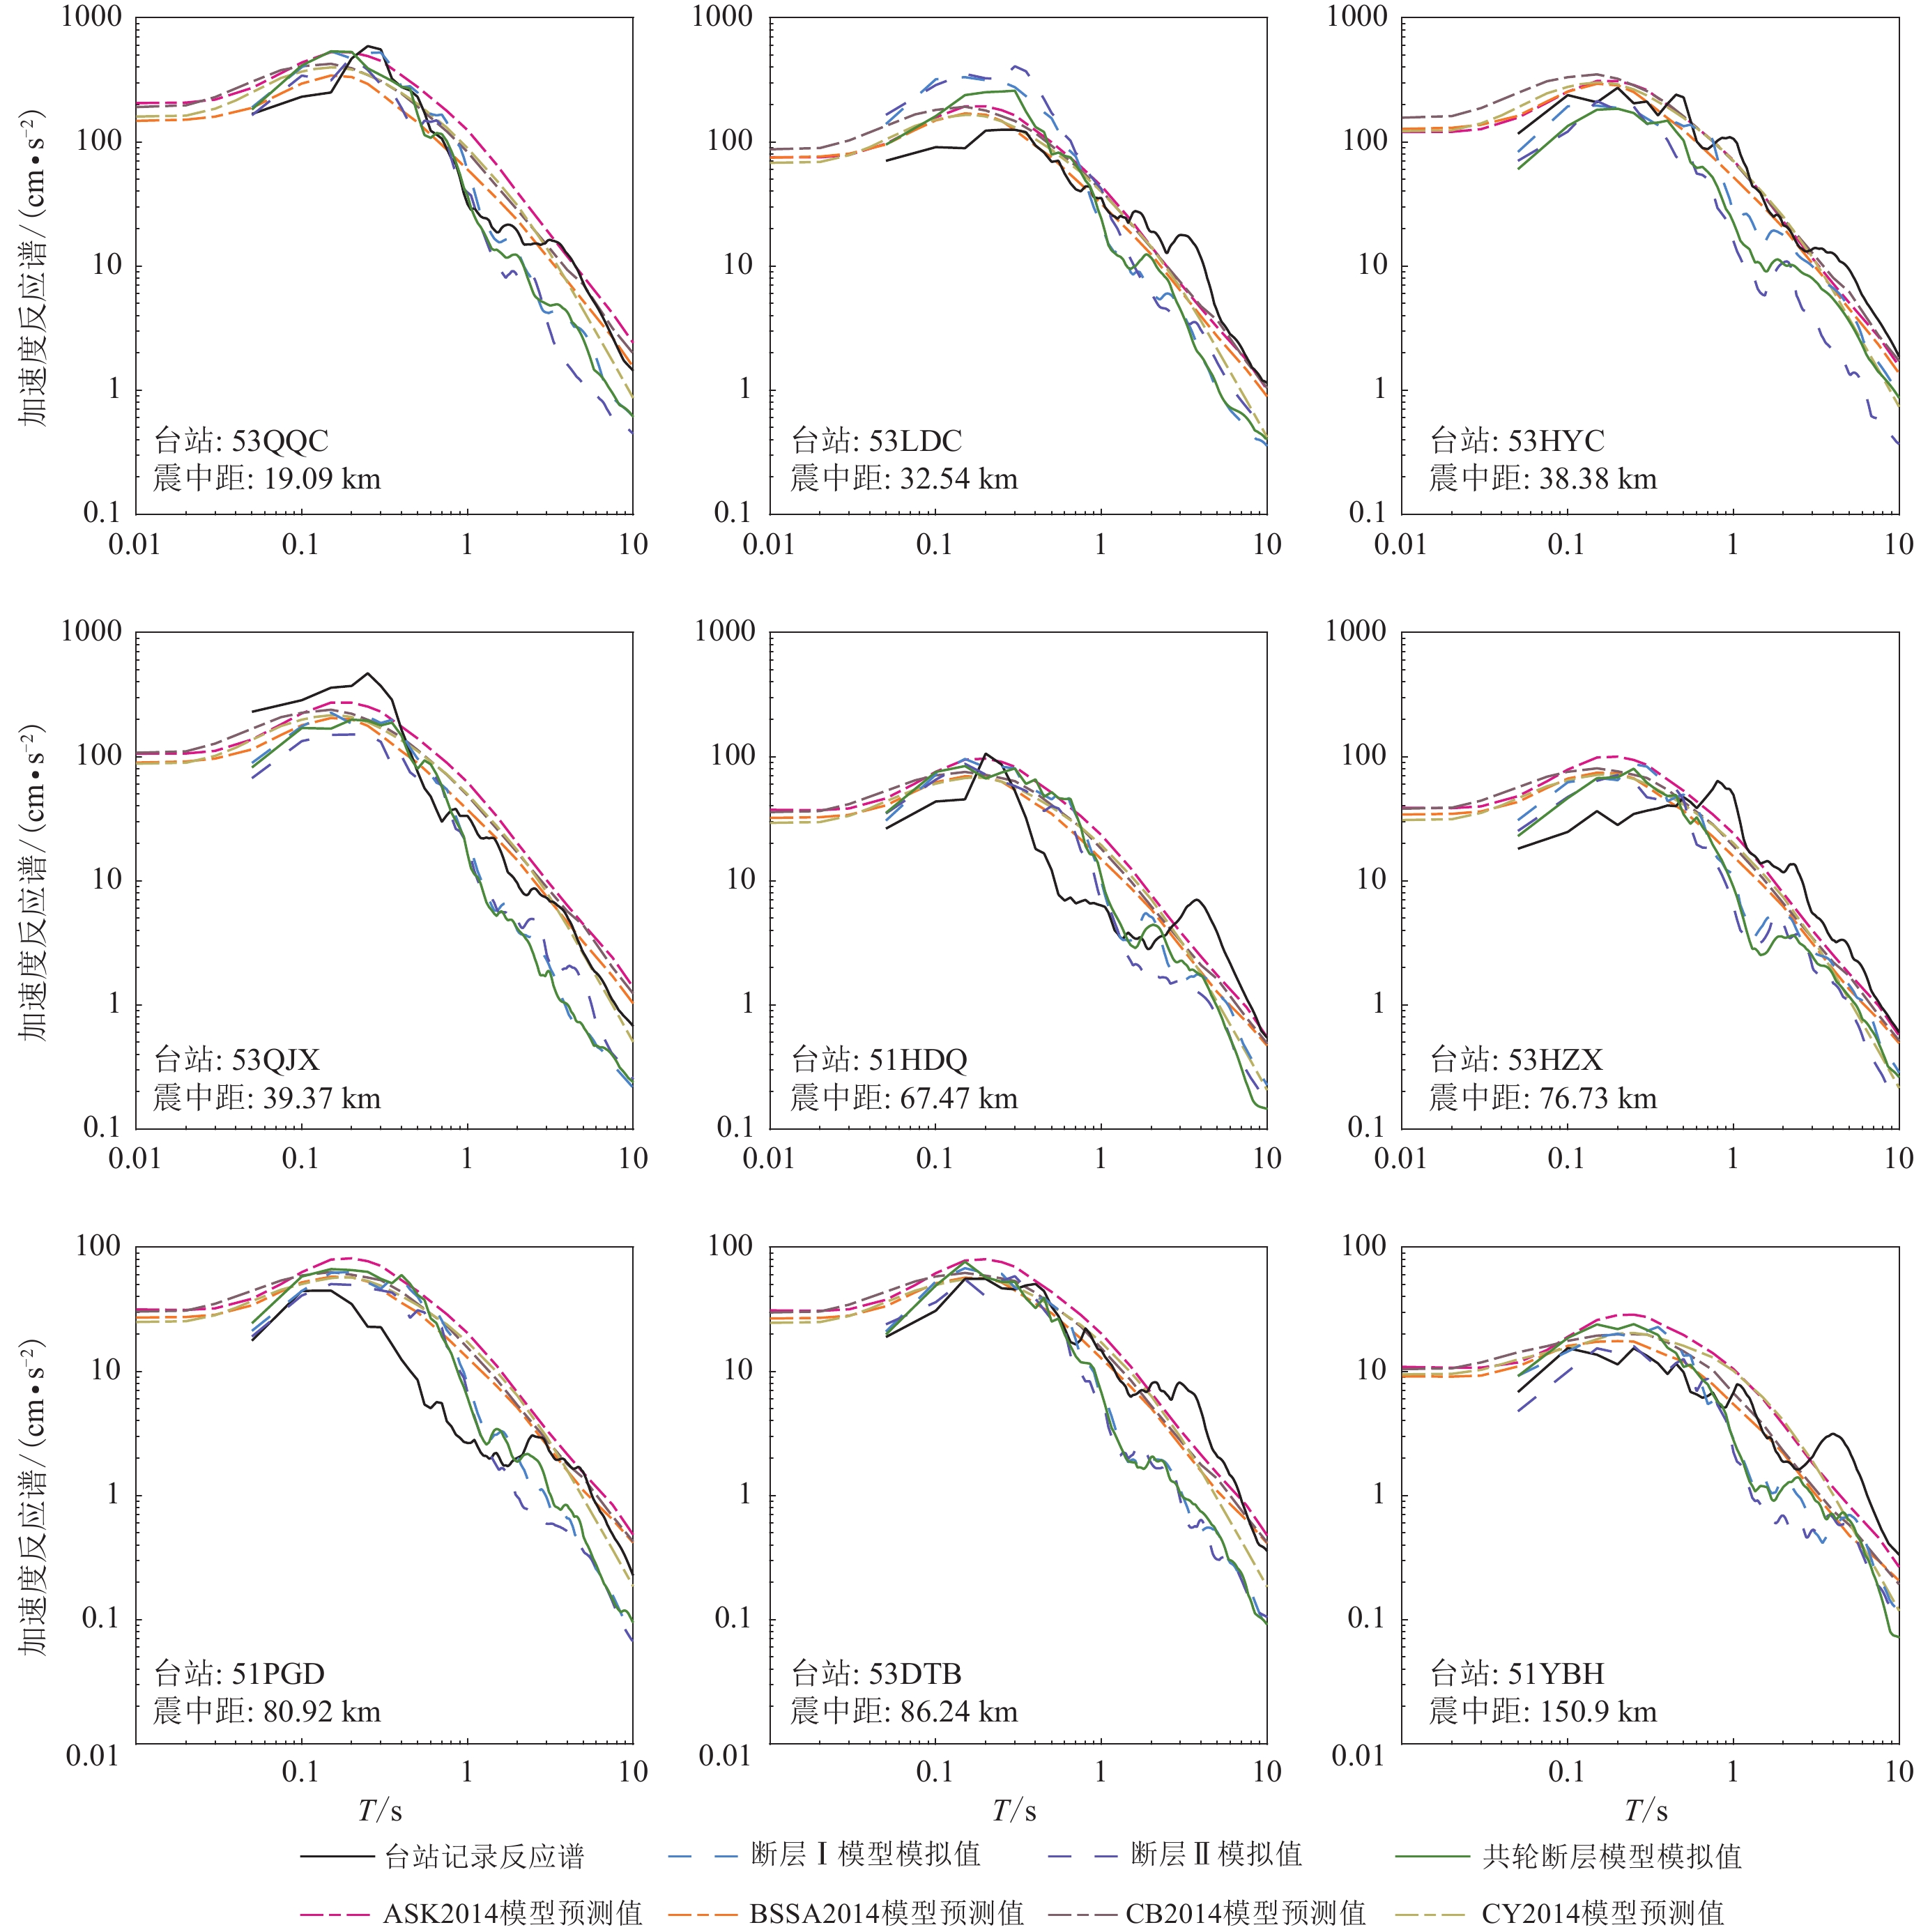
图 7 9个代表性台站的加速度反应谱与基于单断层Ⅰ震源模型、单断层Ⅱ震源模型及共轭复合断层震源模型模拟的加速度反应谱、加速度反应谱衰减模型的对比
Figure 7. Comparison of the recorded acceleration response spectra of 9 representative stations with the simulated acceleration response spectra from source fault Ⅰ model ,fault Ⅱ model and conjugated fault model and NGA-West2 attenuation models
![]()
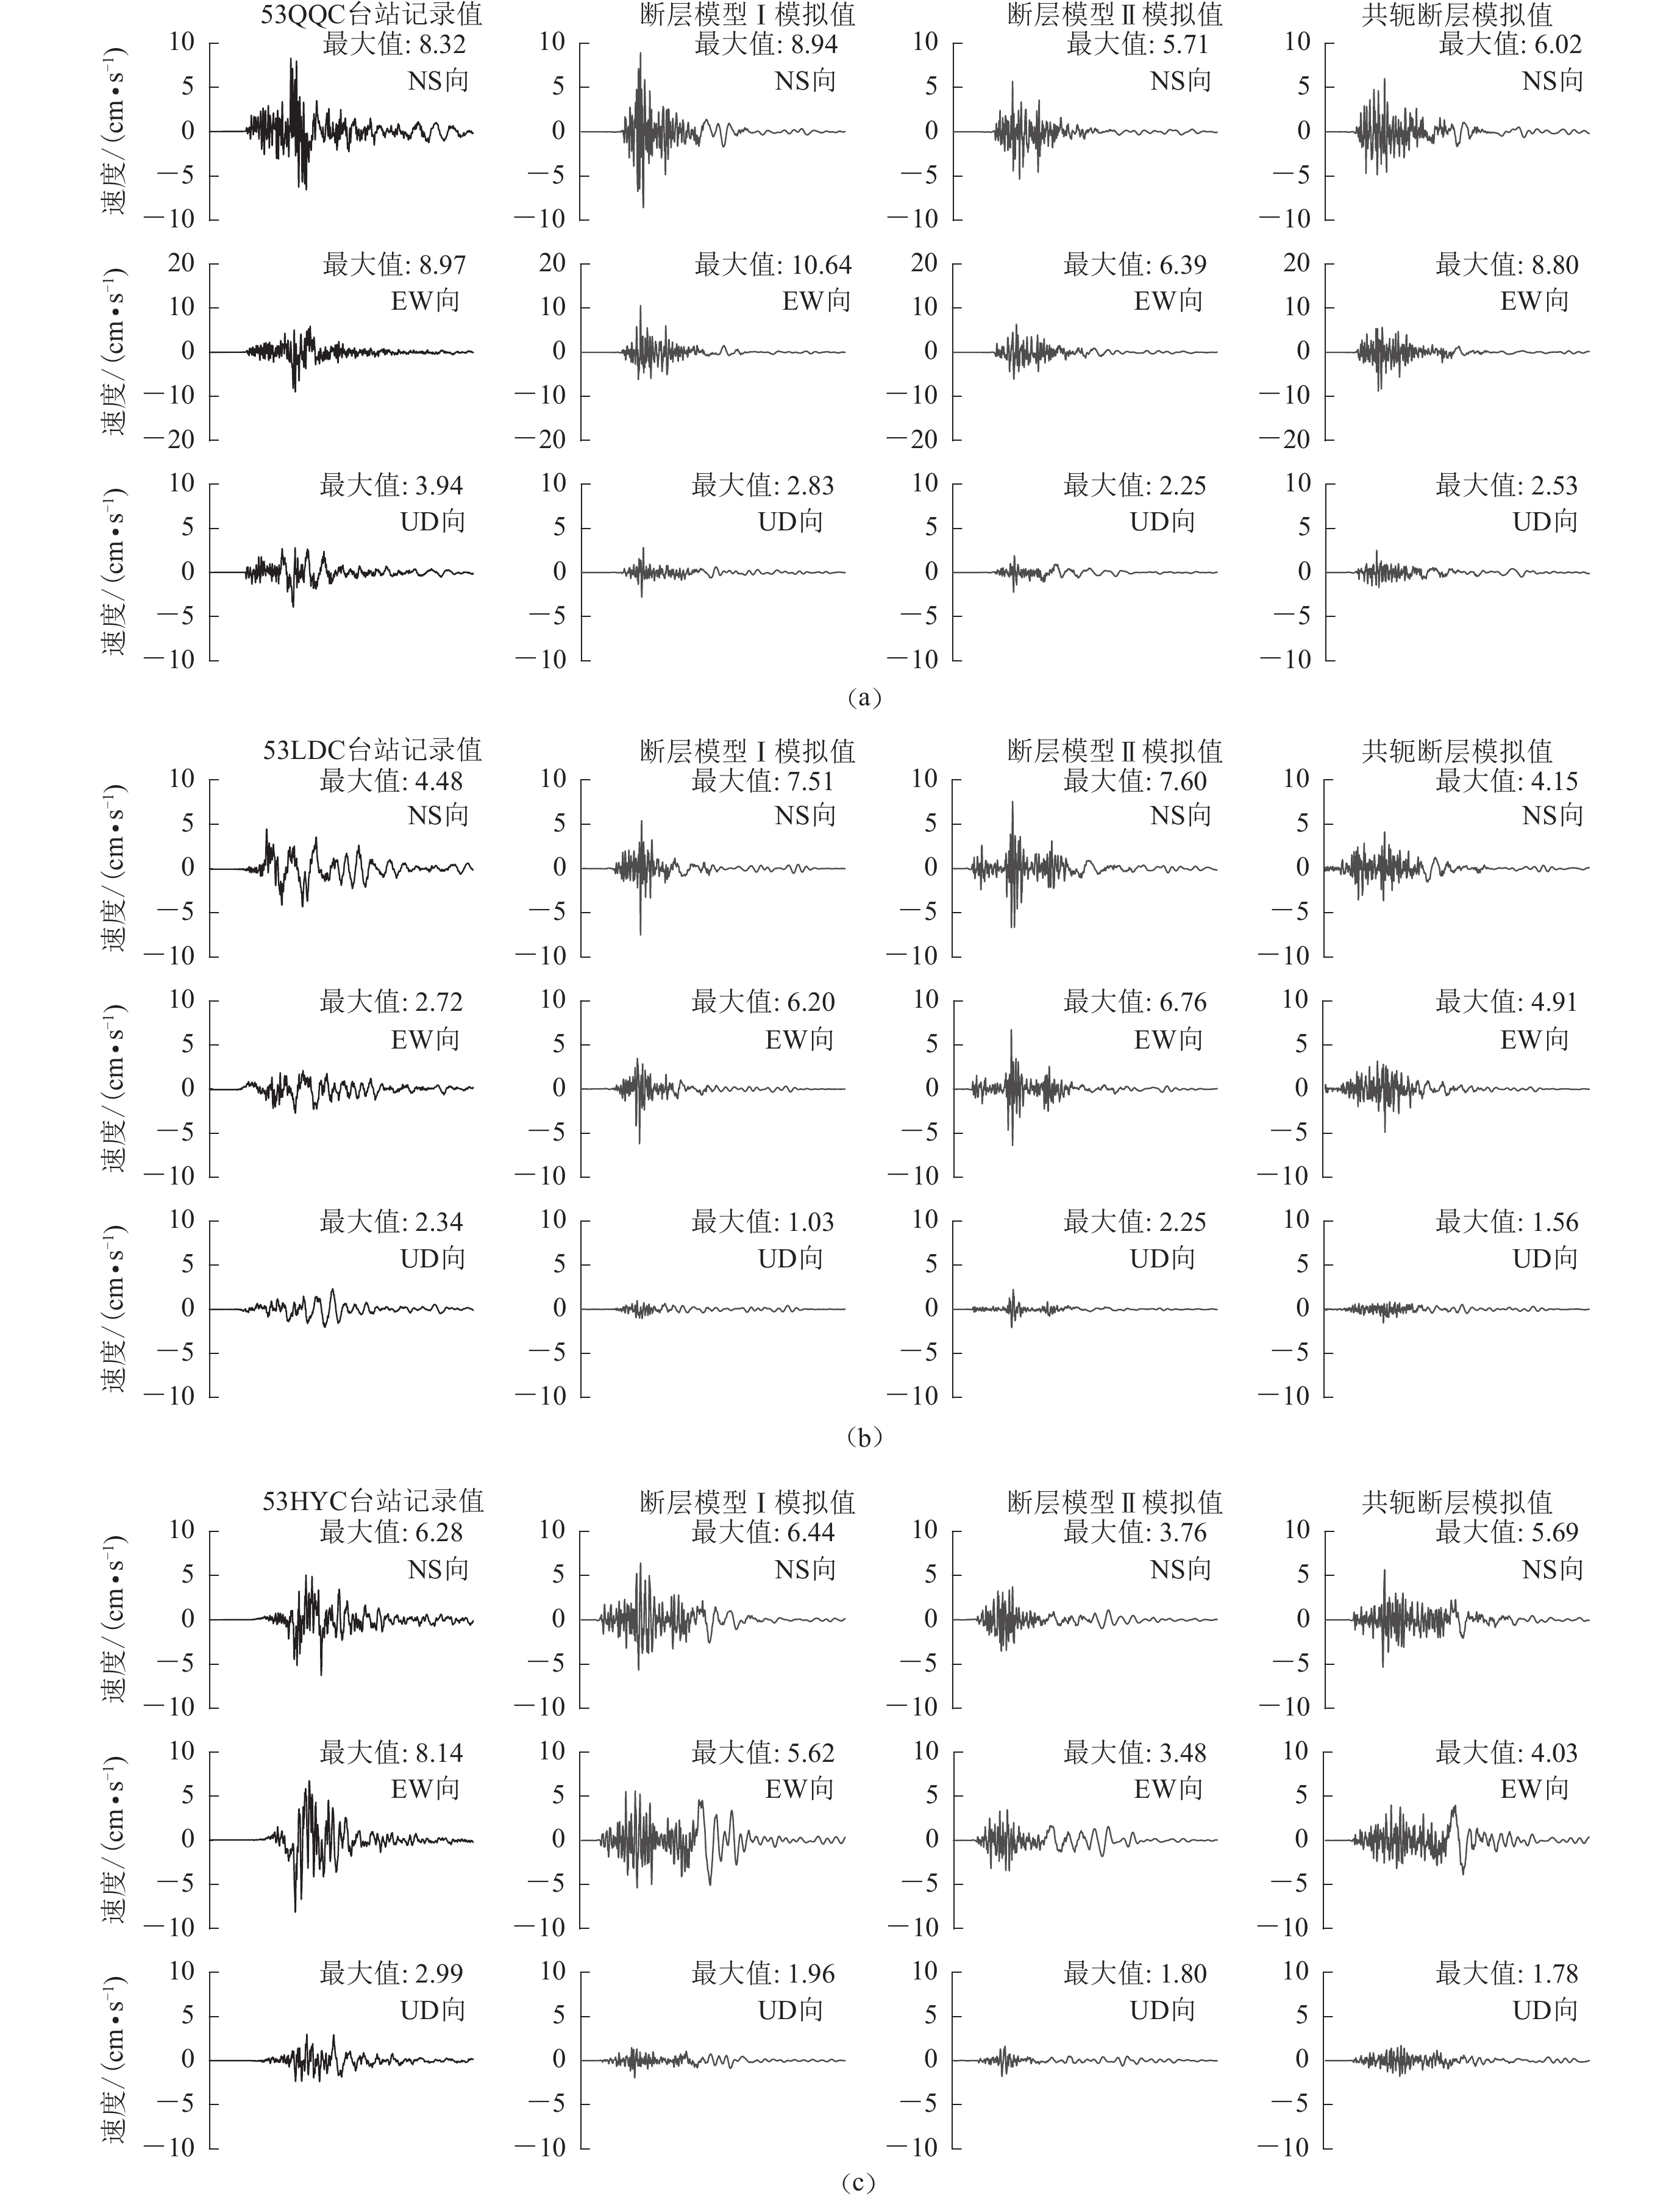
图 8 台站53QQC (a)、53LDC (b)和53HYC (c)的记录和
Figure 8. The recorded three component velocity time-histories of the stations 53QQC,53LDC and 53HYC and the simulated velocity time-histories of different source models (duration of 40 s)
![]()
图 9 三个震源模型产生的水平向PGA (左)和PVG (右)分布
Figure 9. Distributions of horizontal PGA (left) and PGV (right) generated from three source fault models
表 1 两个单断层模型及共轭复合断层震源模型参数(张勇,2015)
Table 1 Parameters of two single fault plane models and conjugated faults model (Zhang,2015)
震源模型 走向/° 倾向/° 长度/km 宽度/km 子断层尺寸 地震矩/(1018 N·m) MW 断层Ⅰ模型 162 70 21 10 2 km×2 km 1.79 6.13 断层Ⅱ模型 257 77 21 10 2 km×2 km 1.80 6.14 共轭断层模型 复合 复合 复合 复合 2 km×2 km 2.05 6.17  下载: 导出CSV
表 2 震中距160 km内部分台站相关信息(顺序依震中距排列)
Table 2 List of relevant information of part discussed stations within 160 km of the epicenter (arranged according to the epicenter distance)
台站 东经/° 北纬/° 场地类型 震中距/km 断层Ⅰ断层距/km 断层Ⅱ断层距/km $ {v}_{\mathrm{S}30} $ 53QQC 103.23 26.94 土 19.09 14.77 13.24 527# 53LDC 103.60 27.22 岩 32.54 28.99 13.93 424 53HYC 103.51 26.81 土 38.38 17.26 33.52 497* 53QJX 103.24 35.75 土 39.37 24.44 33.97 527# 51HDQ 102.82 26.67 土 67.47 60.57 49.07 747 53HZX 103.31 26.41 土 76.73 57.60 72.24 318* 51PGD 102.54 27.37 土 80.92 69.31 65.85 688 53DTB 103.04 26.36 岩 86.24 70.21 75.09 760 51YBH 101.92 26.53 土 150.90 147.53 129.68 376 注:标*数据由Boor (2 004)的速度梯度延拓线性模型外推计算而得,标#数据根据邻近场地插值计算得到。
下载: 导出CSV
-
陈鲲,俞言祥,高孟潭,亢川川. 2015. 2014年云南鲁甸MS6.5地震峰值加速度震动图[J]. 地震学报,37(3):429–436. doi: 10.11939/j.issn:0253-3782.2015.03.006 Chen K,Yu Y X,Gao M T,Kang C C. 2015. Shakemap of peak ground acceleration for 2014 Ludian,Yunnan,MS6.5 earthquake[J]. Acta Seismologica Sinica,37(3):429–436 (in Chinese).
崔建文,刘琼仙,段建新,杨黎薇,高东,李世成,徐硕,林国良,张潜,包一峰,段洪杰. 2014. 2014年云南鲁甸6.5级地震强震动观测记录及初步分析[J]. 地震研究,37(4):542–548. doi: 10.3969/j.issn.1000-0666.2014.04.009 Cui J W,Liu Q X,Duan J X,Yang L W,Gao D,Li S C,Xu S,Lin G L,Zhang Q,Bao Y F,Duan H J. 2014. Strong-motion recordings of MS6.5 Ludian earthquake in Yunnan in 2014 and their preliminary analysis[J]. Journal of Seismological Research,37(4):542–548 (in Chinese).
房立华,吴建平,王未来,吕作勇,王长在,杨婷,钟世军. 2014. 云南鲁甸MS 6.5地震余震重定位及其发震构造[J]. 地震地质,36(4):1173–1185. doi: 10.3969/j.issn.0253-4967.2014.04.019 Fang L H,Wu J P,Wang W L,Lü Z Y,Wang C Z,Yang T,Zhong S J. 2014. Relocation of the aftershock sequence of the MS6.5 Ludian earthquake and its seismogenic structure[J]. Seismology and Geology,36(4):1173–1185 (in Chinese).
冀昆,温瑞智,崔建文,王宏伟,任叶飞. 2014. 鲁甸MS6.5 级地震强震动记录及震害分析[J]. 震灾防御技术,9(3):325–339. doi: 10.11899/zzfy20140301 Ji K,Wen R Z,Cui J W,Wang H W,Ren Y F. 2014. Observation of strong motion and damage investigation for MS6.5 Ludian earthquake[J]. Technology for Earthquake Disaster Prevention,9(3):325–339 (in Chinese).
刘成利,郑勇,熊熊,付芮,单斌,刁法启. 2014. 利用区域宽频带数据反演鲁甸MS6.5 级地震震源破裂过程[J]. 地球物理学报,57(9):3028–3037. doi: 10.6038/cjg20140927 Liu C L,Zheng Y,Xiong X,Fu R,Shan B,Diao F Q. 2014. Rupture process of MS6.5 Ludian earthquake constrained by regional broadband seismograms[J]. Chinese Journal of Geophysics,57(9):3028–3037 (in Chinese).
卢永坤,张建国,宋立军,代博洋,和嘉吉,庞卫东. 2014. 2014年云南鲁甸6.5级地震烈度分布与房屋震害特征[J]. 地震研究,37(4):549–557. doi: 10.3969/j.issn.1000-0666.2014.04.010 Lu Y K,Zhang J G,Song L J,Dai B Y,He J J,Pang W D. 2014. Analysis on intensity distribution and seismic disaster characteristics of building of Yunnan Ludian MS6.5 earthquake in 2014[J]. Journal of Seismological Research,37(4):549–557 (in Chinese).
王未来,吴建平,房立华,来贵娟. 2014. 2014年云南鲁甸MS6.5地震序列的双差定位[J]. 地球物理学报,57(9):3042–3051. Wang W L,Wu J P,Fang L H,Lai G J. 2014. Double difference location of the Ludian MS6.5 earthquake sequences in Yunnan Province in 2014[J]. Chinese Journal of Geophysics,57(9):3042–3051 (in Chinese).
魏勇,崔建文,王秋良,沈雨忆. 2018. 基于合成地震动的2014年鲁甸MS6.5地震场地效应分析[J]. 地震研究,41(1):32–37. doi: 10.3969/j.issn.1000-0666.2018.01.004 Wei Y,Cui J W,Wang Q L,Shen Y Y. 2018. Analysis on site effect of 2014 Yunnan Ludian MS6.5 earthquake based on simulating ground motion[J]. Journal of Seismological Research,41(1):32–37 (in Chinese).
许力生,张旭,严川,李春来. 2014. 基于勒夫波的鲁甸MS6.5地震震源复杂性分析[J]. 地球物理学报,57(9):3006–3017. doi: 10.6038/cjg20140925 Xu L S,Zhang X,Yan C,Li C L. 2014. Analysis of the Love waves for the source complexity of the Ludian MS6.5 earthquake[J]. Chinese Journal of Geophysics,57(9):3006–3017 (in Chinese).
徐涛,张明辉,田小波,郑勇,白志明,武澄泷,张忠杰,滕吉文. 2014. 丽江—清镇剖面上地壳速度结构及其与鲁甸MS6.5级地震孕震环境的关系[J]. 地球物理学报,57(9):3069–3079. doi: 10.6038/cjg20140932 Xu T,Zhang M H,Tian X B,Zheng Y,Bai Z M,Wu C L,Zhang Z J,Teng J W. 2014. Upper crustal velocity of Lijiang-Qingzhen profile and its relationship with the seismogenic environment of the MS6.5 Ludian earthquake[J]. Chinese Journal of Geophysics,57(9):3069–3079 (in Chinese).
徐锡伟,江国焰,于贵华,吴熙彦,张建国,李西. 2014. 鲁甸6.5级地震发震断层判定及其构造属性讨论[J]. 地球物理学报,57(9):3060–3068. doi: 10.6038/cjg20140931 Xu X W,Jiang G Y,Yu G H,Wu X Y,Zhang J G,Li X. 2014. Discussion on seismogenic fault of the Ludian MS6.5 earthquake and its tectonic attribution[J]. Chinese Journal of Geophysics,57(9):3060–3068 (in Chinese).
张斌,李小军,俞言祥,李娜,朱俊. 2020. 鲁甸地震强震动记录与地震动衰减模型的对比研究[J]. 地球物理学报,63(8):2999–3014. doi: 10.6038/cjg2020O0045 Zhang B,Li X J,Yu Y X,Li N,Zhu J. 2020. Comparison of strong ground motion records from Ludian,China,earthquake with ground-motion attenuation models[J]. Chinese Journal of Geophysics,63(8):2999–3014 (in Chinese).
张广伟,雷建设,梁姗姗,孙长青. 2014. 2014年8月3日云南鲁甸MS6.5级地震序列重定位与震源机制研究[J]. 地球物理学报,57(9):3018–3027. doi: 10.6038/cjg20140926 Zhang G W,Lei J S,Liang S S,Sun C Q. 2014. Relocations and focal mechanism solutions of the 3 August 2014 Ludian,Yunnan MS6.5 earthquake sequence[J]. Chinese Journal of Geophysics,57(9):3018–3027 (in Chinese).
张勇,陈运泰,许力生,魏星,金明培,张森. 2015. 2014 年云南鲁甸 MW6.1地震:一次共轭破裂地震[J]. 地球物理学报,58(1):153–162. doi: 10.6038/cjg20150113 Zhang Y,Chen Y T,Xu L S,Wei X,Jin M P,Zhang S. 2015. The 2014 MW6.1 Ludian,Yunnan,earthquake:A complex conjugated ruptured earthquake[J]. Chinese Journal of Geophysics,58(1):153–162 (in Chinese).
张振国,孙耀充,徐建宽,张伟,陈晓非. 2014. 2014年8月3日云南鲁甸地震强地面运动初步模拟及烈度预测[J]. 地球物理学报,57(9):3038–3041. doi: 10.6038/cjg20140928 Zhang Z G,Sun Y C,Xu J K,Zhang W,Chen X F. 2014. Preliminary simulation of strong ground motion for Ludian,Yunnan earthquake of 3 August 2014,and hazard implication[J]. Chinese Journal of Geophysics,57(9):3038–3041 (in Chinese).
Abrahamson N A,Silva W J,Kamai R. 2014. Summary of the ASK14 ground motion relation for active crustal regions[J]. Earthq Spectra,30(3):1025–1055. doi: 10.1193/070913EQS198M
Anderson J G,Hough S E. 1984. A model for the shape of the fourier amplitude spectrum of acceleration at high frequencies[J]. Bull Seismol Soc Am,74(5):1969–1993.
Boore D M. 1983. Stochastic simulation of high-frequency ground motions based on seismological models of the radiated spectra[J]. Bull Seismol Soc Am,73(6A):1865–1894.
Boore D M,Joyner W B. 1997. Site amplifications for generic rock sites[J]. Bull Seismol Soc Am,87(2):327–341. doi: 10.1785/BSSA0870020327
Boore D M. 2003. Simulation of ground motion using the stochastic method[J]. Pure Appl Geophys,160(3/4):635–676.
Boore D M. 2004. Estimating v̄S(30) (or NEHRP site classes) from shallow velocity models (depths < 30 m)[J]. Bull Seismol Soc Am,94(2):591–597. doi: 10.1785/0120030105
Boore D M,Stewart J P,Seyhan E,Atkinson G M. 2014. NGA-West2 equations for predicting PGA,PGV,and 5% damped PSA for shallow crustal earthquakes[J]. Earthq Spectra,30(3):1057–1085. doi: 10.1193/070113EQS184M
Brune J N. 1970. Tectonic stress and the spectra of seismic shear waves from earthquakes[J]. J Geophys Res,75(26):4997–5009. doi: 10.1029/JB075i026p04997
Campbell K W,Bozorgnia Y. 2014. NGA-West2 ground motion model for the average horizontal components of PGA,PGV,and 5% damped linear acceleration response spectra[J]. Earthq Spectra,30(3):1087–1115. doi: 10.1193/062913EQS175M
Chiou B S J,Youngs R R. 2014. Update of the Chiou and Youngs NGA model for the average horizontal component of peak ground motion and response spectra[J]. Earthq Spectra,30(3):1117–1153. doi: 10.1193/072813EQS219M
Frankel A. 1998. Simulating strong motions of large earthquakes using recordings of small earthquakes:The Loma Prieta mainshock as a test case[J]. Bull Seismol Soc Am,85(4):1144–1160.
Graves R W. 1996. Simulating seismic wave propagation in 3D elastic media using staggered-grid finite differences[J]. Bull Seismol Soc Am,86(4):1091–1106.
Graves R W,Pitarka A. 2010. Broadband ground-motion simulation using a hybrid approach[J]. Bull Seismol Soc Am,100(5A):2095–2123. doi: 10.1785/0120100057
Hu J J,Zhang Q,Jiang Z J,Xie L L,Zhou B F. 2016. Characteristics of strong ground motions in the 2014 MS6.5 Ludian earthquake,Yunnan,China[J]. J Seismol,20(1):361–373. doi: 10.1007/s10950-015-9532-x
Ou G B,Herrmann R B. 1990. A statistical model for ground motion produced by earthquakes at local and regional distances[J]. Bull Seismol Soc Am,80(6A):1397–1417. doi: 10.1785/BSSA08006A1397
Walling M,Silva W,Abrahamson N. 2008. Nonlinear site amplification factors for constraining the NGA models[J]. Earthq Spectra,24(1):243–255. doi: 10.1193/1.2934350
Wang H W,Wen R Z. 2019. Ground-motion simulation for the MW6.1 Ludian earthquake on 3 August 2014 using the stochastic finite-fault method[J]. Earthquake Science,32(3/4):101–114.
Yu Y, Silva W J, Darragh B, Li X J. 2016. vS30 estimate for Southwest China[J]. Int J Geophys: 9305095.


计量
- 文章访问数: 348
- HTML全文浏览量: 105
- PDF下载量: 148
