

Crustal structure in the Dasanjiang basin and its adjacent areas
-
摘要: 收集了大三江盆地及其邻区区域地震台网及多个流动台阵的连续波形及远震事件资料,采用背景噪声层析成像和接收函数叠加方法,分别获得了研究区三维S波速度结构、基底及莫霍面深度和泊松比。结果显示:浅层速度结构较好地反映了地表地形及地质特征,三江盆地呈明显的低速,虎林和勃利等小型盆地的S波速度也相对较低,而小兴安岭、张广才岭等则呈高速;到中下地壳层,盆地区则表现为明显的高速,表明到该深度层盆地已趋于稳定;依兰—伊通断裂下的低速异常延伸较深,表明它是一条较深的区域性断裂。接收函数结果显示:区内莫霍面的深度大约为30—36 km,整体较为平缓;在三江盆地内,前进坳陷的沉积层最厚,可达5.4 km,最薄处位于富锦隆起,为2.7 km,到西部绥滨断陷内沉积层又变厚,这与该盆地已知的两坳夹一隆的构造相一致。Abstract: We collected continuous waveforms and teleseismic events both from the regional permanent seismic network and several temporary seismic arrays in the Dasanjiang basin and its adjacent areas and obtained the 3D S-wave velocity structure, basement depth, Moho depth and Poisson’s ratio by using the ambient noise tomography and receiver function methods. Our results show that the shallow velocity structure corresponds well to the surface topography and geological features. The Sanjiang basin shows obvious low-velocity and small basins such as Hulin and Boli basins are also imaged as relatively low velocities, while the Xiaoxing’anling and Zhangguangcailing are characterized by high velocities. In the mid-lower crust, all basins show obvious high velocities, which indicates that they are stable at this depth. The low-velocity anomaly beneath the Yilan-Yitong fault extends down to deep, indicating that it is a regional deep fault. The results of the receiver function show that the Moho depth varies gently in the range of 30 km to 36 km. In the Sanjiang basin, the sedimentary thickness beneath Qianjin depression is the thickest, which could reach 5.4 km. While the sedimentary thickness beneath Fujin uplift is the thinnest, which could be 2.7 km. Beneath the western Suibin depression, sedimentary layer becomes thick again. The above features are consistent with the known tectonics of two depressions sandwiching one uplift.
-
引言
重要工程结构的抗震设计需要一定数量的且满足一定地震环境及场地条件的地震动加速度时程作为结构动力反应分析的输入;基于随机振动理论的结构地震反应分析也需要满足同一集系特征的地震动时程作为输入. 由于强震观测记录有限,不能满足上述地震工程的理论研究及实际应用中诸多方面的需求,因此,以随机过程理论为基础、利用数值方法合成满足给定地震动工程特性的人工地震动,即地震动模拟或仿真,一直是地震工程领域理论研究和工程应用中的热点问题(李英民,赖明,1998a,b,c). 地震动模拟应尽可能全面地反映实际天然地震动的工程特性,其合成的人工地震动应尽可能全面地模拟实际天然地震动对工程结构的影响效应.
由于地震震源的复杂破裂过程、地震波在地球介质中传播的频散现象以及地表土层非线性的力学行为,地震动通常具有非平稳特性,而且地震动的非平稳特性对工程结构的地震反应具有重要的影响(Kubo,1993;Hasgür,1995;杨红等,2001;Wang,2002;陈健云等,2003;曹晖,林学鹏,2006). 因此,研究人员提出了多种非平稳地震动的模拟方法,具体可分为4大类,即基于时域调制的方法(Scanlan,Sachs,1974; Rezaeian,Der Kiureghian,2008)、基于渐进谱的方法(Yeh,Wen,1990;Conte,Peng,1997;梁建文,2005a,b;Liang et al,2007;张翠然,陈厚群,2008)、基于自回归滑移平均(ARMA)模型的方法(Chang et al,1982;Cakmak et al,1985;Deodatis,Shinozuka,1988;Conte et al,1992)和基于傅里叶相位差谱的方法(杨庆山等,2001). 各种方法均有其局限性和适用范围(李英民,赖明,1998a,b,c;Zhang et al,2012). 基于希尔伯特变换的方法(Zhang et al,2012)则通过建立给定天然地震动瞬时相位的随机过程模型,实现对非平稳天然地震动的模拟. Zhang et al(2012)利用希尔伯特谱和Morlet小波谱,验证了该方法生成的地震动样本具有给定的天然地震动的非平稳特性,其时域波形的形态和能量的时频分布特征与天然地震动相同. 为了进一步研究该方法在模拟天然地震动工程特性方面的能力,本文将基于单自由度体系的弹塑性动力响应,深入验证该方法在模拟实际天然地震动峰值特性及其对工程结构影响效应方面的效果.
1. 基本方法
基于希尔伯特变换的非平稳地震动模拟方法基本流程如下:
1)给定天然地震动记录x0(t).
2)利用希尔伯特变换求出时程x0(t)的瞬时幅值 a0(t)和解卷后的瞬时相位θ0(t)如下:

式中P表示取广义积分的Cauchy主值.
3)利用傅里叶变换求出瞬时相位θ0(t)的傅里叶幅值谱Aθ,0(f)和相位谱Φθ,0(f):

式中Re和Im分别表示取复数的实部与虚部,i表示虚数单位,i2=-1.
4)利用汉宁(Hanning)窗对Φθ,0(f)进行低通滤波,

式中Hann[x(f)]表示对函数x(f)进行低通滤波处理后得到的低频分量.
5)假定Φθ,n(f)为随机过程Ψ(f)的一个样本,并且假定随机过程Ψ(f)为确定性函数A(f)与随机过程Θ(f)乘积的形式,即

其中确定性函数的形式如下:

式中Θ(f)假定为区间[-1, 1]均匀分布的随机频率过程,且满足: ① 对任意频率f,Θ(f)为区间[-1, 1]均匀分布的随机变量;② 若f1≠f2,则Θ(f1)与Θ(f2)为相互独立的随机变量.
6)按照下式构造与原始天然地震动x0(t)对应的随机过程x(t):

其中

7)设定不同的随机数,利用式(12)即可生成一系列与原始地震动具有相同非平稳特性的地震动样本xs(t).
上述方法的具体论述详见Zhang et al(2012). 通常该方法能够合理地模拟地震动的高频成分,但该方法在生成地震动样本时会引入一些额外的无意义的低频成分;另一方面,该方法假定地震动的低频成分为物理意义明确的确定性变量,进而通过建立高频成分的随机过程模型实现对非平稳地震动的模拟. 因此,利用该方法生成的地震动样本xs(t)通常要保留原始天然地震动样本x0(t)的频率低于截止频率fc的低频成分. 应当指出的是,由于震源机制、地震波传播路径及局部场地条件等因素的差异,天然地震动中物理意义明确的低频成分对应的截止频率亦不尽相同. 在实际工作中,应根据期望保留的低频成分的频带范围,合理地设定截止频率fc.
图1给出了原始El Centro波(El Centro台站获取的1940年美国Imperial Valley地震的南北分量记录,矩震级MW6.95,震中距12.99 km)的加速度、速度和位移波形;利用上述方法生成的一个人工地震动样本的相应波形如图2所示,可以看出,该方法生成的人工地震动样本与原始天然地震动样本具有相似的加速度、速度和位移波形.
![]() 图 2 模拟El Centro波的一个地震动样本的波形Figure 2. The waveform of one ground-motion sample simulating the El Centro wave
图 2 模拟El Centro波的一个地震动样本的波形Figure 2. The waveform of one ground-motion sample simulating the El Centro wave利用该方法共生成出与图1所示天然地震动相应的1 000个人工地震动样本,针对每个样本确定其峰值加速度、峰值速度和峰值位移,进而确定每个地震动参数分布的直方图,如图3所示. 其中,横轴为地震动参数的取值区间(共40个),纵轴为对应于每个取值区间的地震动样本数量,图中还标示出了原始天然地震动的峰值. 可以看出,该模拟方法生成的地震动样本的峰值大部分位于原始天然地震动的峰值附近. 因此,人工地震动样本能够较好地模拟实际天然地震动的峰值特性,包括峰值加速度、峰值速度和峰值位移特性.
![]() 图 3 模拟El Centro波的地震动样本峰值的分布(a)峰值加速度;(b)峰值速度;(c)峰值位移Figure 3. Distribution of the peak values of ground-motion samples simulating the El Centro wave(a)Peak ground acceleration;(b)Peak ground velocity;(c)Peak ground displacement
图 3 模拟El Centro波的地震动样本峰值的分布(a)峰值加速度;(b)峰值速度;(c)峰值位移Figure 3. Distribution of the peak values of ground-motion samples simulating the El Centro wave(a)Peak ground acceleration;(b)Peak ground velocity;(c)Peak ground displacement2. 方法验证
本文将利用理想单自由度体系的弹塑性动力响应,验证上述基于希尔伯特变换的非平稳地震动模拟方法在模拟天然地震动对结构影响效应方面的效果. 所涉及到的单自由度体系的动力响应参数如下所述.
单自由度体系在地面运动作用下动力响应的控制方程为

式中: m为振子的质量; c为体系的阻尼系数(采用黏滞阻尼理论);fs(u)为体系的恢复力,是振子相对地 面的位移u(即体系的变形)的函数; ü(t),(t)和u(t)分别为振子相对地面的加速度、速度和位移;üg(t)是地面运动的加速度;振子的初始速度和初始位移均为零. 对于理想弹塑性体系而言,恢复力和变形之间的关系如图4所示,uy为体系的屈服位移,fy为体系的屈服强度. 在变形达到uy之前,体系为线弹性体系,其刚度为k;当变形超过uy,体系为理想弹塑性体系,受输入地震动过程的影响,体系刚度在不同时刻取k或0. 针对理想弹塑性体系,定义与其相应的线性体系(corresponding linear system,简写为CLS)(Chopra,2001),该体系的质量和阻尼与弹塑性体系一致,其刚度为弹塑性体系屈服前的刚度. 弹塑性体系的“固有”周期和阻尼比分别定义为其CLS的“自振”周期和阻尼比,即

设在某一给定地震动作用下,弹塑性体系CLS的最大变形反应为u0,相应的恢复力为f0,如图4所示. 定义弹塑性体系的屈服强度降低因子(Chopra,2001)为

在给定地震动作用下,Ry越大,体系的动力响应就越早进入到弹塑性状态. 记体系弹塑性变形的最大值为um,体系的延性系数定义为

针对给定的地震动加速度üg(t),若给定弹塑性体系的固有周期T、阻尼比ζ及屈服强度降低因子Ry,则首先计算自振周期为T、阻尼比为ζ的CLS的最大相对位移反应u0,然后根据式(17)确定弹塑性体系的屈服位移uy=u0/Ry,进而利用常规数值积分方法(如Newmark法)求解式(15),即可确定与参数Ry相对应的体系弹塑性动力响应. 相应地,仿照弹性反应谱的定义,可以定义地震动üg(t)的弹塑性反应谱.

分别称为弹塑性绝对加速度反应谱、相对速度反应谱和相对位移反应谱,分别表示在给定屈服强度降低因子Ry的条件下,给定地震动引起的不同体系的弹塑性绝对加速度反应、相对速度反应和相对位移反应的最大值. 除上述体系最大响应之外,地震动对体系的输入能量以及体系自身的阻尼耗能和弹塑性滞回耗能也是描述地震动对结构影响效应的重要参数. 在式(15)两边分别乘以du并积分可得

上式等号左边3项依次为振子动能Ek、体系阻尼耗能Ed和体系弹塑性滞回耗能Eh,等号右边为地震动对体系总的输入能量E1. 针对给定地震动,这些能量是体系自身特性(以参数T、ζ和Ry描述)的函数,且有

分别称为弹塑性输入能量谱、阻尼耗能谱和滞回耗能谱,其中Td为地震动总的持续时间. 式(20)—(22)与式(24)—(26)定义了地震动相应于屈服强度因子Ry的弹塑性反应谱. 另外,地震动相应于延性系数μ的弹塑性需求谱定义如下. 对于给定的地震动加速度üg(t),使得弹塑性体系(T,ζ)的延性系数达到μ所需的体系屈服位移为uy,则可定义地震动的弹塑性需求谱为

针对给定地震动üg(t)、参数T、ζ和μ,可以采用迭代的方法确定上述弹塑性需求谱(Chopra,2001). 弹塑性需求谱的工程意义在于,结构在给定地震动作用下,其塑性变形发展程度(即其破坏程度)达到指定要求(以μ描述)所需的结构屈服位移. 对于弹性体系,μ=1,不允许其发生塑性变形,那么其屈服位移就必须大于或等于在给定地震动作用下结构弹性相对位移反应的最大值. 此外,对于μ=1,即弹性体系,式(27)定义的地震动需求谱等同于其弹性相对位移反应谱,因为地震动在某一控制周期处的弹性相对位移反应谱可理解为在该地震动作用下,使得相应体系保持弹性所需的最小屈服位移. 利用式(27)定义的需求谱可定义伪速度需求谱如下:

定义了上述地震动的各类弹塑性谱之后,即可利用这些参数描述地震动对弹塑性体系的影响效应,进而利用其对上述模拟方法进行验证.
针对图1所示的原始El Centro波,利用基于希尔伯特变换的模拟方法生成与其具有相似非平稳特性的30个地震动样本,计算所有地震动样本与屈服强度因子Ry=3相对应的弹塑性绝对加速度反应谱、相对速度反应谱、相对位移反应谱、输入能量谱、阻尼耗能谱、滞回耗能谱,以及分别与延性系数μ=1(弹性)和μ=4相对应的伪速度需求谱(由式(28)定义),具体计算结果如图5所示. 基于希尔伯特变换的地震动模拟方法将给定的天然地震动视为某一随机过程的一个样本或一次实现,通过建立地震动瞬时相位的随机过程模型实现对该地震动随机过程的求解. 从图5中可以看出,作为同一随机过程的不同样本,人工地震动样本能够很好地模拟实际天然地震动样本在弹塑性反应谱、输入能量谱、阻尼耗能谱、滞回耗能谱以及弹塑性需求谱方面的特征. 而上述几类谱均从不同角度描述了地震动对结构的影响效应,因此,基于希尔伯特变换的地震动模拟方法生成的人工地震动样本能够较好地模拟实际天然地震动样本对结构的影响效应.
![]() 图 5 原始El Centro波与人工地震动样本频谱的比较(a) Absolute acceleration response spectrum (Ry=3);(b) Relative velocity response spectrum (Ry=3);(c) Relative displacement response spectrum (Ry=3);(d) Input energy spectrum (Ry=3);(e) Damping dissipated energy spectrum (Ry=3);(ƒ) Hysteretic dissipated energy spectrum (Ry=3);(g) Pseudo-velocity dem and spectrum (μ=1);(h) Pseudo-velocity dem and spectrum (μ=4).Thick black lines denote spectra of original ground motion,and thin grey lines denote spectra of simulated ground-motion samplesFigure 5. Comparison of the spectra of original El Centro wave with those of artificial ground-motion sample
图 5 原始El Centro波与人工地震动样本频谱的比较(a) Absolute acceleration response spectrum (Ry=3);(b) Relative velocity response spectrum (Ry=3);(c) Relative displacement response spectrum (Ry=3);(d) Input energy spectrum (Ry=3);(e) Damping dissipated energy spectrum (Ry=3);(ƒ) Hysteretic dissipated energy spectrum (Ry=3);(g) Pseudo-velocity dem and spectrum (μ=1);(h) Pseudo-velocity dem and spectrum (μ=4).Thick black lines denote spectra of original ground motion,and thin grey lines denote spectra of simulated ground-motion samplesFigure 5. Comparison of the spectra of original El Centro wave with those of artificial ground-motion sample图6给出了TCU052台站记录到的1999年台湾集集地震的南北分量地震动波形(矩震级MW7.62,震中距39.58 km). 该记录的一个最大特征是其速度波形曲线出现了一个显著的低频脉冲,同时导致地表出现了永久性的位移,如图6中位移曲线所示. 基于希尔伯特变换的模拟方法生成的与图6所示记录相应的一个地震动样本如图7所示. 该模拟方法主要针对随机特征明显的地震动高频成分进行随机建模,实现对天然地震动的模拟,在此过程中保留了具有较明确物理意义的地震动低频成分. 对于图6所示天然地震动而言,其速度和位移波形均受地震动低频成分控制,因此,即使该方法生成的地震动加速度与原始天然加速度波形在高频成分方面存在一定的差异,但速度和位移样本与原始天然地震动相似,如图6和图7所示. 图6所示的天然地震动样本与30个人工地震动样本不同类型弹塑性谱之间的比较如图8所示. 从该图中可以看出,人工地震动样本较好地模拟了实际天然地震动的工程特性.
![]() 图 6 原始TCU052台站记录到的1999年台湾集集地震的南北分量地震动波形Figure 6. Waveforms of original TCU052 recordings obtained in 1999 Taiwan Jiji(Chi-Chi)earthquake
图 6 原始TCU052台站记录到的1999年台湾集集地震的南北分量地震动波形Figure 6. Waveforms of original TCU052 recordings obtained in 1999 Taiwan Jiji(Chi-Chi)earthquake![]() 图 7 模拟TCU052台站记录的一个地震动样本的波形Figure 7. Waveforms of one ground-motion sample simulating TCU052 recordings
图 7 模拟TCU052台站记录的一个地震动样本的波形Figure 7. Waveforms of one ground-motion sample simulating TCU052 recordings![]() 图 8 原始TCU052记录频谱与人工地震动样本频谱的比较(a) Absolute acceleration response spectrum (Ry=3);(b) Relative velocity response spectrum (Ry=3); (c) Relative displacement response spectrum (Ry=3);(d) Input energy spectrum (Ry=3);(e) Damping dissipated energy spectrum (Ry=3);(ƒ) Hysteretic dissipated energy spectrum (Ry=3);(g) Pseudo- velocity dem and spectrum (μ=1);(h) Pseudo-velocity dem and spectrum (μ=4).Thick black lines denote spectra of original ground motion,and thin grey lines denote spectra of simulated ground-motion samplesFigure 8. Comparison of the spectra of original TCU052 recordings with those of artificial ground-motion sample
图 8 原始TCU052记录频谱与人工地震动样本频谱的比较(a) Absolute acceleration response spectrum (Ry=3);(b) Relative velocity response spectrum (Ry=3); (c) Relative displacement response spectrum (Ry=3);(d) Input energy spectrum (Ry=3);(e) Damping dissipated energy spectrum (Ry=3);(ƒ) Hysteretic dissipated energy spectrum (Ry=3);(g) Pseudo- velocity dem and spectrum (μ=1);(h) Pseudo-velocity dem and spectrum (μ=4).Thick black lines denote spectra of original ground motion,and thin grey lines denote spectra of simulated ground-motion samplesFigure 8. Comparison of the spectra of original TCU052 recordings with those of artificial ground-motion sample3. 结论
非平稳地震动模拟方法生成的地震动样本不仅需要在时域波形曲线的形态以及能量的时频分布特征等方面与原始天然地震动相似,而且对于工程而言,所生成的样本还需要如实地模拟实际天然地震动对结构的影响效应. 基于希尔伯特变换的非平稳地震动模拟方法通过对实际天然地震动瞬时相位的随机建模,实现了对天然地震动非平稳特性的模拟,并且最初的研究也论证了该方法在模拟天然地震动时域波形曲线的形态以及能量的时频分布特征方面的效果(Zhang et al,2012). 作为对该方法的进一步验证,本文基于理想弹塑性单自由度体系的动力响应,验证了该方法在模拟天然地震动对结构影响效应方面的效果. 结果表明,该方法生成的地震动样本能够较好地模拟实际天然地震动的工程特性. 在地震工程的理论研究和工程实践中,可以利用该方法合成出与给定天然地震动具有相同特性的一系列地震动样本,进而采用蒙特卡洛(Monte Carlo)方法开展结构随机地震反应的数值模拟研究,从而为地震动工程特性的研究和结构可靠度分析提供基础.
-
![]()
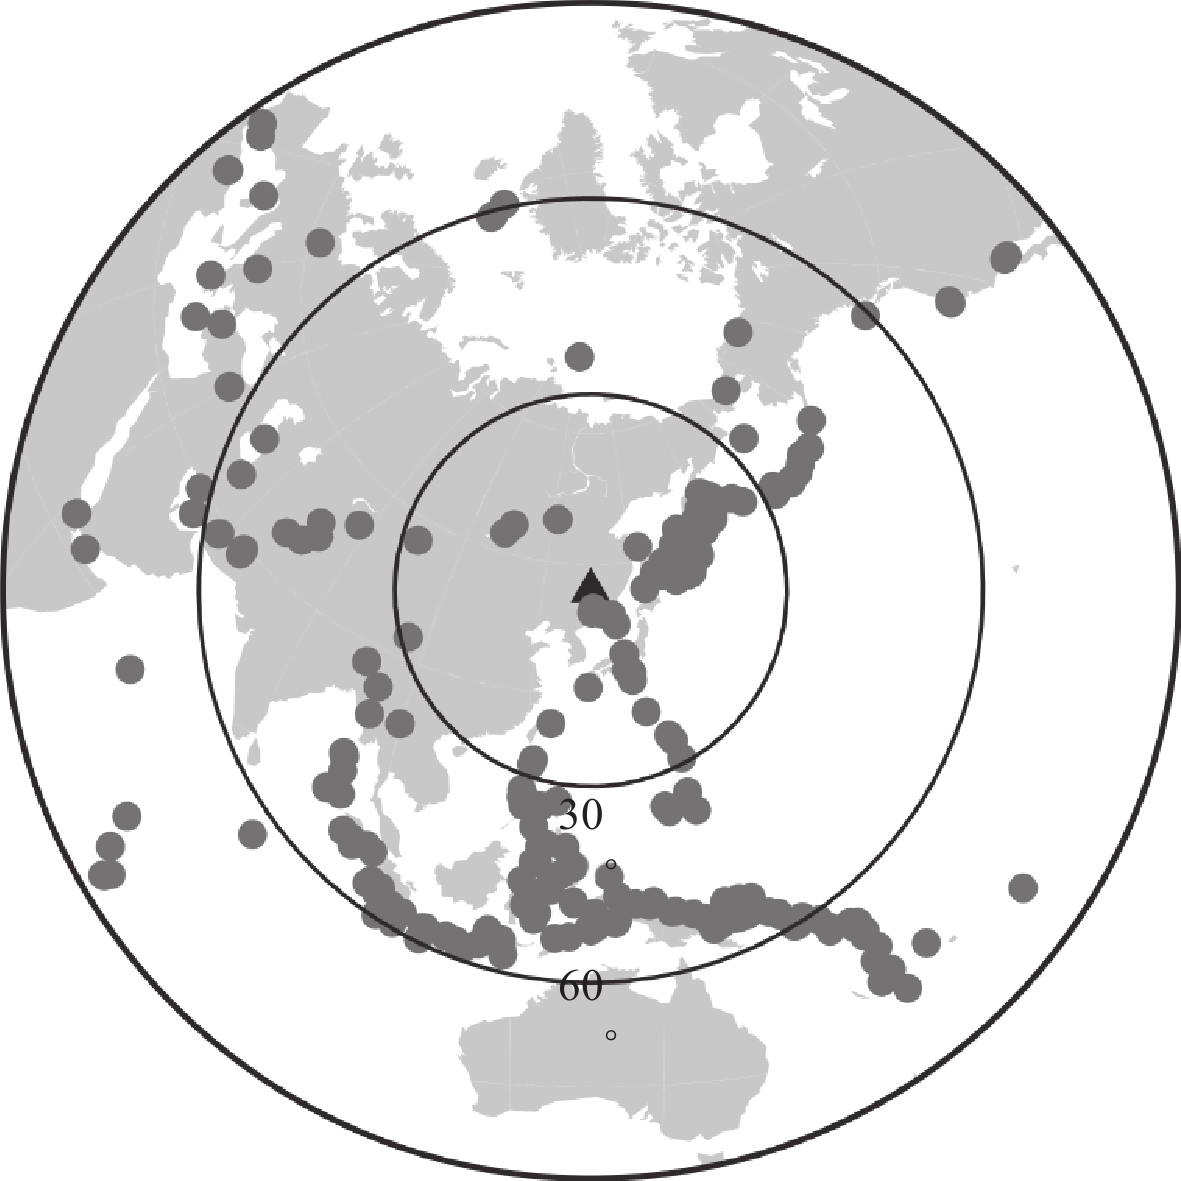
图 1 研究区主要构造背景及所用地震台站分布
图中白色三角形为中国数字地震台网固定台站,黑色圆点为多国合作布设的东北流动台阵(NECESSArray)的流动台站,黑色三角形为中国地震局地球物理研究所布设的五大连池—虎林和满洲里—绥芬河宽频带地震测线的流动台站;黑色粗线为图4中5条S波速度剖面Ⅰ −Ⅴ。灰色线为三江盆地内的次级构造单元边界,其中① 前进坳陷,② 富锦隆起,③ 绥滨断陷. 黑线代表区域主要断裂,F1:牡丹江断裂;F2:敦密断裂;F3:依兰—伊通断裂,下同
Figure 1. Map showing the major geological features of the studied area and distribution of seismic stations used in the study
White triangles represent permanent stations from China digital seismic network,black dots represent temporary stations from the NECESSArray,the black triangles represent temporary stations of Wudalianchi-Hulin and Manzhouli-Suifenhe broadband seismic survey lines which were performed by Institute of Geophysics,China Earthquake Administration. The thick black lines are the location of five profiles,the serial numbers of which are marked at the left end of the profile. The gray lines are the boundary of secondary tectonic units in Sanjiang basin,① Qianjin depression;② Fujin uplift;③ Suibin depression. The black lines represent major faults in the region,F1:Mudanjiang fault; F2:Dunmi fault;F3:Yilan-Yitong fault,the same below
![]()
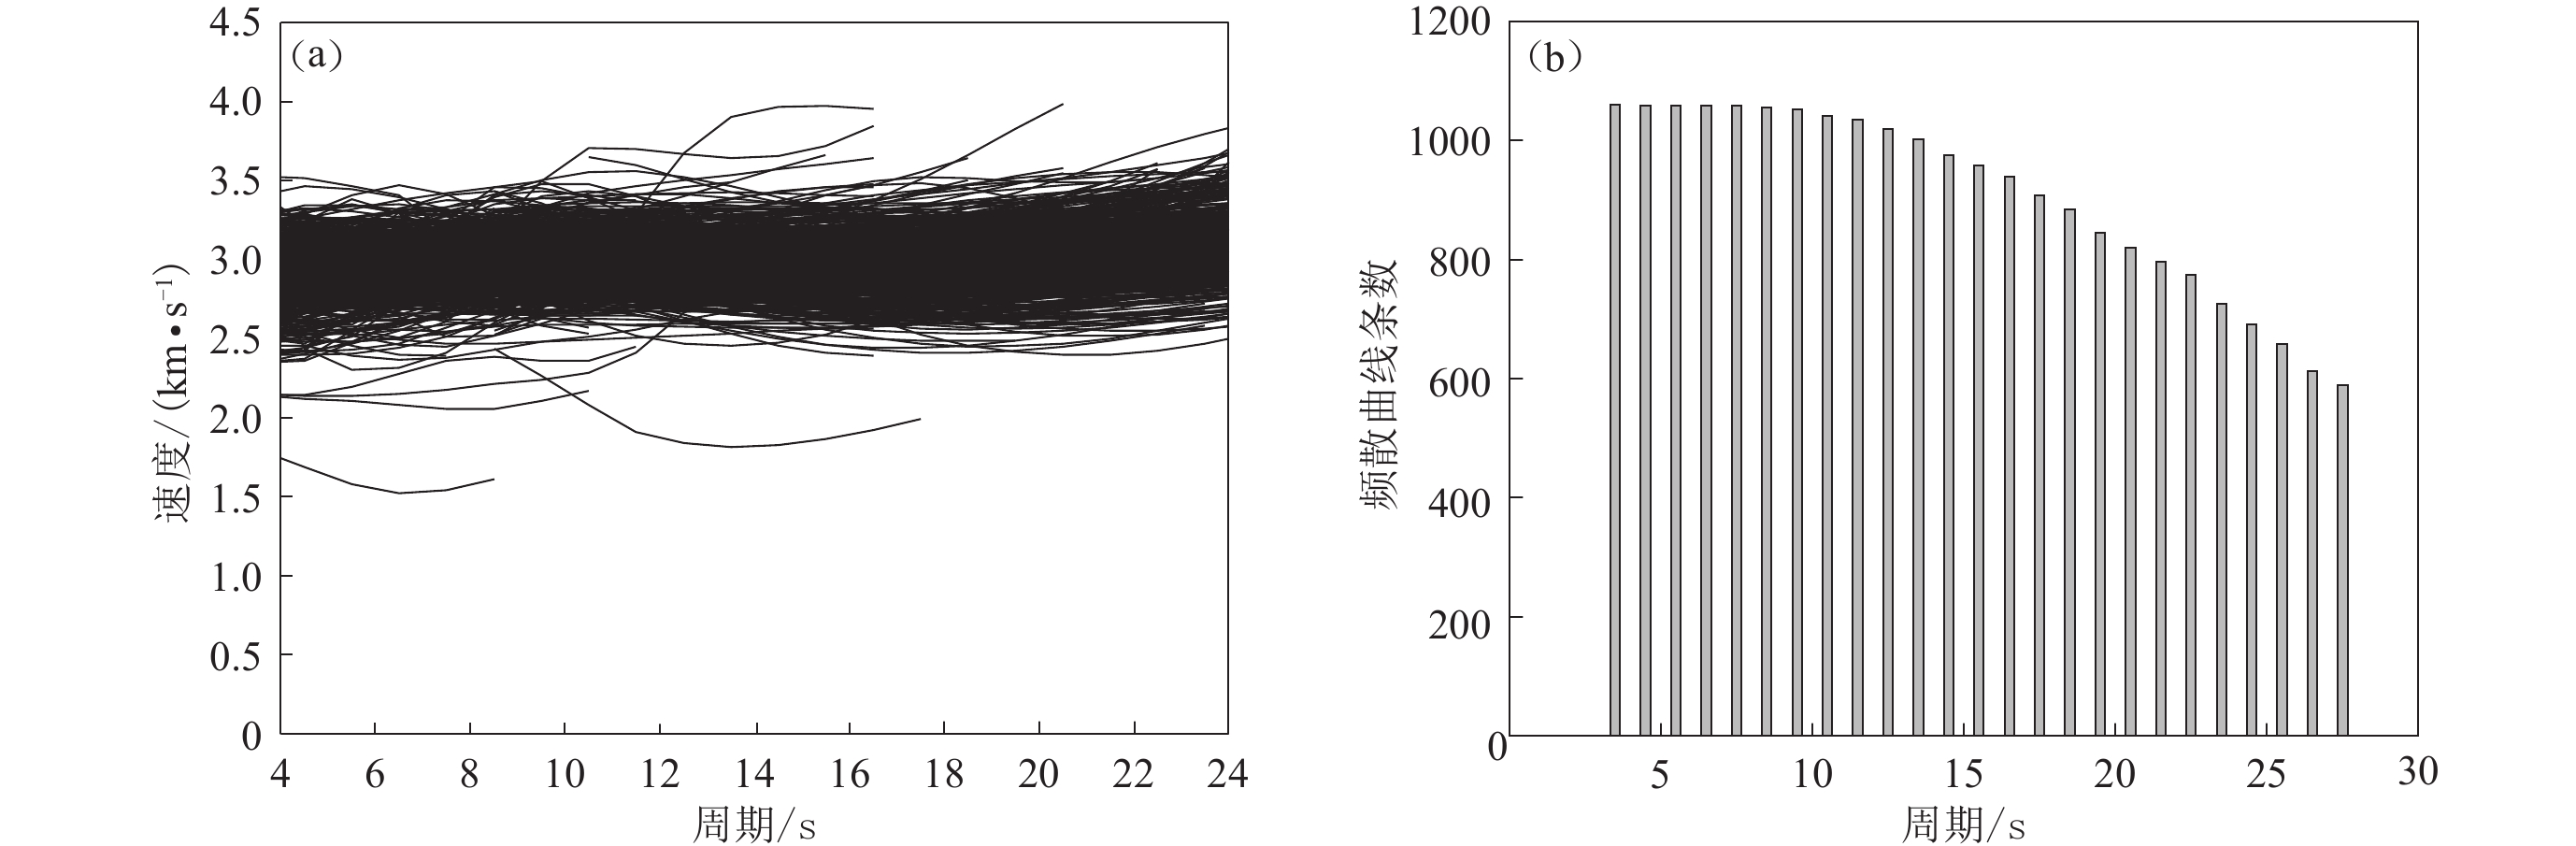
图 3 群速度频散曲线 (a) 和不同周期的频散数量 (b)
Figure 3. Dispersion curve of group velocity (a) and the number of dispersions in different periods (b)
![]()
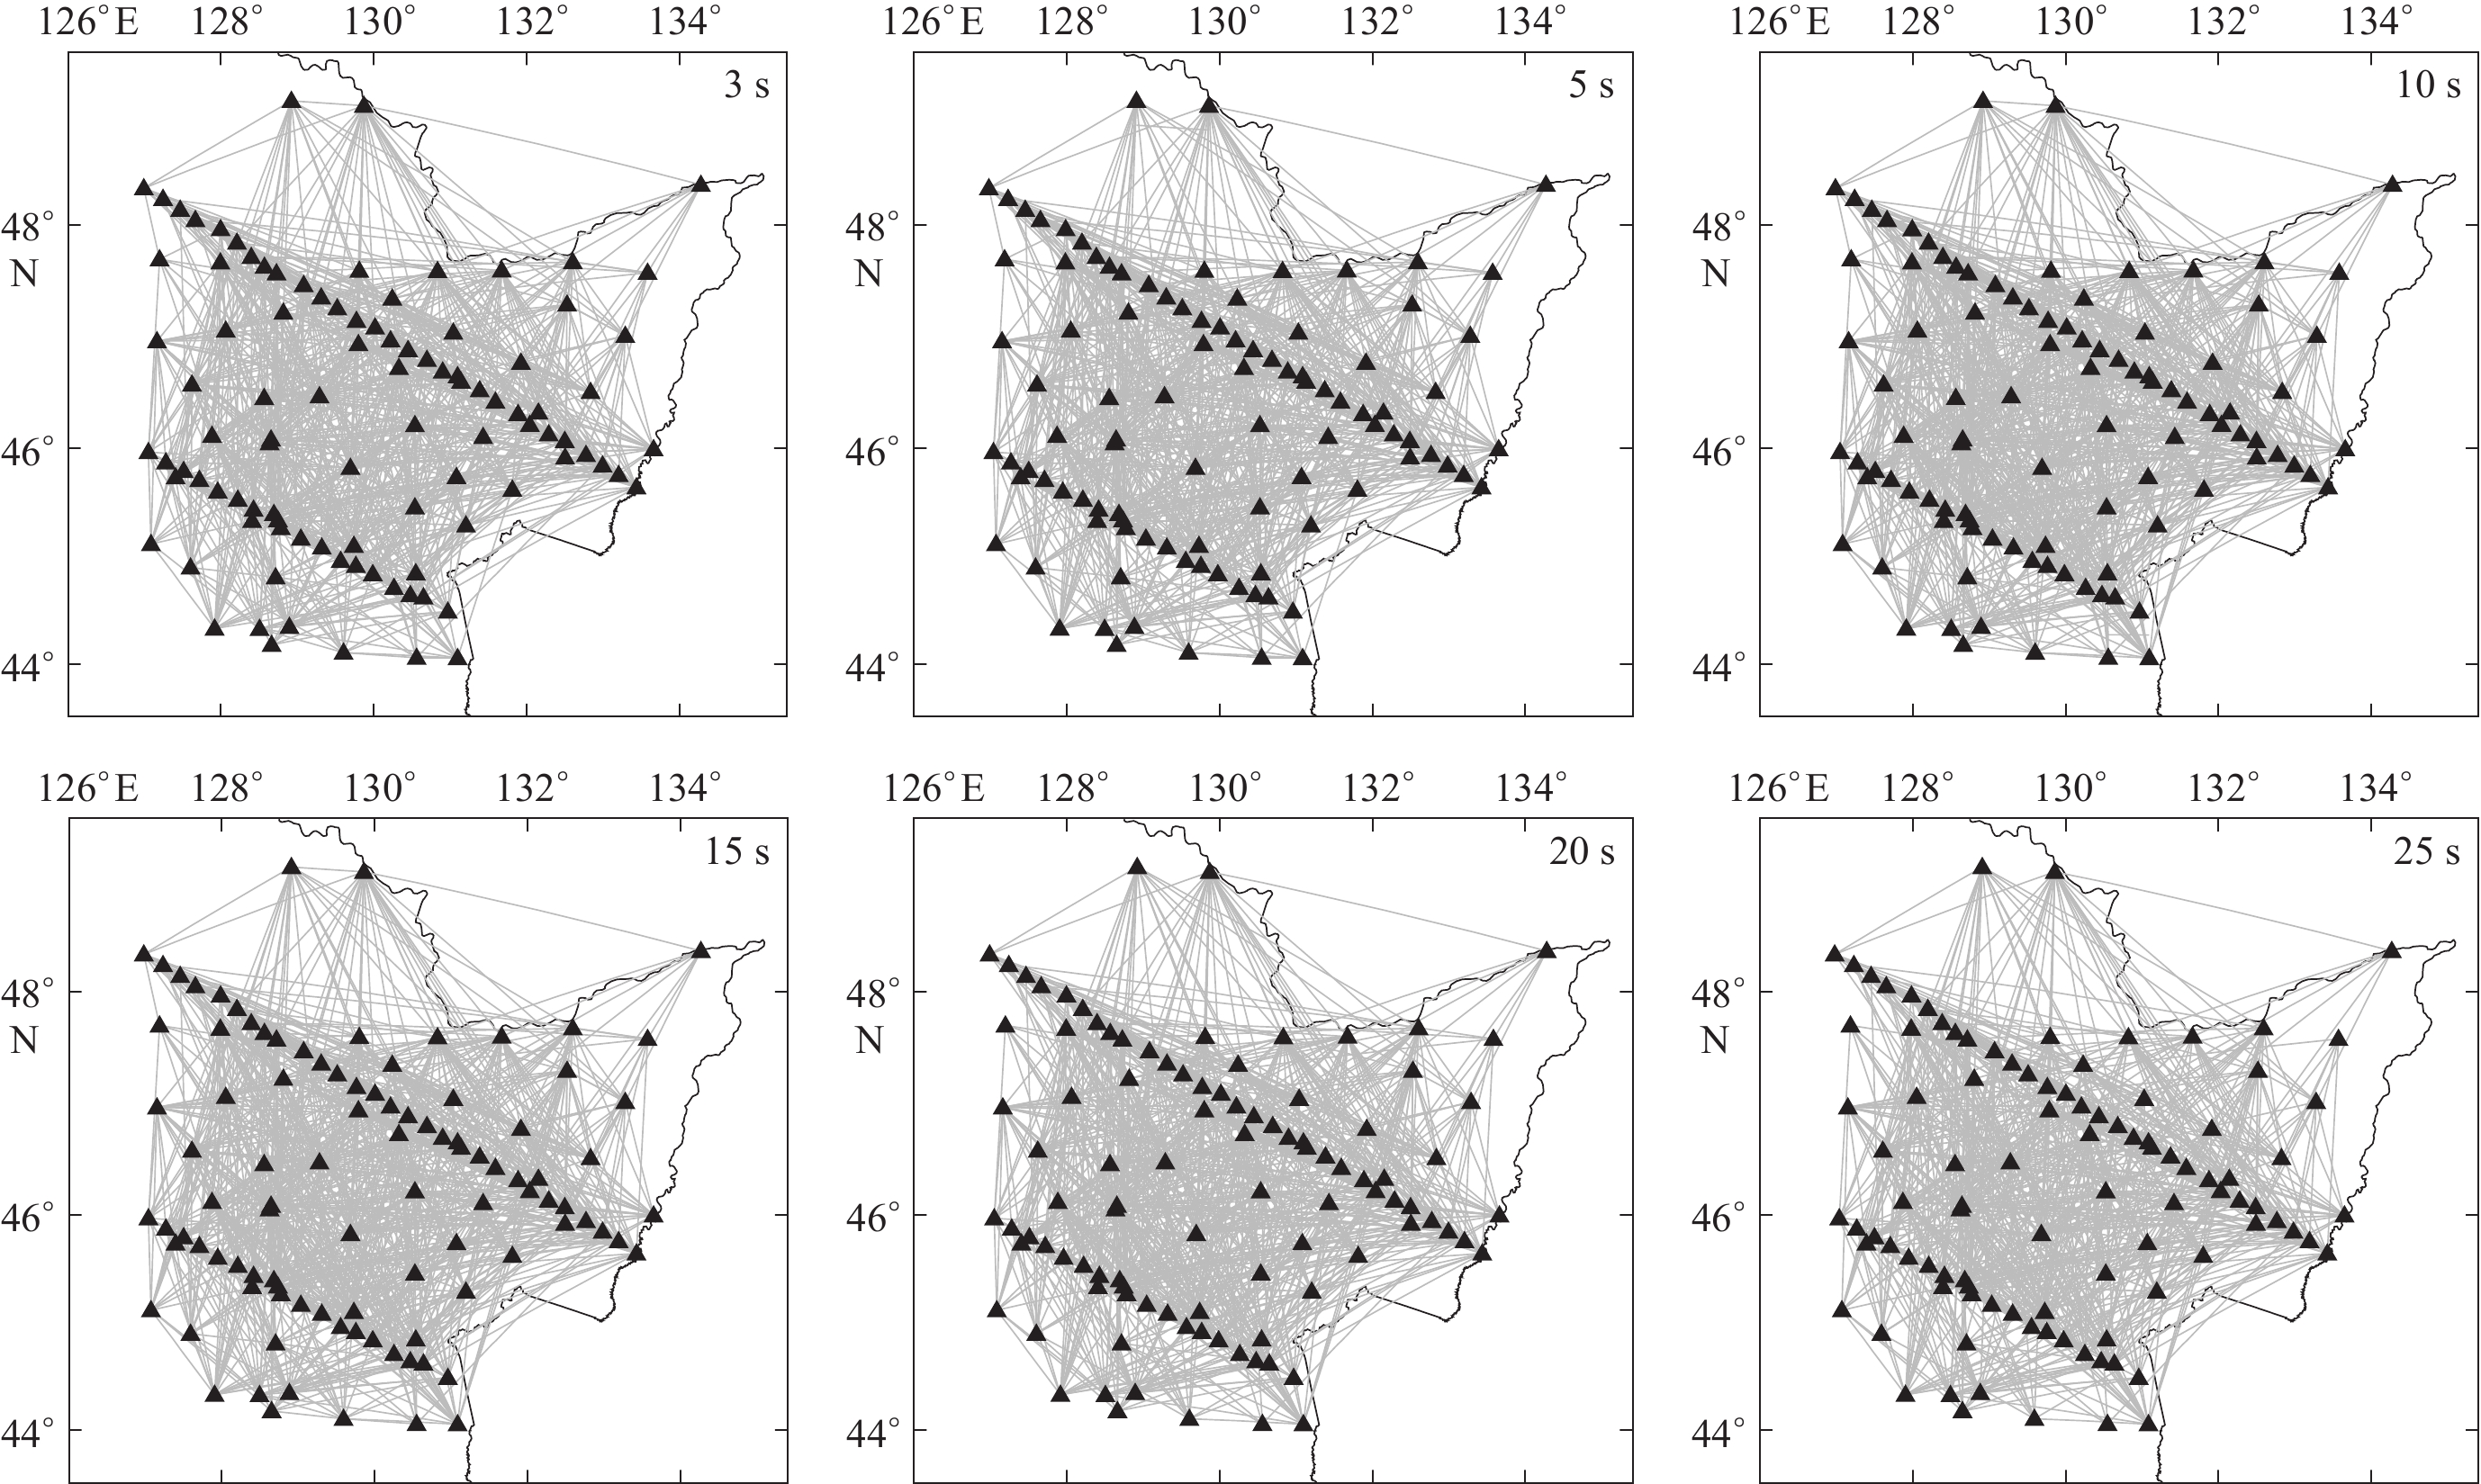
图 4 几个典型周期的群速度射线路径分布图
黑色三角形为台站,灰线为射线路径,各子图中右上角标出了相应的周期
Figure 4. Ray-paths of group velocity at several representative periods
Black solid triangles denote seismic stations,gray lines denote ray paths,and the period is marked at the upper right corner of each panel
![]()
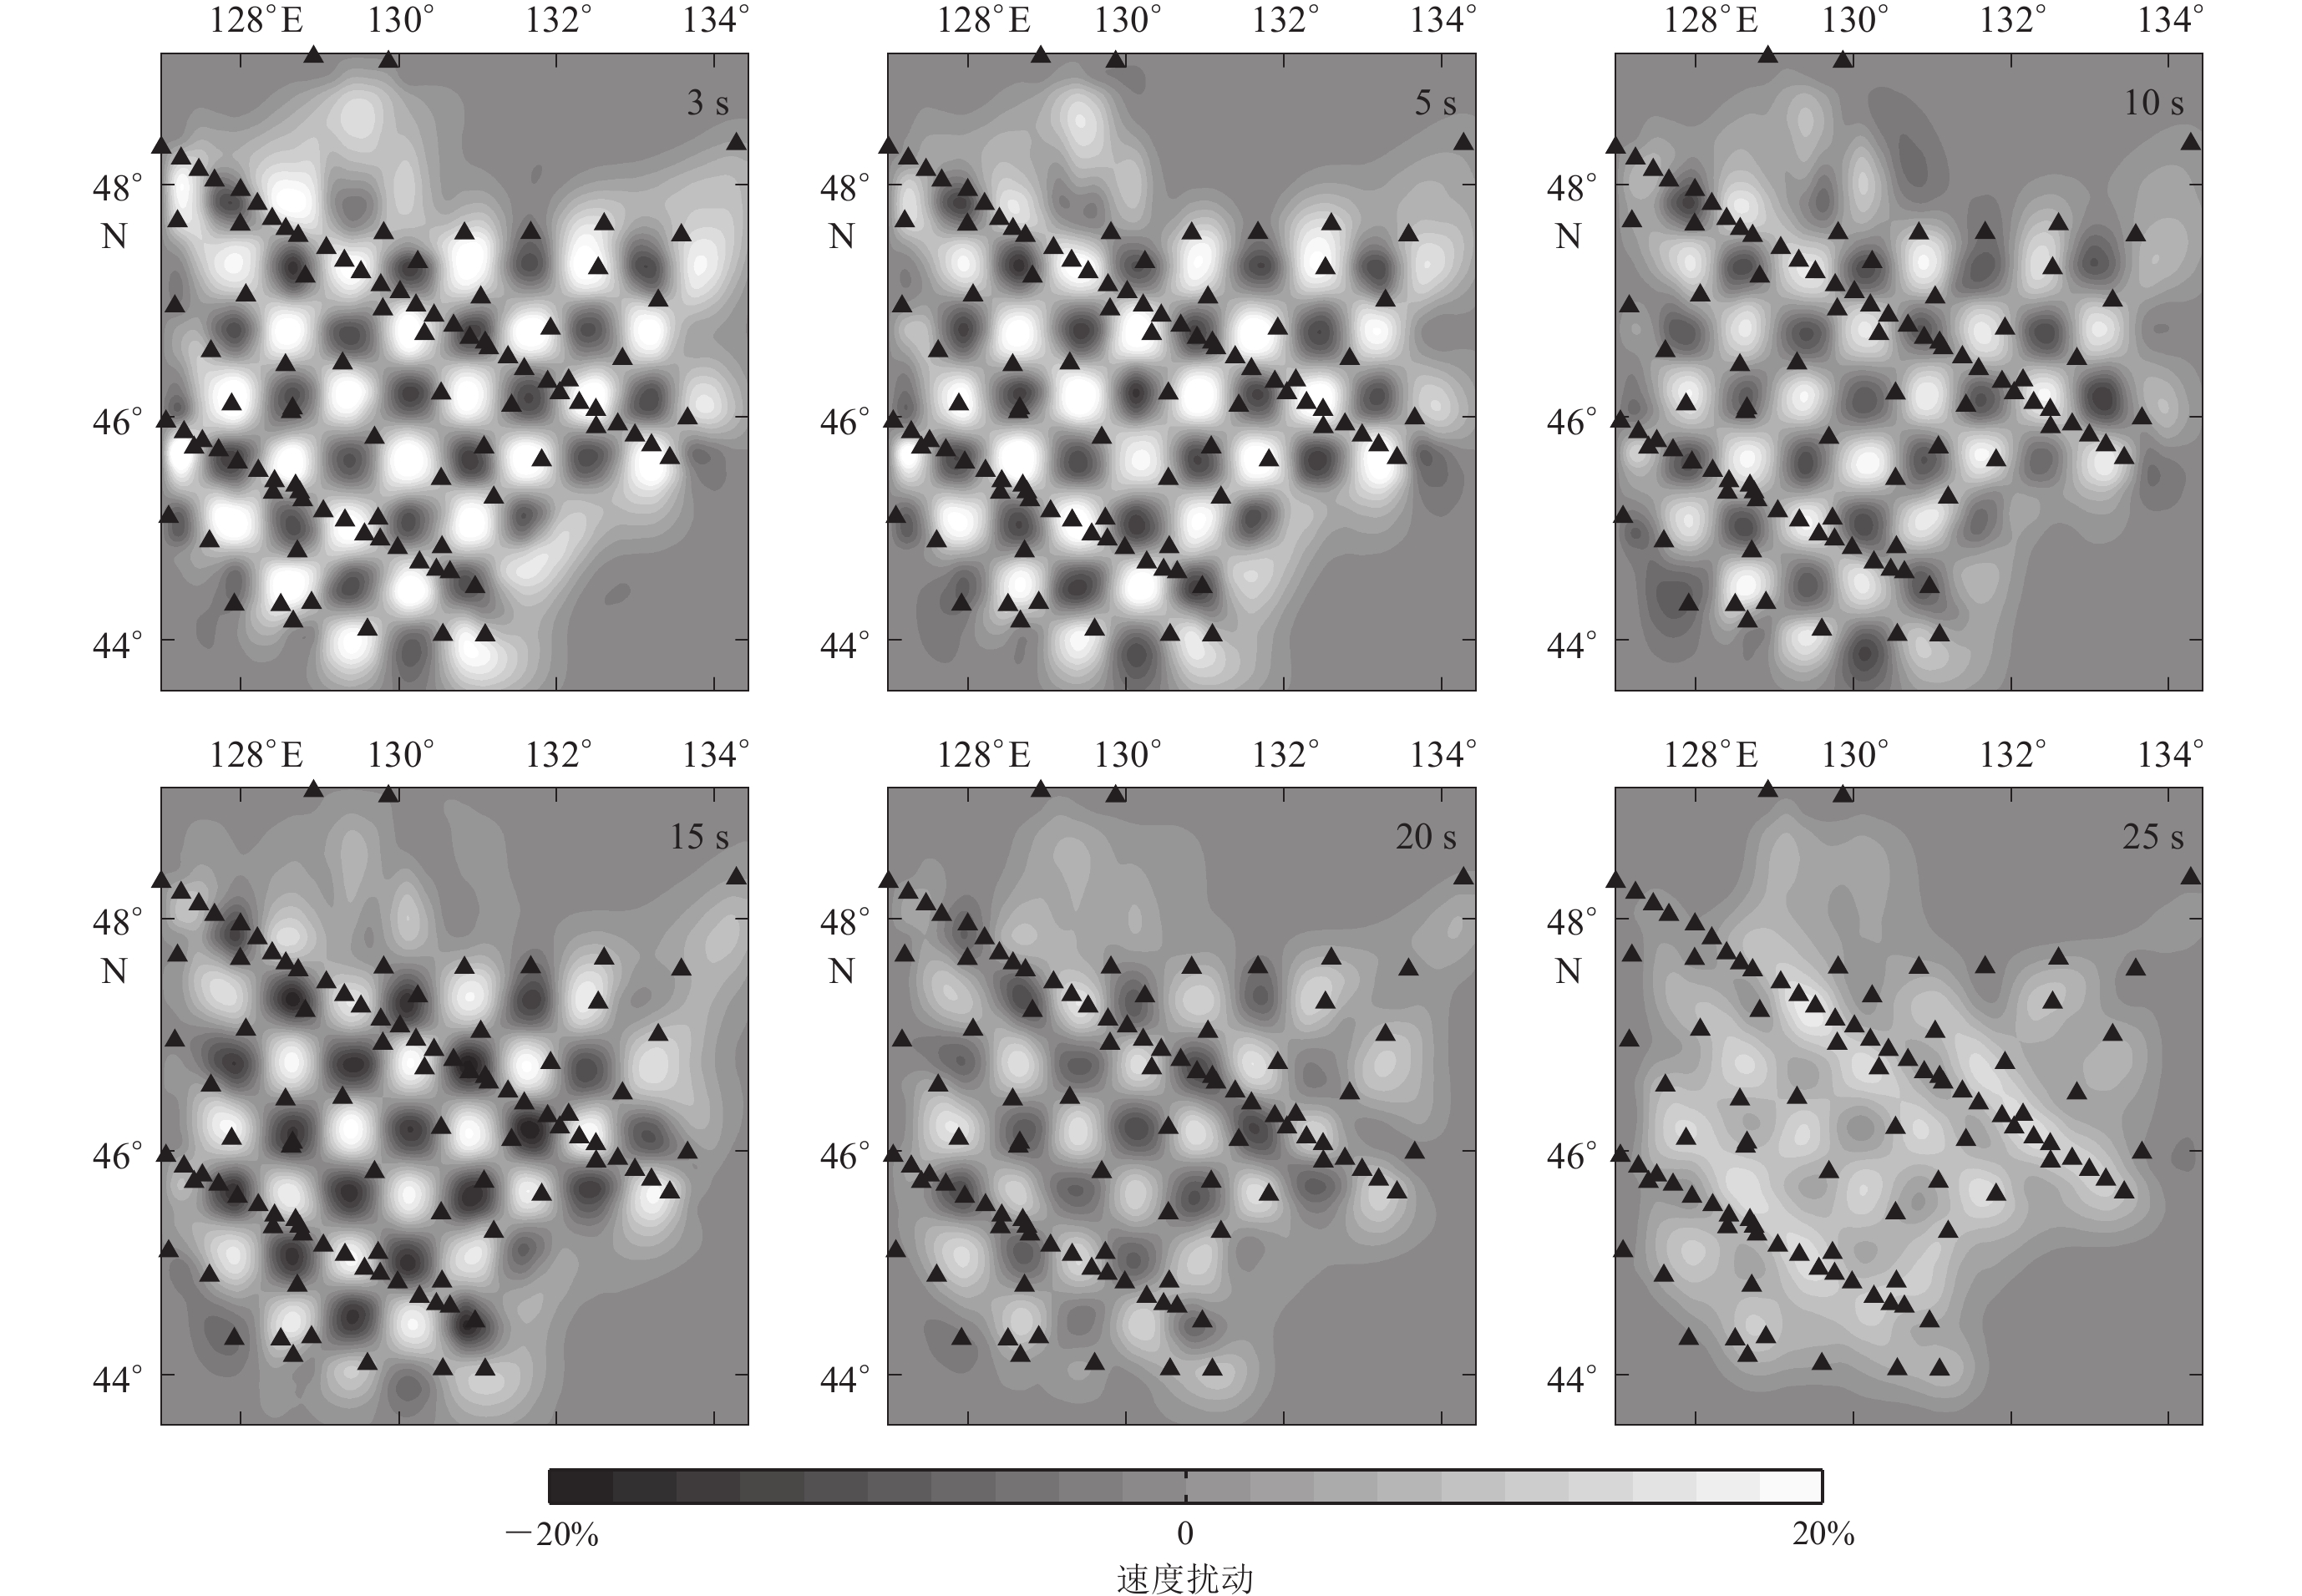
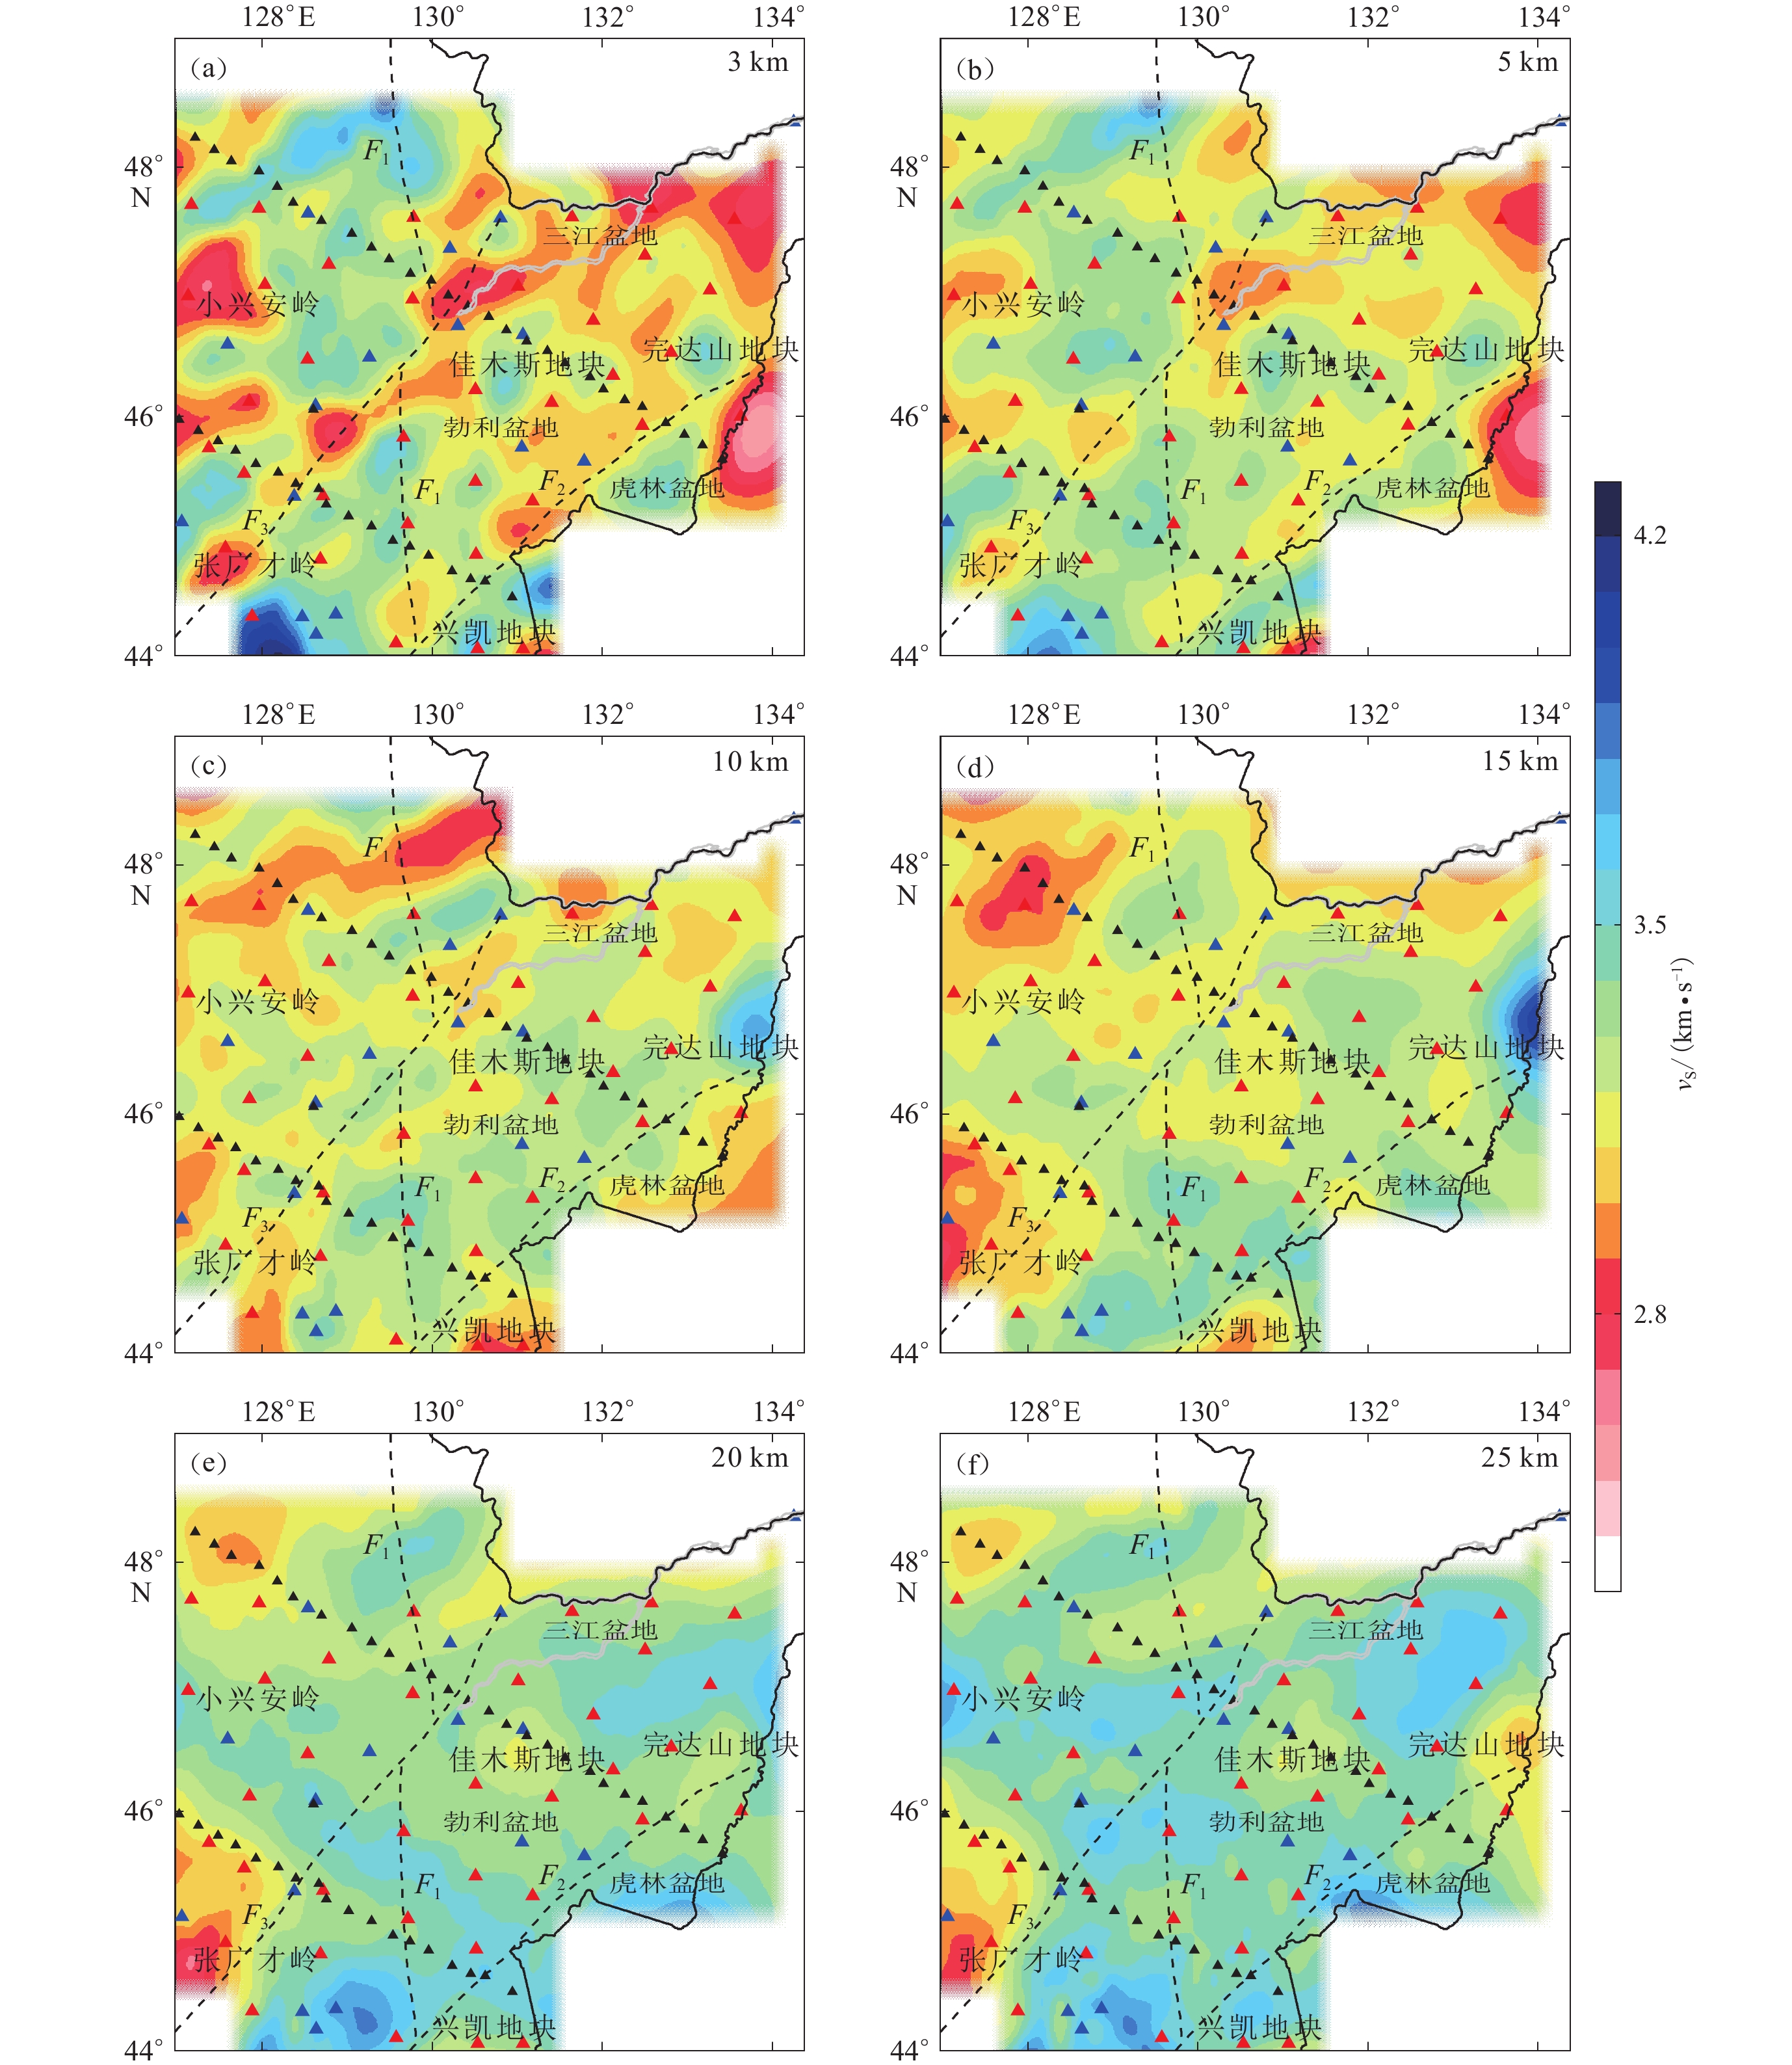
图 6 不同深度层上的S波速度平面图
每层的深度标在各子图的右上角,蓝色三角形为中国数字地震台网固定台站,红色三角形为多国合作布设的东北台阵(NECESSArray)的流动台站,黑色三角形为中国地震局地球物理所布设的五大连池—虎林和满洲里—绥芬河宽频带地震测线的流动台站。其它标识同图1
Figure 6. S-wave velocity map at each depth slice
The depth of each layer is shown at the upper right corner of each panel. Blue triangles represent permanent stations from China digital seismic network,red triangles represent temporary stations from the NECESSArray,the black triangles represent temporary stations of Wudalianchi-Hulin and Manzhouli-Suifenhe broadband seismic survey lines. Other labels are the same as those in Fig. 1 (a) 3 km;(b) 5 km;(c) 10 km;(d) 15 km;(e) 20 km;(f) 25 km
![]()
图 7 S波速度剖面图(剖面位置示于图1中)
Figure 7. Vertical cross sections of S-wave along different profiles shown in Fig. 1)
![]()
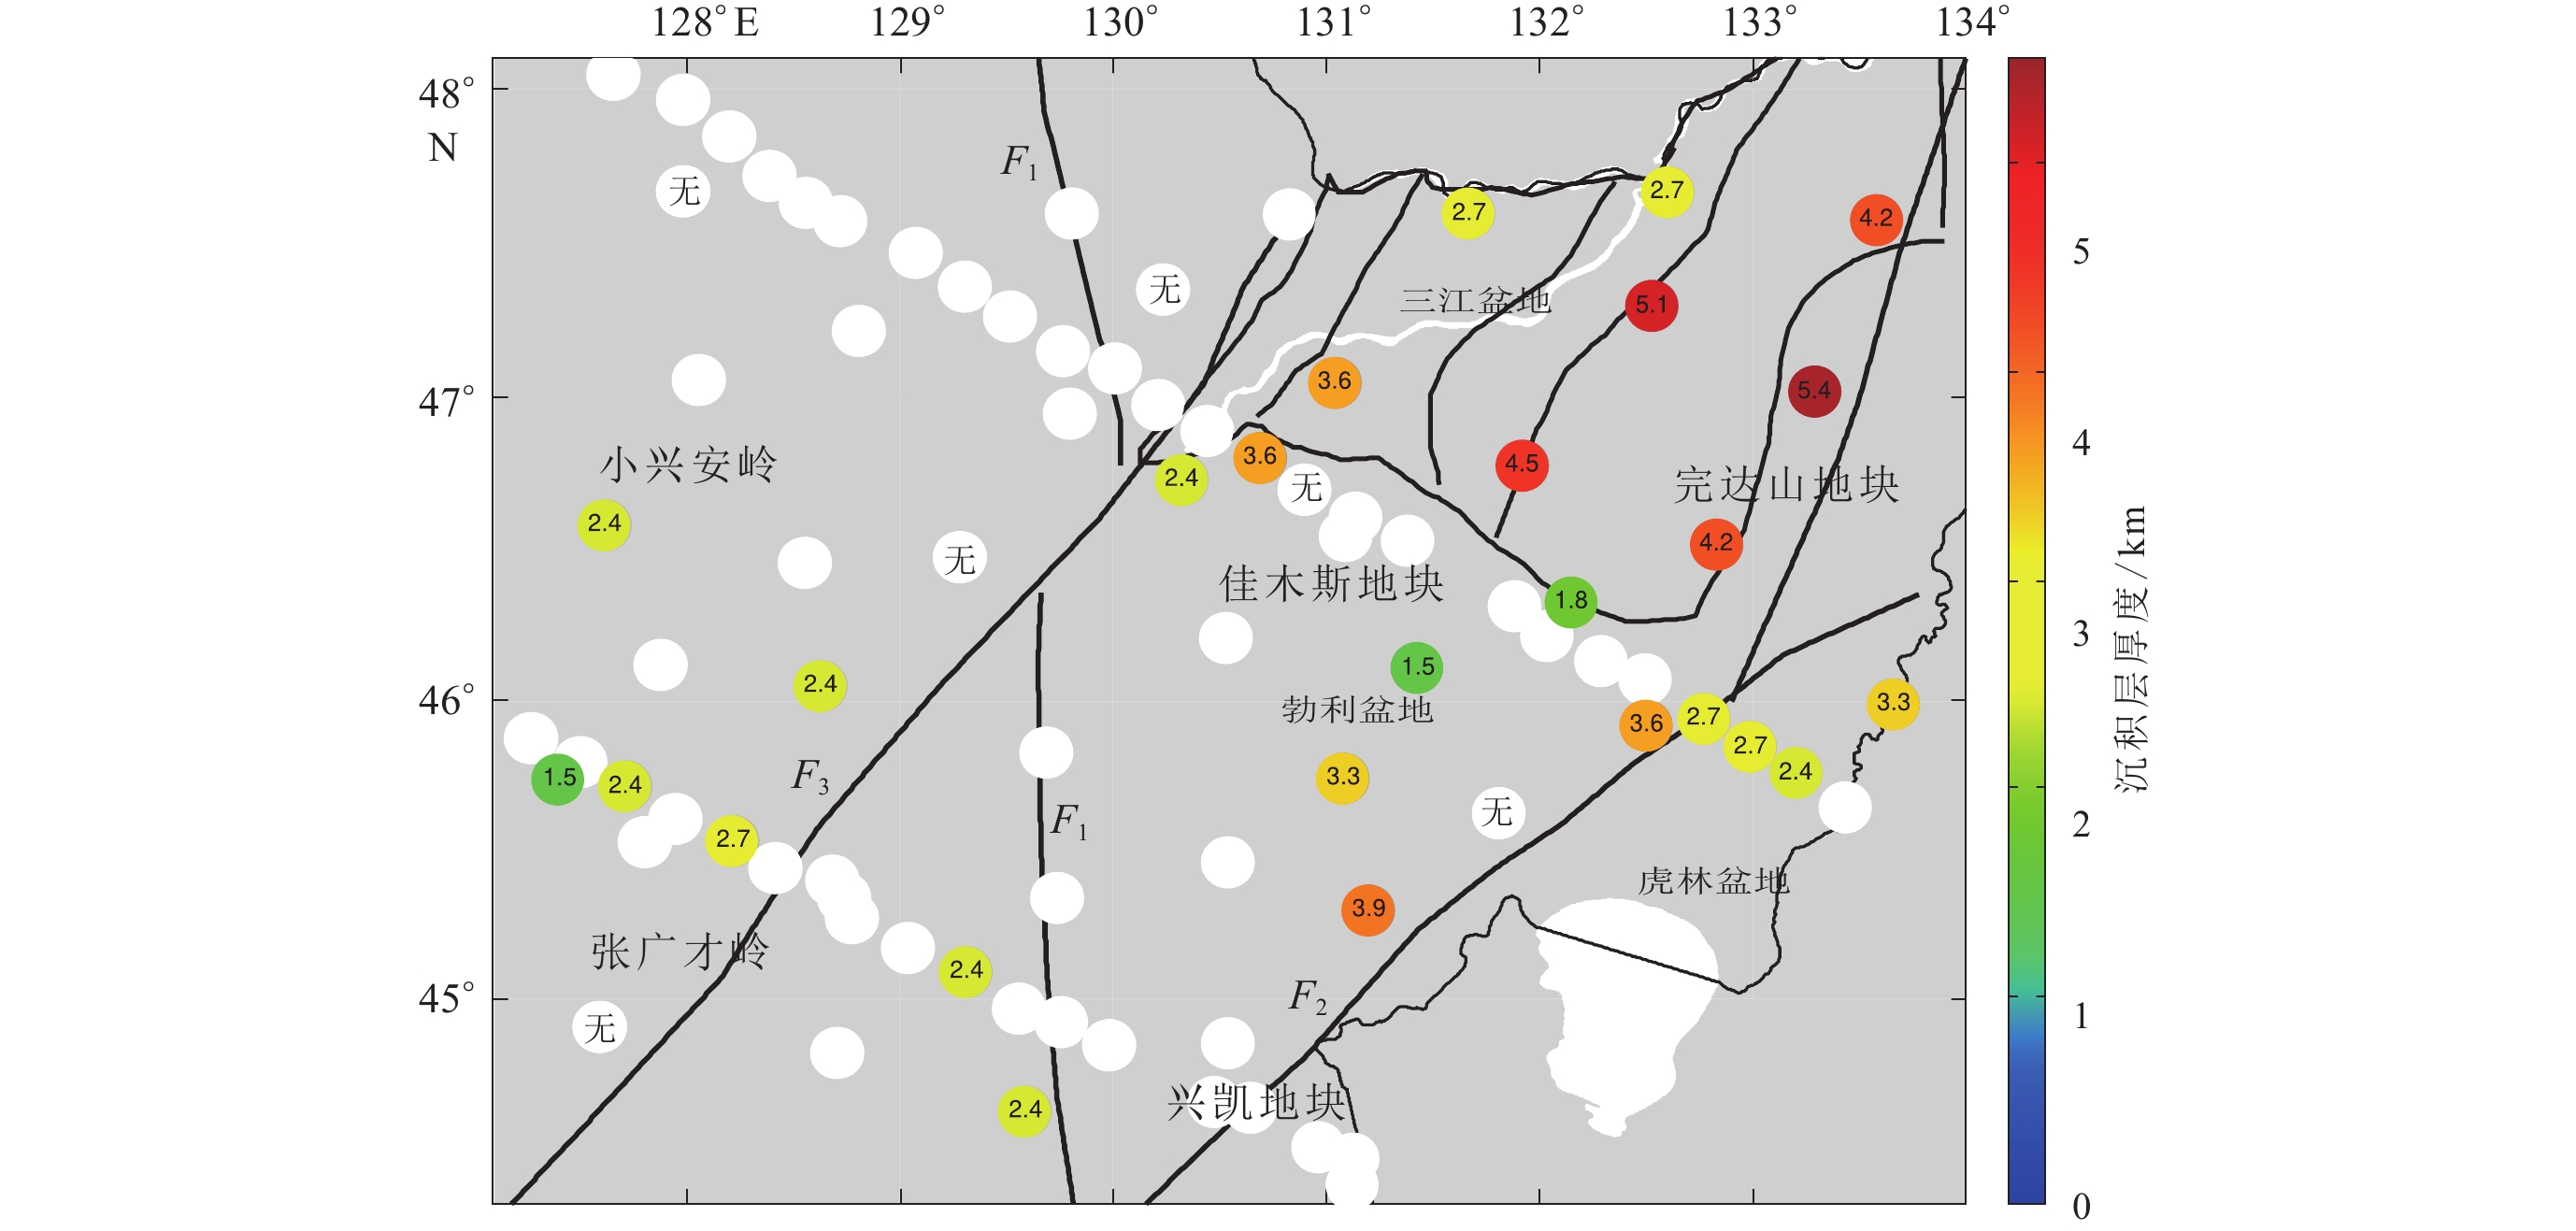
图 8 研究区地震台站下方沉积层厚度图
白色圆点表示计算后得到的台站下方沉积层厚度为零或者小于1.5 km,接收函数不能分辨;“无”表示该台站的数据质量较差,未得到计算结果,下同
Figure 8. Distribution of the sedimentary depth beneath the stations in the studied area
The white dot indicates the station beneath which the thickness of the sedimentary layer is zero or less than 1.5 km,which are not resolved by the receiver function. “None” indicates that the data quality of the station is poor and the calculation result is not obtained,the same below
![]()
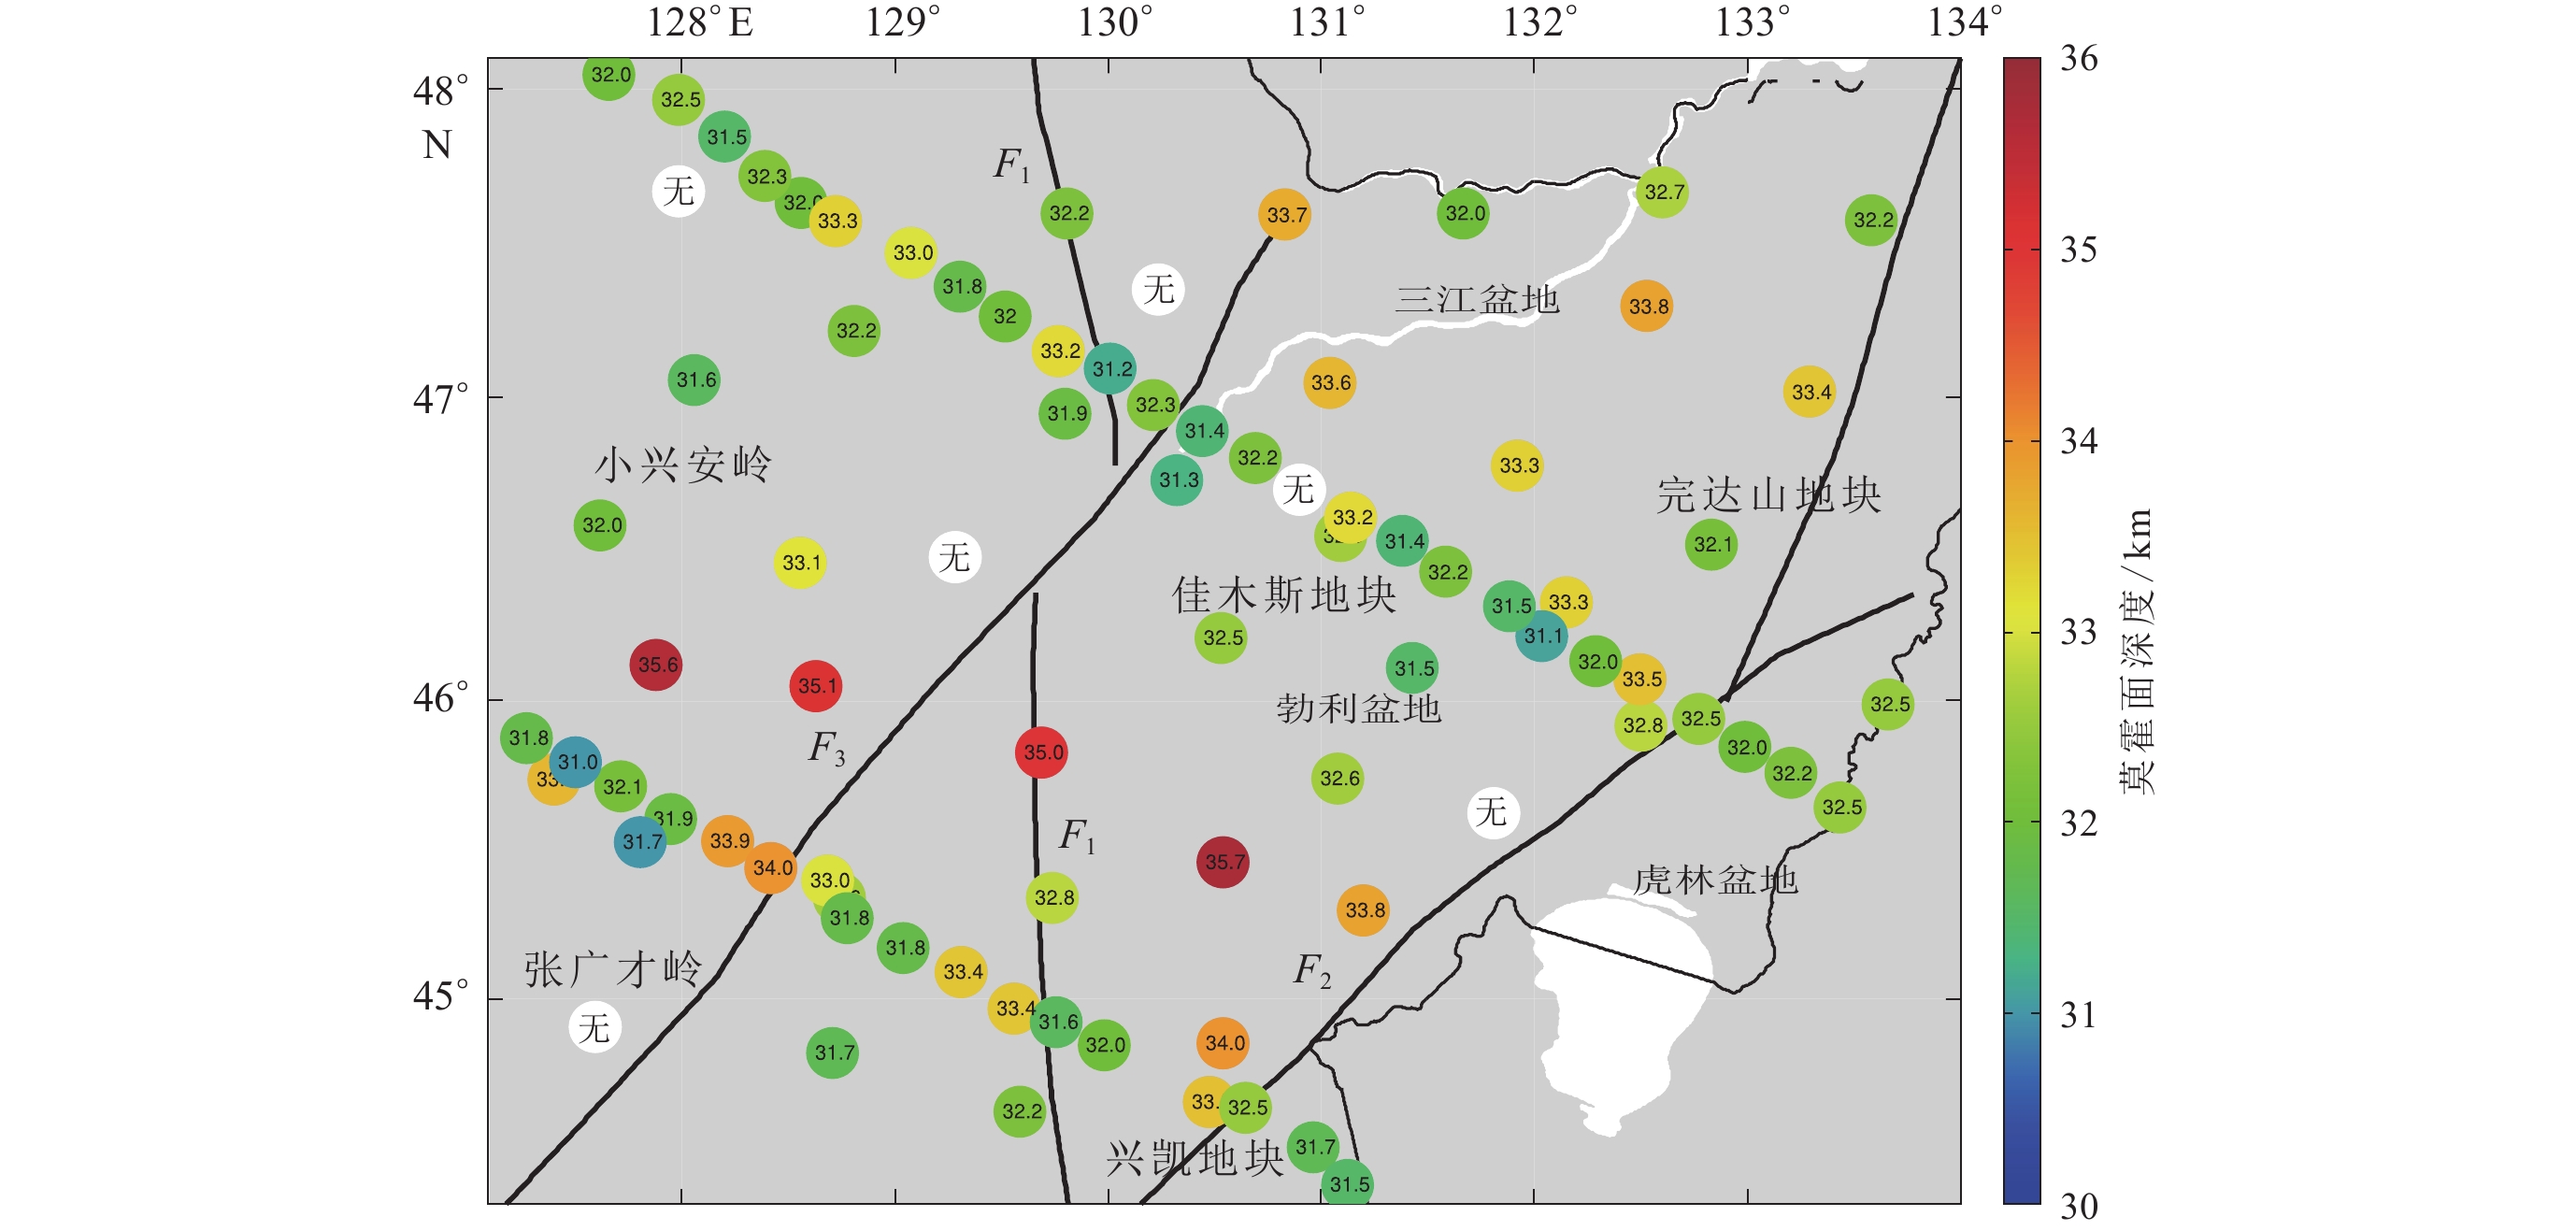
图 9 研究区地震台站下方莫霍面深度图
Figure 9. Moho depth distribution beneath the stations in the studied area
-
高东辉,陈永顺,孟宪森,张永刚,唐有彩. 2011. 黑龙江地区背景噪声面波群速度层析成像[J]. 地球物理学报,54(4):1043–1051. doi: 10.3969/j.issn.0001-5733.2011.04.019 Gao D H,Chen Y J,Meng X S,Zhang Y G,Tang Y C. 2011. Crustal and uppermost mantle structure of the Heilongjiang region from ambient noise tomography[J]. Chinese Journal of Geophysics,54(4):1043–1051 (in Chinese).
葛肖虹,刘俊来,任收麦,袁四化. 2014. 中国东部中—新生代大陆构造的形成与演化[J]. 中国地质,41(1):19–38. doi: 10.3969/j.issn.1000-3657.2014.01.002 Ge X H,Liu J L,Ren S M,Yuan S H. 2014. The formation and evolution of Mesozoic-Cenozoic continental tectonic in eastern China[J]. Geology in China,41(1):19–38 (in Chinese).
和钟铧,刘招君,张晓冬,陈永成,董林森. 2009. 黑龙江东部晚中生代盆地群构造层划分及构造沉积演化[J]. 世界地质,28(1):20–27. doi: 10.3969/j.issn.1004-5589.2009.01.003 He Z H,Liu Z J,Zhang X D,Chen Y C,Dong L S. 2009. Subdivisions of structural layers and tectonic-sedimentary evolution of eastern basin in Heilongjiang in Late Mesozoic[J]. Global Geology,28(1):20–27 (in Chinese).
贾承造,郑民. 2010. 东北白垩纪大三江盆地沉积构造演化及其残留盆地群的油气勘探意义[J]. 大庆石油学院学报,34(6):1–12. Jia C Z,Zheng M. 2010. Sedimentary history,tectonic evolution of Cretaceous Dasanjiang basin in Northeast China and the significance of oil and gas exploration of its residual basin[J]. Journal of Daqing Petroleum Institute,34(6):1–12 (in Chinese).
李天觉,陈棋福. 2019. 利用接收函数方法研究中国东北东南部地区不同构造体的地壳特征[J]. 地球物理学报,62(8):2899–2917. doi: 10.6038/cjg2019M0379 Li T J,Chen Q F. 2019. Crustal structure of different tectonic units in southeastern part of Northeast China using receiver functions[J]. Chinese Journal of Geophysics,62(8):2899–2917 (in Chinese).
刘国兴,张兴洲,杨宝俊,翁爱华,唐君辉,李雪森. 2006. 佳木斯地块及东缘岩石圈电性结构特征[J]. 地球物理学报,49(2):598–603. doi: 10.3321/j.issn:0001-5733.2006.02.037 Liu G X,Zhang X Z,Yang B J,Weng A H,Tang J H,Li X S. 2006. Electrical structures of the lithosphere along the Jiamusi massif and its eastern edge[J]. Chinese Journal of Geophysics,49(2):598–603 (in Chinese).
卢造勋,夏怀宽. 1993. 内蒙古东乌珠穆沁旗至辽宁东沟地学断面[J]. 地球物理学报,36(6):765–772. doi: 10.3321/j.issn:0001-5733.1993.06.008 Lu Z X,Xia H K. 1993. Geoscience transect from Dong Ujimqinqi of Inner Mongolia to Donggou of Liaoning,China[J]. Acta Geophysica Sinica,36(6):765–772 (in Chinese).
孙斌. 2013. 东北盆地群重磁特征与深部结构研究[D]. 南京: 南京大学: 52–60. Sun B. 2013. A Study of Gravity-Magnetic Features and Deep Tectonics of the NE China Basin Groups[D]. Nanjing: Nanjing University: 52–60 (in Chinese).
王枫. 2010. 黑龙江省东部张广才岭群新兴组: 岩石组合、时代及其构造意义[D]. 长春: 吉林大学: 3–5. Wang F. 2010. The Xinxing Formation From Zhangguangcai Range Group in Eastern Heilongjiang Province: Rock Association, Geochronology and Tectonic Implications[D]. Changchun: Jilin University: 3–5 (in Chinese).
危自根,陈凌. 2012. 东北地区至华北北缘地壳结构的区域差异:地壳厚度与波速比的联合约束[J]. 地球物理学报,55(11):3601–3614. doi: 10.6038/j.issn.0001-5733.2012.11.009 Wei Z G,Chen L. 2012. Regional differences in crustal structure beneath northeastern China and northern North China Craton:Constrains from crustal thickness and vP/vS ratio[J]. Chinese Journal of Geophysics,55(11):3601–3614 (in Chinese).
危自根,储日升,陈凌,崇加军,李志伟. 2016. 复杂地壳接收函数H-κ叠加:以安纳托利亚板块为例[J]. 地球物理学报,59(11):4048–4062. doi: 10.6038/cjg20161110 Wei Z G, Chu R S, Chen L, Chong J J, Li Z W. 2016. Analysis of H-κ and vP/vS receiver function beneath crust with complex structure: Taking the Anatolia Plate as an example[J]. Chinese Journal of Geophysics, 59(11): 4048–4062 (in Chinese).
许卫卫,郑天愉. 2005. 渤海湾盆地北西盆山边界地区泊松比分布[J]. 地球物理学报,48(5):1077–1084. doi: 10.3321/j.issn:0001-5733.2005.05.014 Xu W W,Zheng T Y. 2005. Distribution of Poisson’s ratios in the northwestern basin-mountain boundary of the Bohai Bay basin[J]. Chinese Journal of Geophysics,48(5):1077–1084 (in Chinese).
许英才,王琼,曾宪伟,马禾青,许文俊,金涛. 2018. 鄂尔多斯地块西缘莫霍面起伏及泊松比分布[J]. 地震学报,40(5):563–581. Xu Y C,Wang Q,Zeng X W,Ma H Q,Xu W J,Jin T. 2018. Moho depth and Poisson’s ratio distribution in the western edge of Ordos block[J]. Acta Seismologica Sinica,40(5):563–581 (in Chinese).
杨宝俊,穆石敏,金旭,刘财. 1996. 中国满洲里—绥芬河地学断面地球物理综合研究[J]. 地球物理学报,39(6):772–782. doi: 10.3321/j.issn:0001-5733.1996.06.007 Yang B J,Mu S M,Jin X,Liu C. 1996. Synthesized study on the geophysics of Manzhouli-Suifenhe geoscience transect,China[J]. Acta Geophysica Sinica,39(6):772–782 (in Chinese).
姚华建,徐果明,肖翔,朱良保. 2004. 基于图像分析的双台面波相速度频散曲线快速提取方法[J]. 地震地磁观测与研究,25(1):1–8. doi: 10.3969/j.issn.1003-3246.2004.01.001 Yao H J,Xu G M,Xiao X,Zhu L B. 2004. A quick tracing method based on image analysis technique for the determination of dual stations phase velocities dispersion curve of surface wave[J]. Seismological and Geomagnetic Observation and Research,25(1):1–8 (in Chinese).
曾正彬. 2012. 分析三江盆地石油地质条件与勘探前景[J]. 中国石油和化工标准与质量,33(9):140. doi: 10.3969/j.issn.1673-4076.2012.10.115 Zeng Z B. 2012. Analysis of petroleum geological conditions and exploration prospects in Sanjiang basin[J]. China Petroleum and Chemical Standard and Quality,33(9):140 (in Chinese).
张风雪,吴庆举,李永华. 2014. 中国东北地区远震S波走时层析成像研究[J]. 地球物理学报,57(1):88–101. Zhang F X,Wu Q J,Li Y H. 2014. A traveltime tomography study by teleseismic S wave data in the Northeast China area[J]. Chinese Journal of Geophysics,57(1):88–101 (in Chinese).
张广成,吴庆举,潘佳铁,张风雪,余大新. 2013a. 利用H-κ叠加方法和CCP叠加方法研究中国东北地区地壳结构与泊松比[J]. 地球物理学报,56(12):4084–4094. doi: 10.6038/cjg20131213 Zhang G C,Wu Q J,Pan J T,Zhang F X,Yu D X. 2013a. Study of crustal structure and Poisson ratio of NE China by H-κ stack and CCP stack methods[J]. Chinese Journal of Geophysics,56(12):4084–4094 (in Chinese).
张广成,吴庆举,李永华,潘佳铁,张风雪,管见. 2013b. 利用莫霍面Ps震相研究中国东北地区地壳各向异性[J]. 地震学报,35(4):485–497. doi: 10.3969/j.issn.0253-3782.2013.04.004 Zhang G C,Wu Q J,Li Y H,Pan J T,Zhang F X,Guan J. 2013b. An investigation on crustal anisotropy of Northeast China using Moho Ps converted phase[J]. Acta Seismologica Sinica,35(4):485–497 (in Chinese).
章倩倩. 2012. 三江盆地演化与沉积充填特征[D]. 荆州: 长江大学: 5–20. Zhang Q Q. 2012. The Structural Characteristics and Depositional Filling in the Sanjiang Basin[D]. Jingzhou: Yangtze University: 5–20 (in Chinese).
张云鹏,任建业,王珊,赵学钦. 2016. 东北大三江盆地群早白垩世存在统一湖盆的沉积学证据[J]. 中国地质,43(4):1280–1290. Zhang Y P,Ren J Y,Wang S,Zhao X Q. 2016. The sedimentary evidence for the existence of unified basin in Early Cretaceous in Dasanjiang basin group,Northeast China[J]. Geology in China,43(4):1280–1290 (in Chinese).
张兴洲,郭冶,曾振,付秋林,蒲建彬. 2015. 东北地区中—新生代盆地群形成演化的动力学背景[J]. 地学前缘,22(3):88–98. Zhang X Z,Guo Y,Zeng Z,Fu Q L,Pu J B. 2015. Dynamic evolution of the Mesozoic-Cenozoic basins in the northeastern China[J]. Earth Science Frontiers,22(3):88–98 (in Chinese).
张毅. 2019. 应用接收函数方法研究中国东部壳幔间断面结构[D]. 北京: 中国地质大学(北京): 18–28. Zhang Y. 2019. Study of the Crust-Mantle Discontinuity Structure in Eastern China With Receiver Function Method[D]. Beijing: China University of Geosciences (Beijing): 18–28 (in Chinese).
郑秀芬,欧阳飚,张东宁,姚志祥,梁建宏,郑洁. 2009. “国家数字测震台网数据备份中心”技术系统建设及其对汶川大地震研究的数据支撑[J]. 地球物理学报,52(5):1412–1417. doi: 10.3969/j.issn.0001-5733.2009.05.031 Zheng X F,Ouyang B,Zhang D N,Yao Z X,Liang J H,Zheng J. 2009. Technical system construction of Data Backup Centre for China Seismograph Network and the data support to researches on the Wenchuan earthquake[J]. Chinese Journal of Geophysics,52(5):1412–1417 (in Chinese).
周建波,张兴洲,马志红,刘立,金魏,张梅生,王成文,迟效果. 2009. 中国东北地区的构造格局与盆地演化[J]. 石油与天然气地质,30(5):530–538. doi: 10.3321/j.issn:0253-9985.2009.05.002 Zhou J B,Zhang X Z,Ma Z H,Liu L,Jin W,Zhang M S,Wang C W,Chi X G. 2009. Tectonic framework and basin evolution in Northeast China[J]. Oil &Gas Geology,30(5):530–538 (in Chinese).
周荔青. 2005. 深大断裂与中国东部新生代盆地油气资源分布[D]. 西安: 西北大学: 5–9. Zhou L Q. 2005. Oil And Gas Distribution in Deep Fault Rupture And Cenozoic Basin in Eastern Part of China[D]. Xi’an: Northwest University: 5–9 (in Chinese).
朱洪翔,田有,刘财,冯晅,杨宝俊,刘才华,刘廷,马锦程. 2017. 中国东北地区高分辨率地壳结构:远震接收函数[J]. 地球物理学报,60(5):1676–1689. doi: 10.6038/cjg20170506 Zhu H X,Tian Y,Liu C,Feng X,Yang B J,Liu C H,Liu T,Ma J C. 2017. High-resolution crustal structure of Northeast China revealed by teleseismic receiver functions[J]. Chinese Journal of Geophysics,60(5):1676–1689 (in Chinese).
朱洪翔. 2020. 接收函数与噪声频散联合反演东北典型构造区S波速度结构[D]. 吉林: 吉林大学: 16–40. Zhu H X. 2020. Shear Wave Structure of Typical Regions in NE China From Joint Inversion of Receiver Function and Ambient Noise Dispersion[D]. Jilin: Jilin University: 16–40 (in Chinese).
Barmin M P,Ritzwoller M H,Levshin A L. 2001. A fast and reliable method for surface wave tomography[J]. Pure Appl Geophys,158(8):1351–1375. doi: 10.1007/PL00001225
Bensen G D,Ritzwoller M H,Barmin M P,Levshin A L,Lin F,Moschetti M P,Shapiro N M,Yang Y. 2007. Processing seismic ambient noise data to obtain reliable broad-band surface wave dispersion measurements[J]. Geophys J Int,169(3):1239–1260. doi: 10.1111/j.1365-246X.2007.03374.x
Chen L,Wen L X,Zheng T Y. 2005. A wave equation migration method for receiver function imaging:1. Theory[J]. J Geophys Res,110(B11):B11309. doi: 10.1029/2005JB0003665
Guo Z,Chen Y J,Ning J Y,Feng Y G,Grand S P,Niu F L,Kawakatsu H,Tanaka S,Obayashi M,Ni J. 2015. High resolution 3-D crustal structure beneath NE China from joint inversion of ambient noise and receiver functions using NECESSArray data[J]. Earth Planet Sci Lett,416:1–11. doi: 10.1016/j.jpgl.2015.01.044
Herrmann R B, Ammon C J. 2004. Surface waves, receiver functions and crustal structure, computer programs in seismology, version 3.30[CP/OL]. [2021-09-20]. http://www.eas.slu.edu/People/RBHerrmann/CPS330.html.
He R Z,Shang X F,Yu C Q,Zhang H J,van der Hilst R D. 2014. A unified map of Moho depth and vP/vS ratio of continental China by receiver function analysis[J]. Geophys J Int,199:1910–1918. doi: 10.1093/gji/ggu365
Huang J L,Zhao D P. 2006. High-resolution mantle tomography of China and surrounding regions[J]. J Geophys Res,111(B9):B09305. doi: 10.1029/2005JB004066
Kang D,Shen W S,Ning J Y,Ritzwoller M H. 2016. Seismic evidence for lithospheric modification associated with intracontinental volcanism in northeastern China[J]. Geophys J Int,204(1):215–235. doi: 10.1093/gji/ggv441
Ligorría J P,Ammon C J. 1999. Iterative deconvolution and receiver-function estimation[J]. Bull Seismol Soc Am,89(5):1395–1400. doi: 10.1785/BSSA0890051395
Schimmel M,Stutzmann E,Gallart J. 2011. Using instantaneous phase coherence for signal extraction from ambient noise data at a local to a global scale[J]. Geophys J Int,184(1):494–506. doi: 10.1111/j.1365-246X.2010.04861.x
Stockwell R G,Mansinha L,Lowe R P. 1996. Localization of the complex spectrum:The S transform[J]. IEEE Trans Signal Process,44(4):998–1001. doi: 10.1109/78.492555
Tang Y C,Obayashi M,Niu F L,Grand S P,Chen Y J,Kawakatsu H,Tanaka S,Ning J Y,Ni J F. 2014. Changbaishan volcanism in Northeast China linked to subduction-induced mantle upwelling[J]. Nat Geosci,7(6):470–475. doi: 10.1038/ngeo2166
Tao K,Niu F L,Ning J Y,Chen Y J,Steve G,Kawakatsu H,Tanaka S,Obayashi M,Ni J. 2014. Crustal structure beneath NE China imaged by NECESSArray receiver function data[J]. Earth Planet Sci Lett,398:48–57. doi: 10.1016/j.jpgl.2014.04.043
Zhang Y,Huang J L. 2019. Structure of the sediment and crust in the Northeast North China Craton from improved sequential H-κ stacking method[J]. Open Geosci,11:682–696.
Zheng Y,Shen W S,Zhou L Q,Yang Y J,Xie Z J,Ritzwoller M H. 2011. Crust and uppermost mantle beneath the North China Craton,northeastern China,and the Sea of Japan from ambient noise tomography[J]. J Geophys Res,116(B12):B12312. doi: 10.1029/2011JB008637
Zhu L P,Kanamori H. 2000. Moho depth variation in southern California from teleseismic receiver functions[J]. J Geophys Res,105(B2):2969–2980.
-
期刊类型引用(3)
1. 王东升,陈笑宇,张锐,国巍. 基于希尔伯特-黄变换的近断层地震动脉冲特性研究. 地震学报. 2022(05): 824-844 .  本站查看
本站查看
2. 马完君,卢建旗,唐丽华,谢志南. 基于等效群速度的非平稳地震动拟合方法研究. 地震研究. 2019(04): 523-530+650 . 百度学术
3. 曲国岩,俞瑞芳. 基于时-频包线的非平稳地震动合成及其对结构非线性响应的影响. 振动工程学报. 2018(02): 198-208 . 百度学术
其他类型引用(6)

 下载:
下载:


计量
- 文章访问数: 403
- HTML全文浏览量: 152
- PDF下载量: 78
- 被引次数: 9
