
 Download:
The negentropy anomaly accumulation curveat Guzan station before the Lushan earthquake
Figures of the Article
-
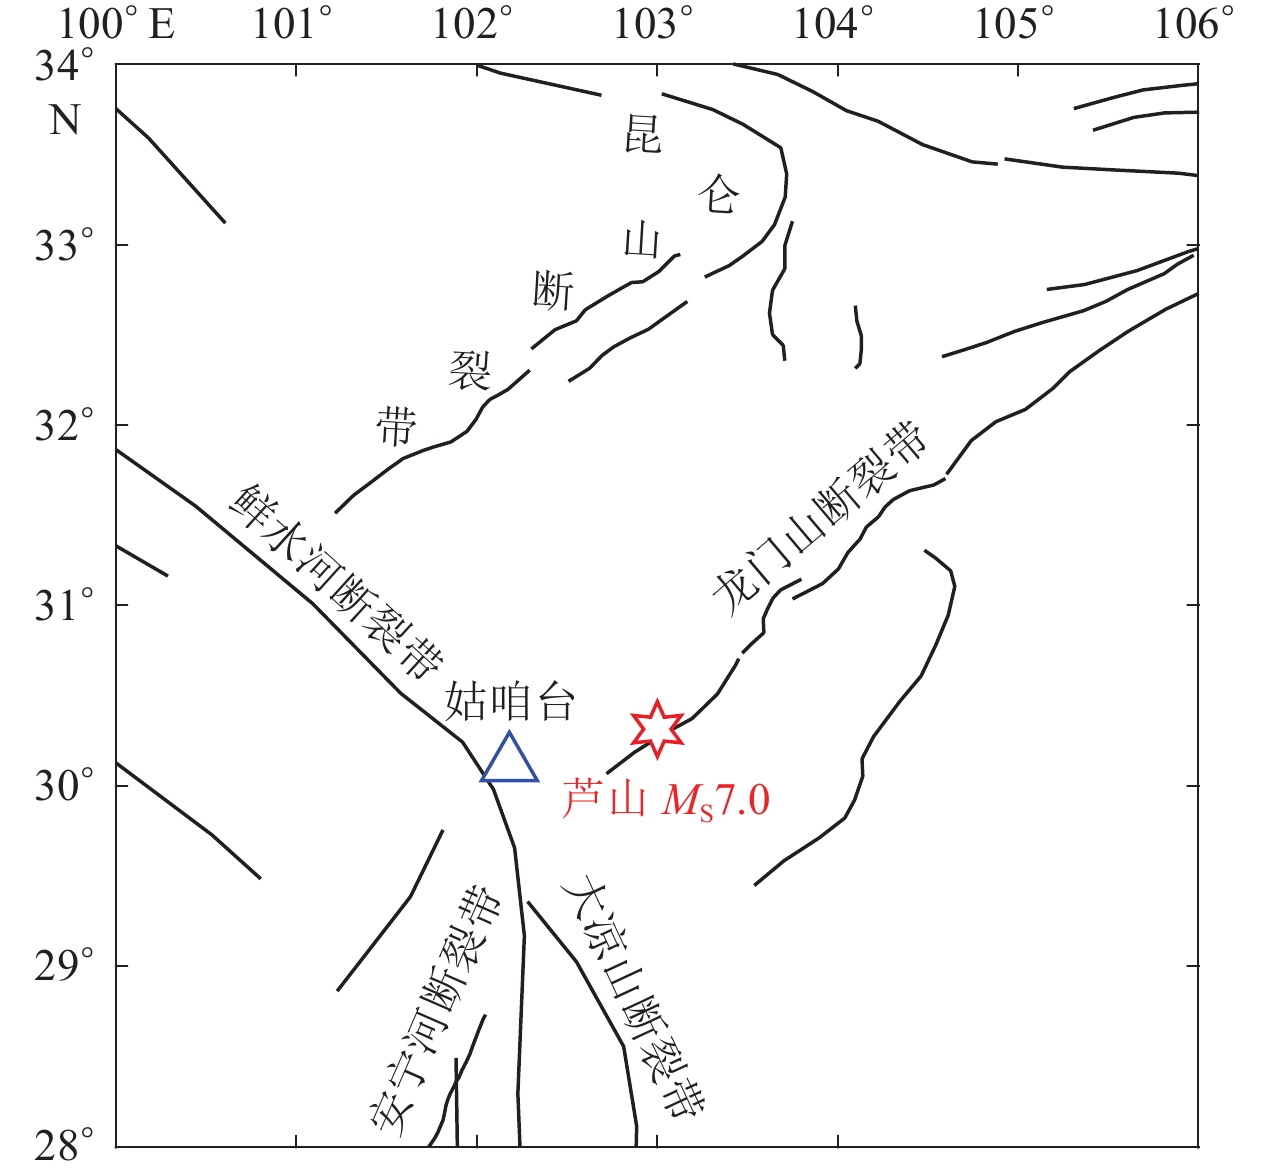
![]() The location of Guzan station and Lushan earthquake
The location of Guzan station and Lushan earthquake
-
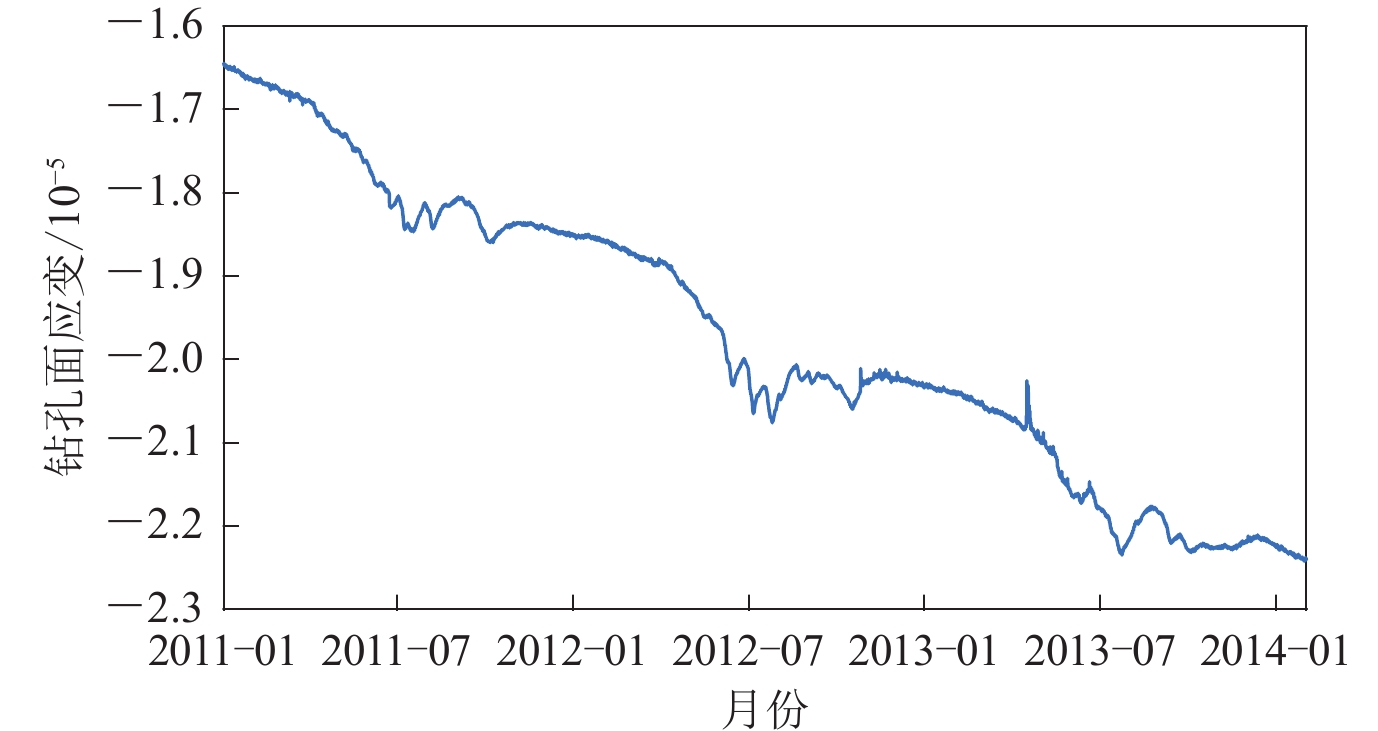
![]() Borehole strain data Sa of Guzan station (from January 2011 to January 2014)
Borehole strain data Sa of Guzan station (from January 2011 to January 2014)
-
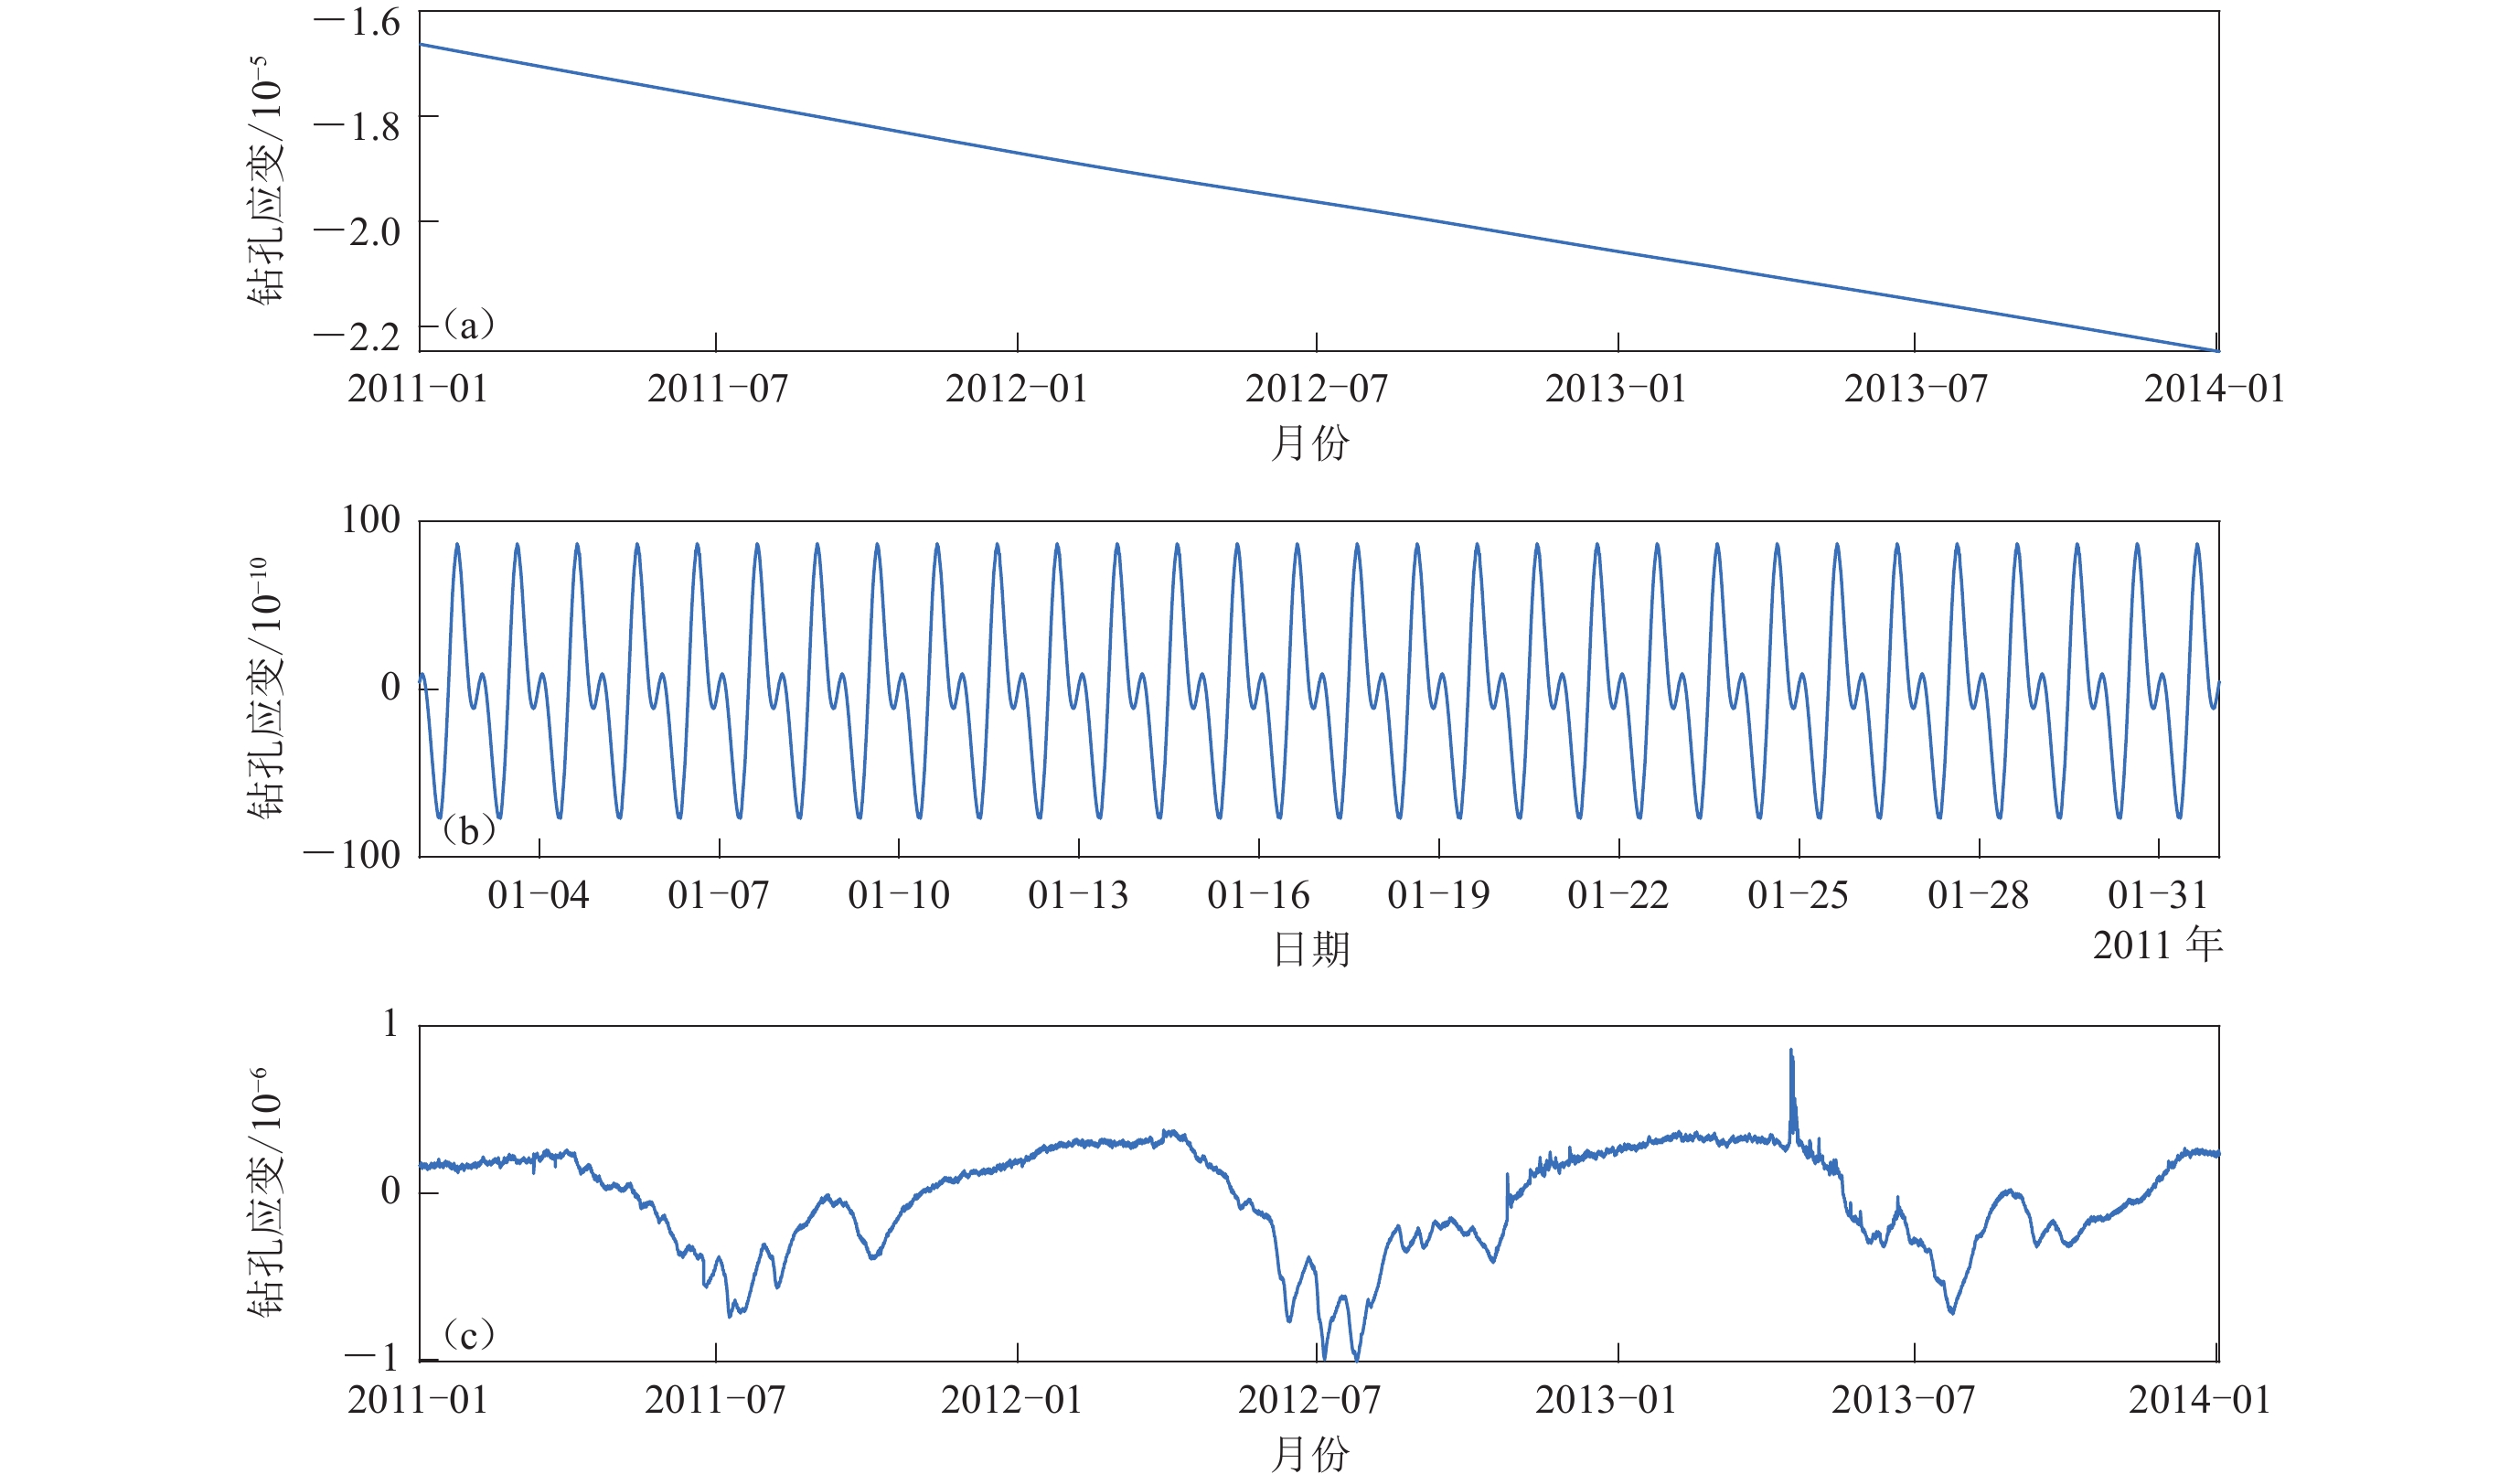
![]() Time series decomposition results of borehole strain data
Time series decomposition results of borehole strain data
-
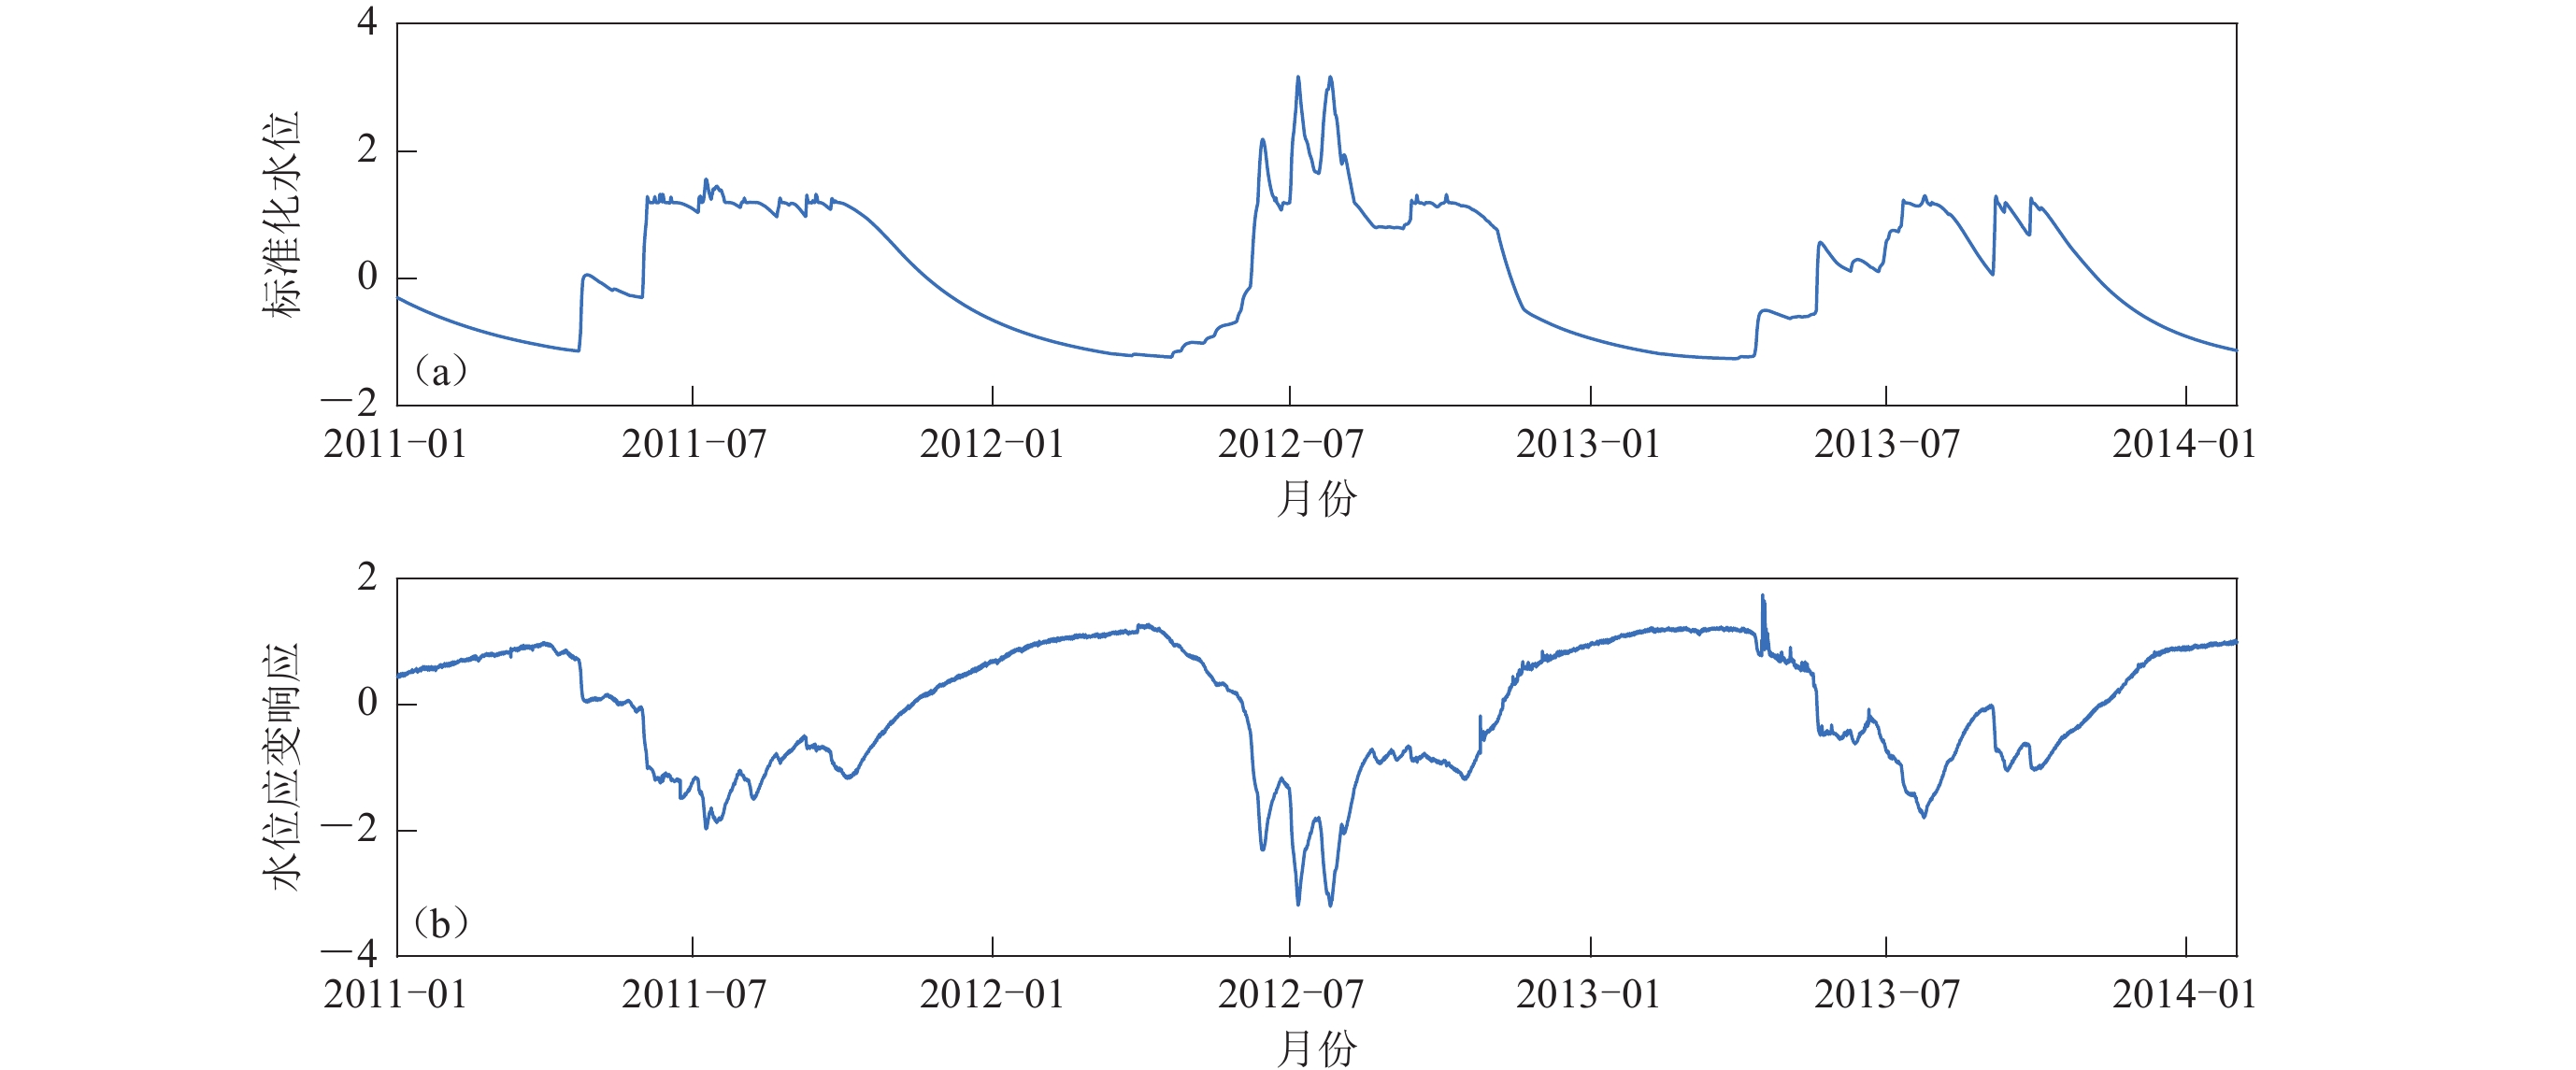
![]() Water level data (a) and its strain response (b) of Guzan station
Water level data (a) and its strain response (b) of Guzan station
-
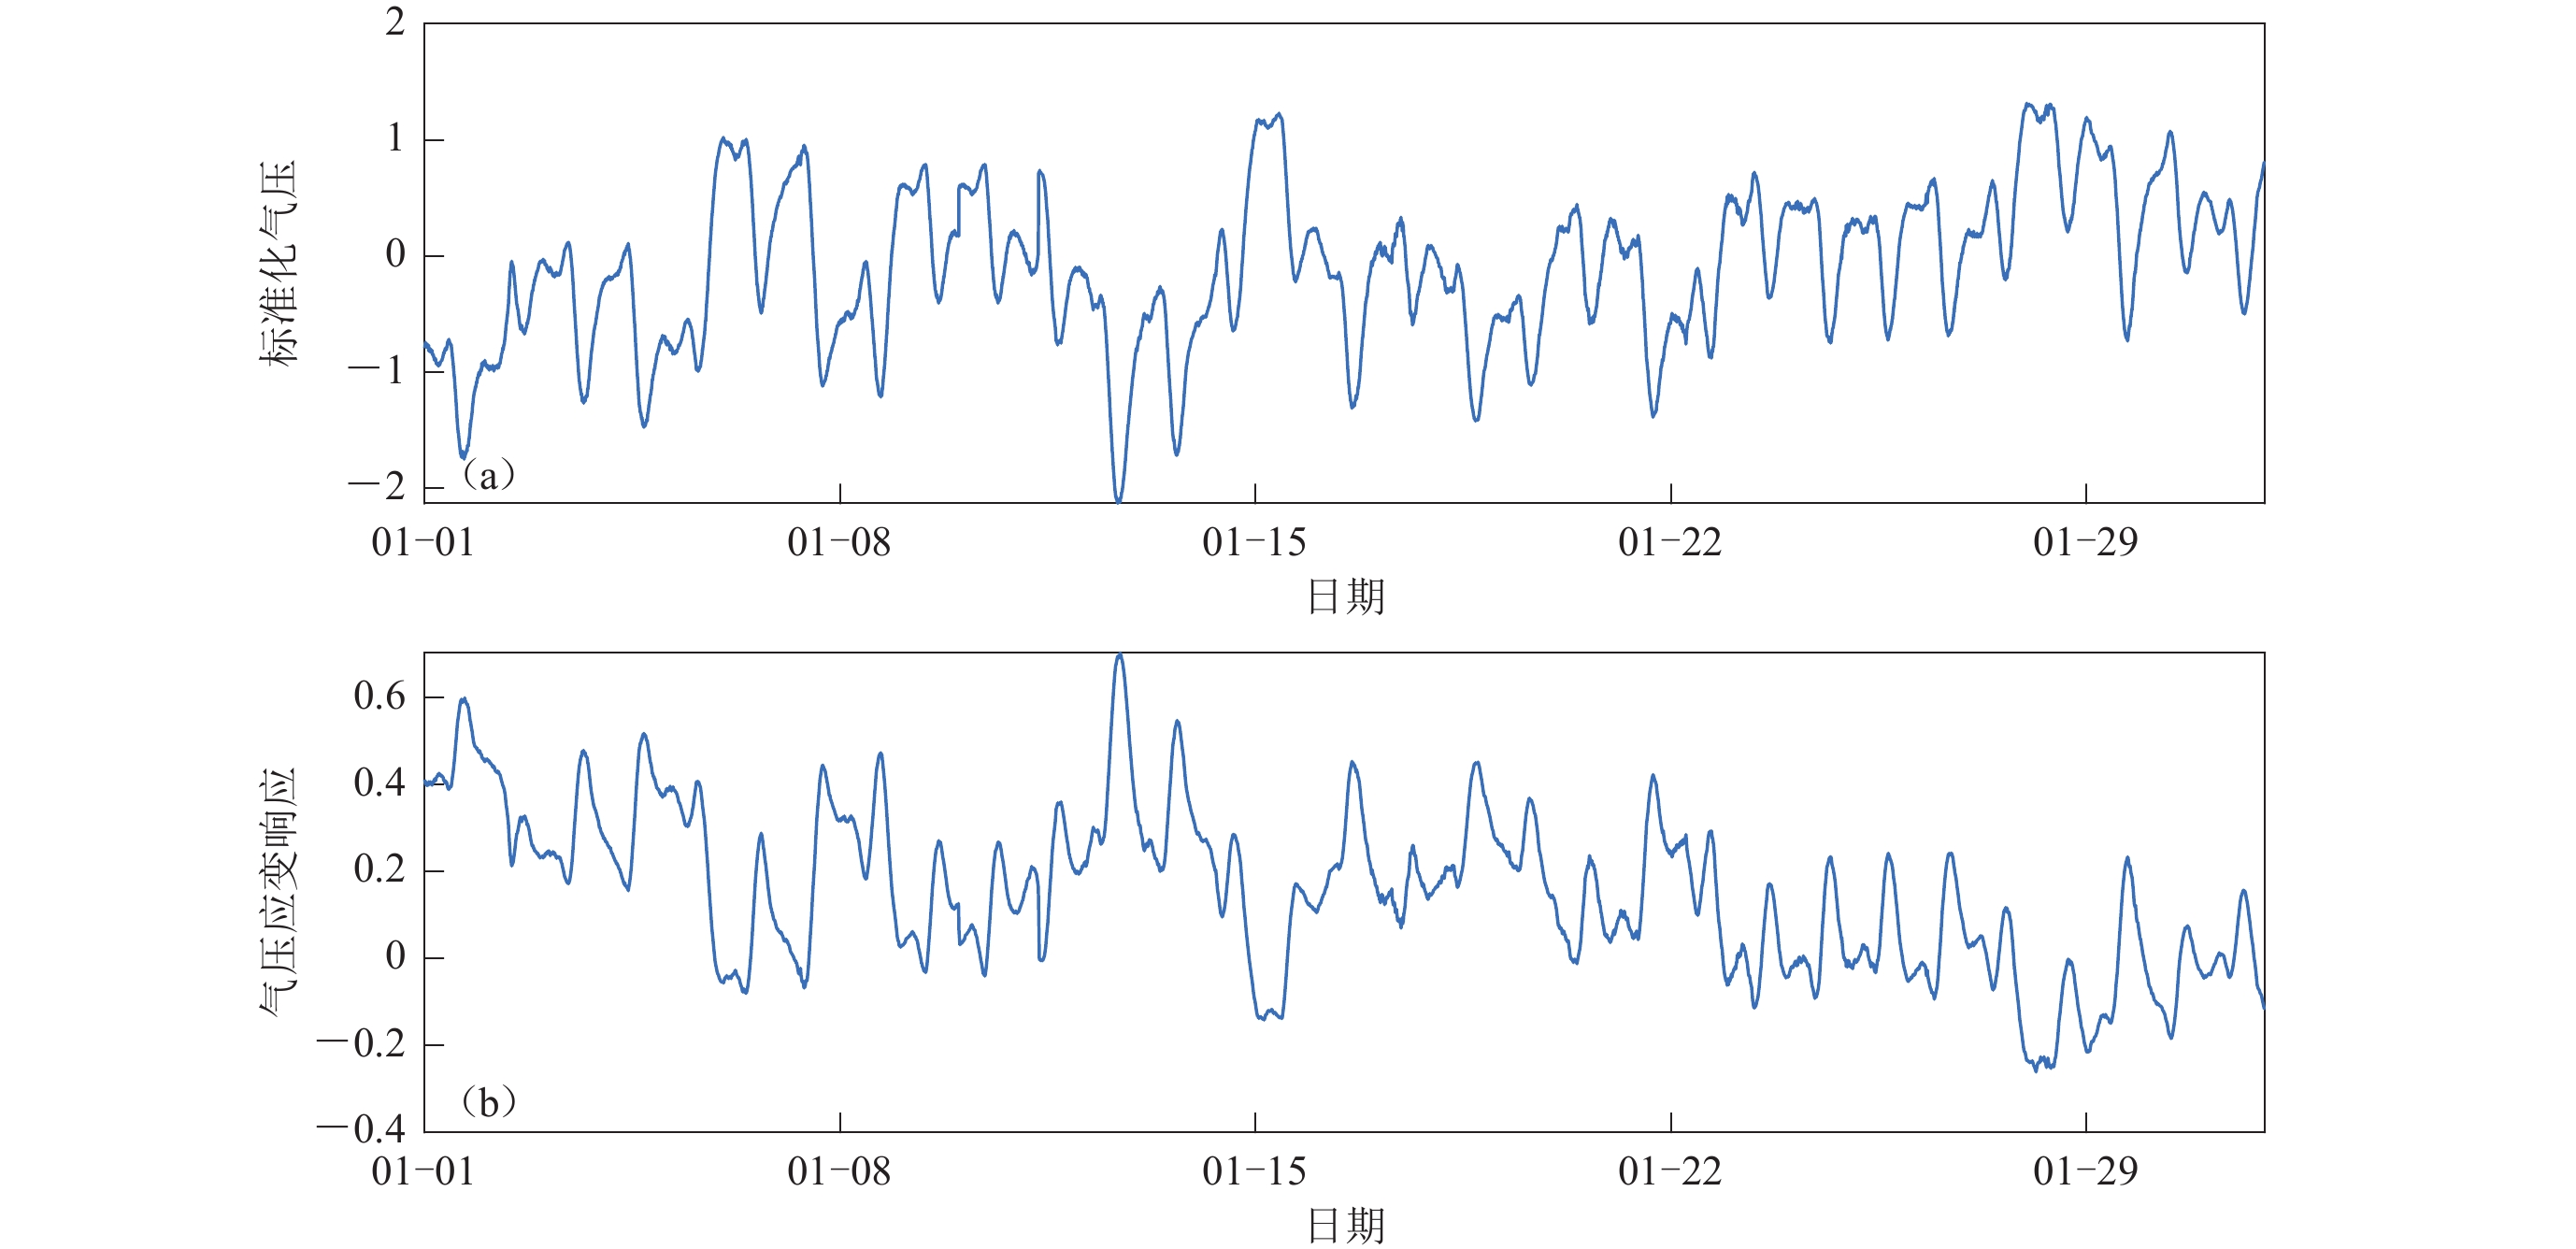
![]() Air pressure data (a) and its strain response (b) of Guzan station in January 2011
Air pressure data (a) and its strain response (b) of Guzan station in January 2011
-
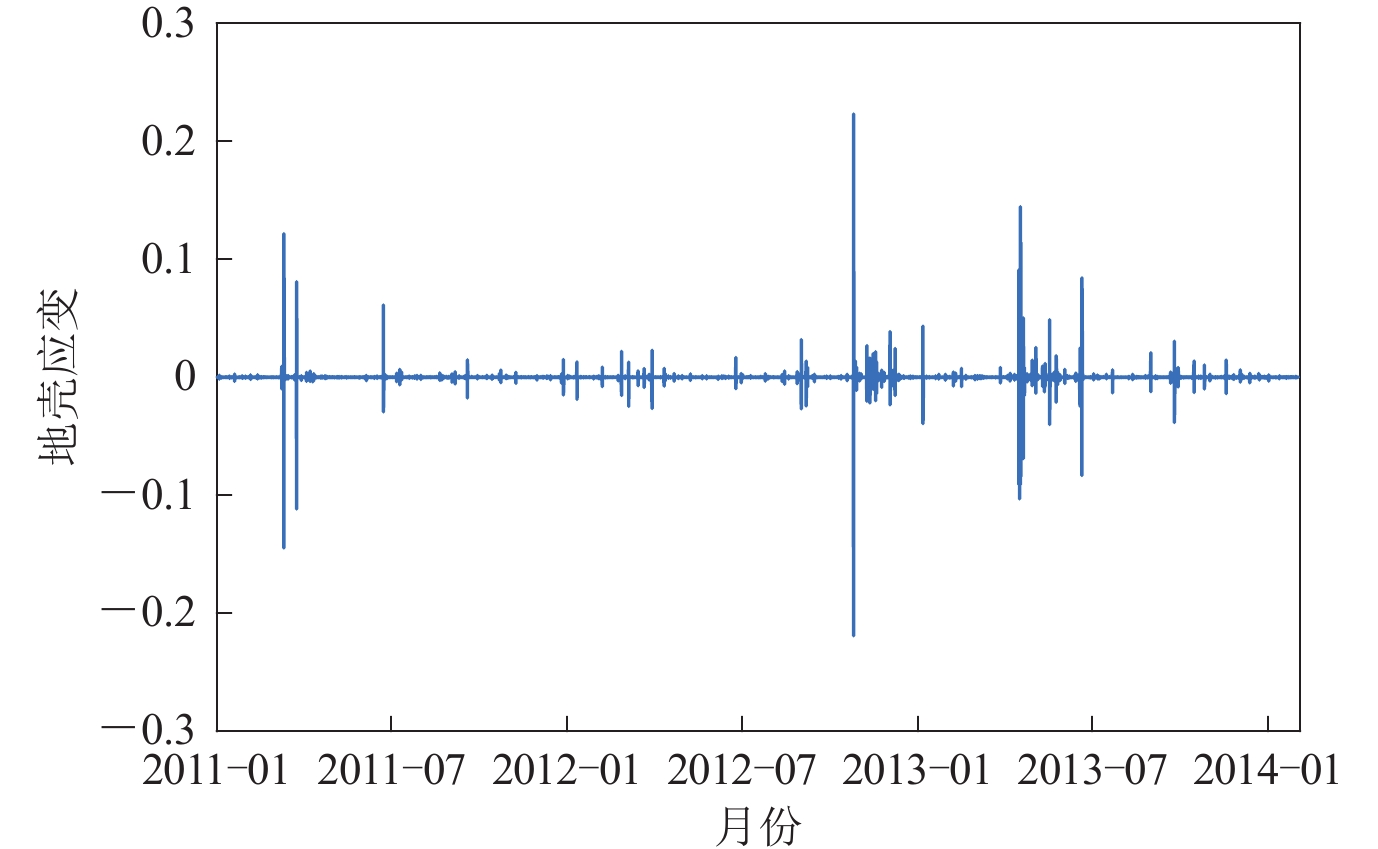
![]() Crustal strain data at Guzan station
Crustal strain data at Guzan station
-
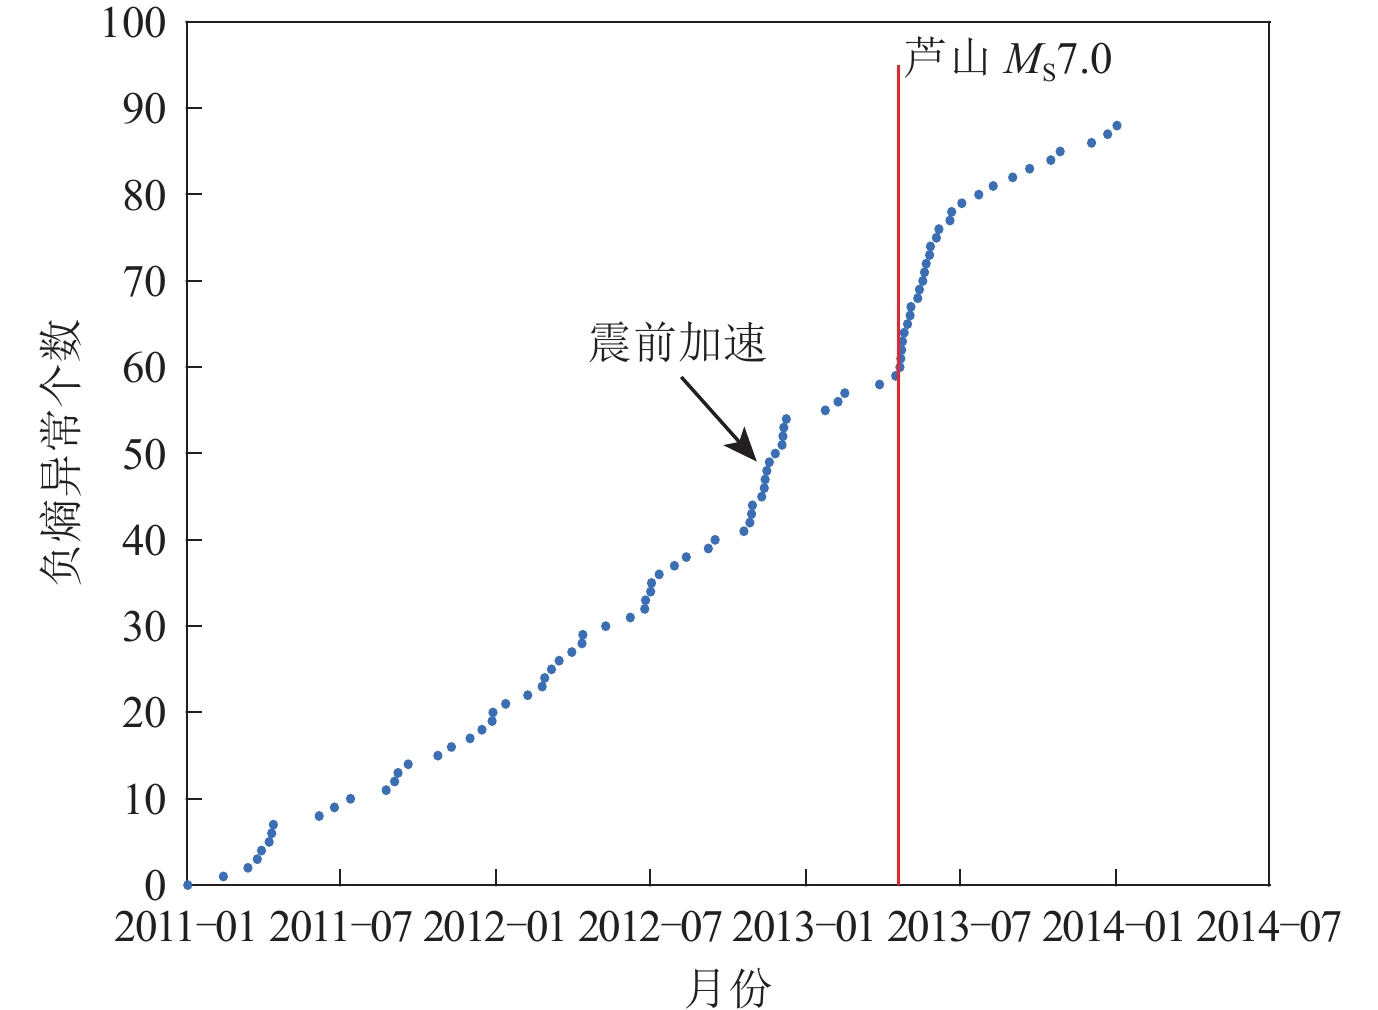
![]() The negentropy anomaly accumulation curveat Guzan station before the Lushan earthquake
The negentropy anomaly accumulation curveat Guzan station before the Lushan earthquake
-
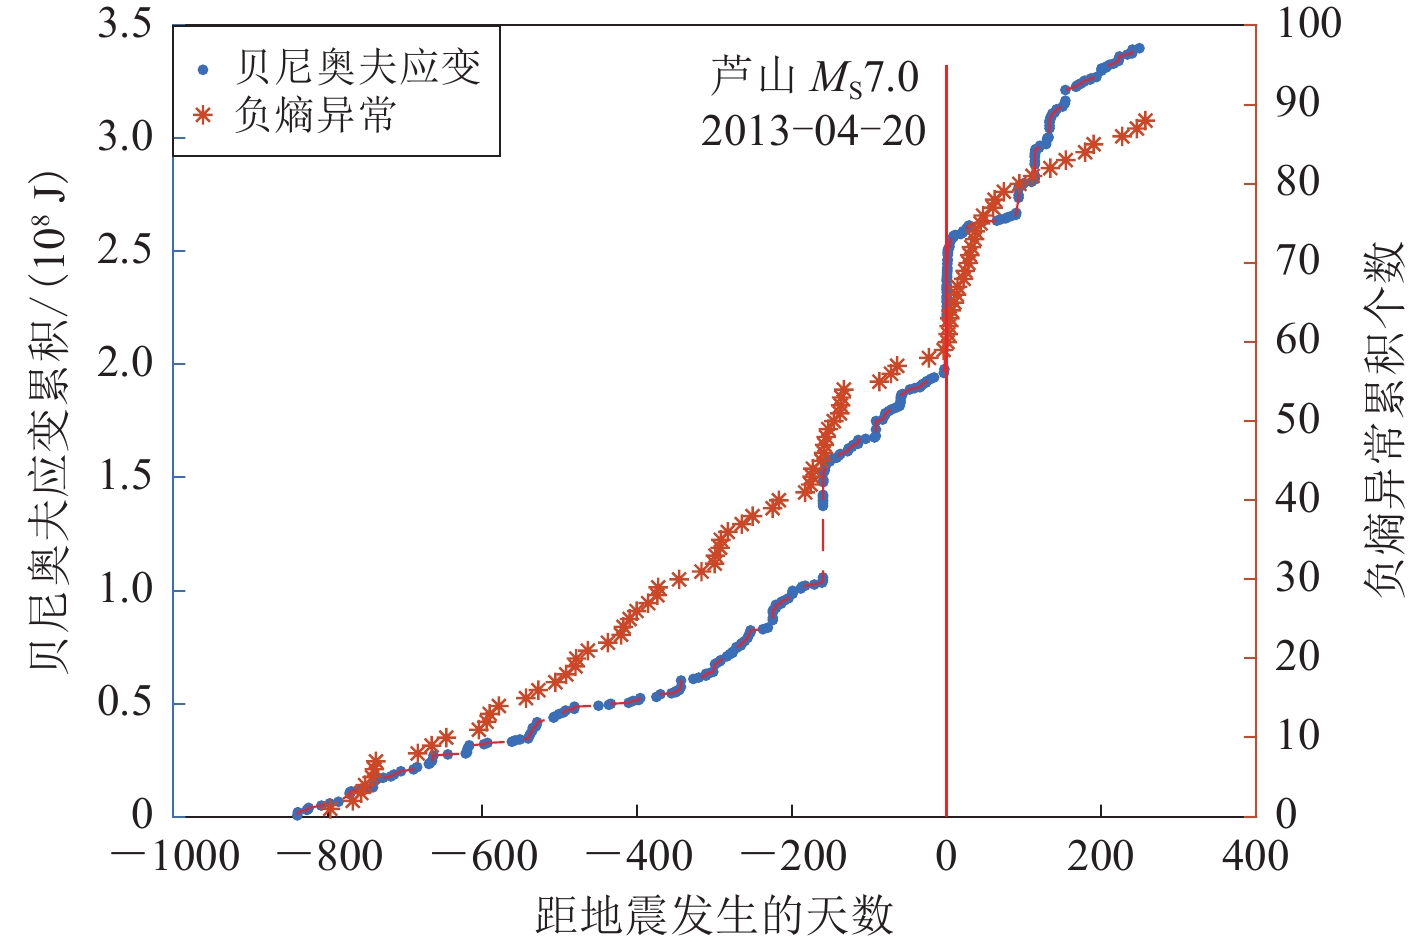
![]() Comparison of negentropy anomaly accumulation and Benioff strain accumulation
Comparison of negentropy anomaly accumulation and Benioff strain accumulation
-
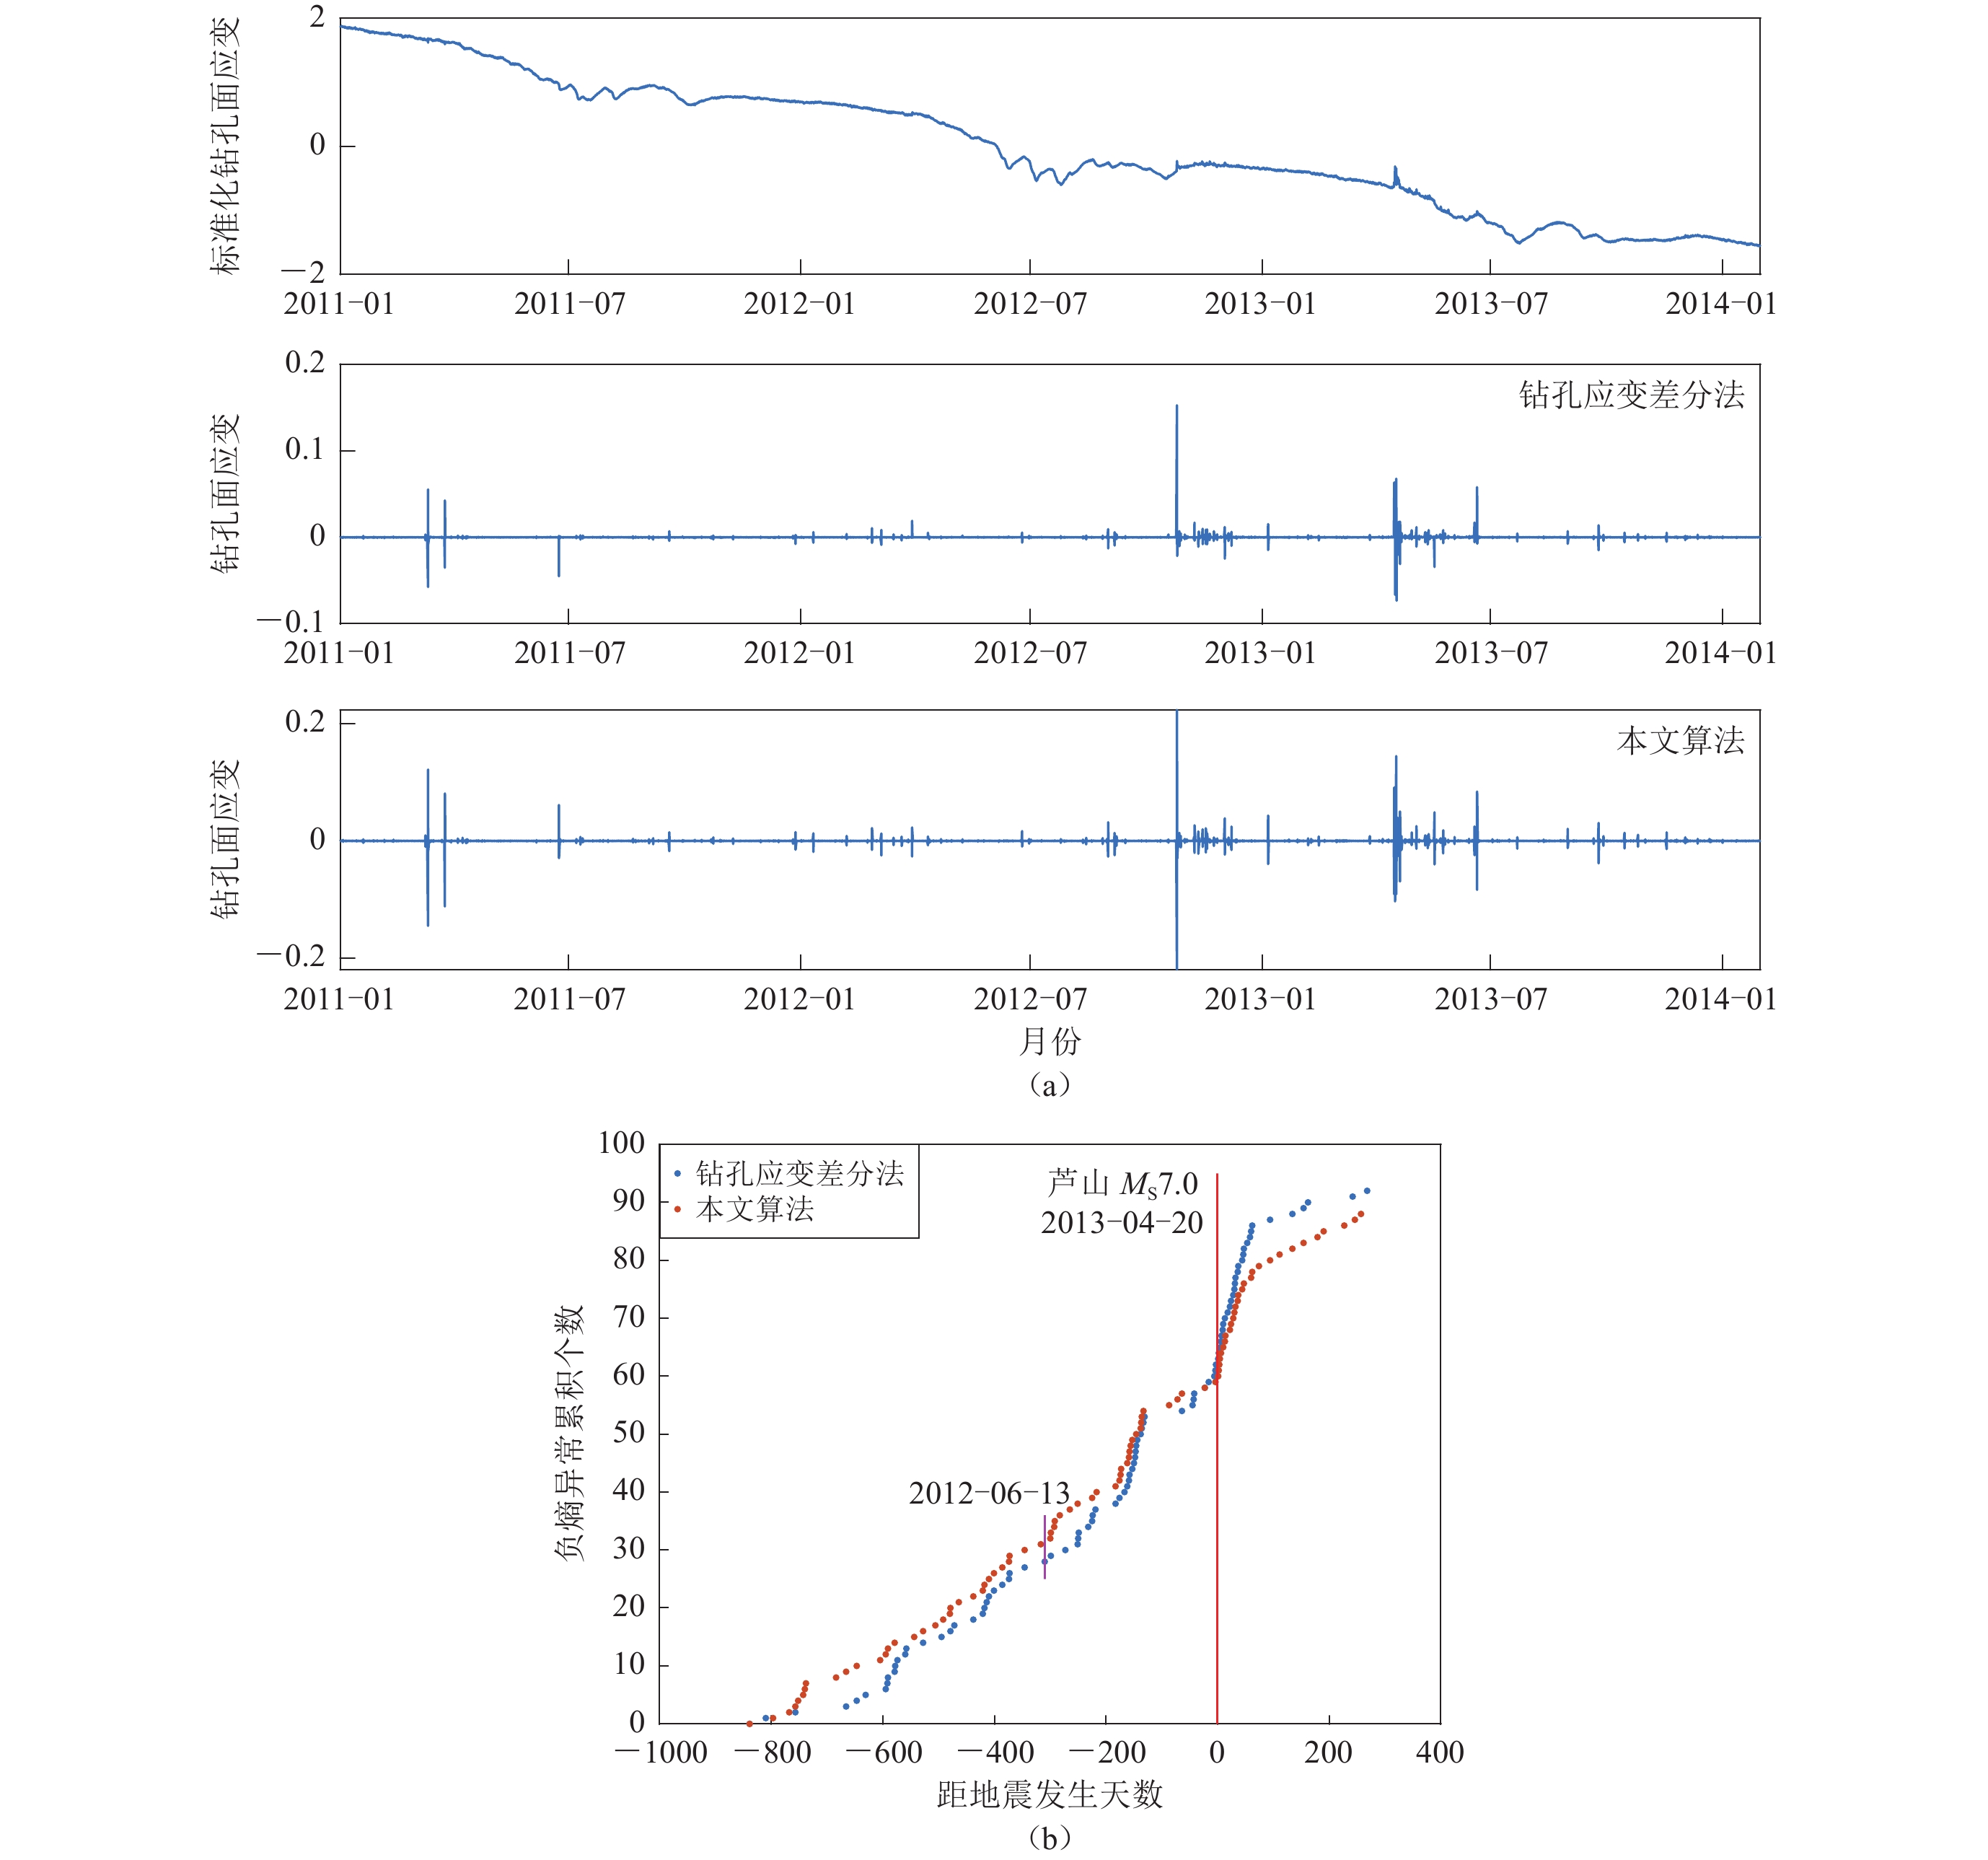
![]() The strain observation data at Guzan station and time domain curves of two algorithms (a) and comparison on the negentropy anomaly accumulation between the proposed method and strain difference method (b)
The strain observation data at Guzan station and time domain curves of two algorithms (a) and comparison on the negentropy anomaly accumulation between the proposed method and strain difference method (b)
-
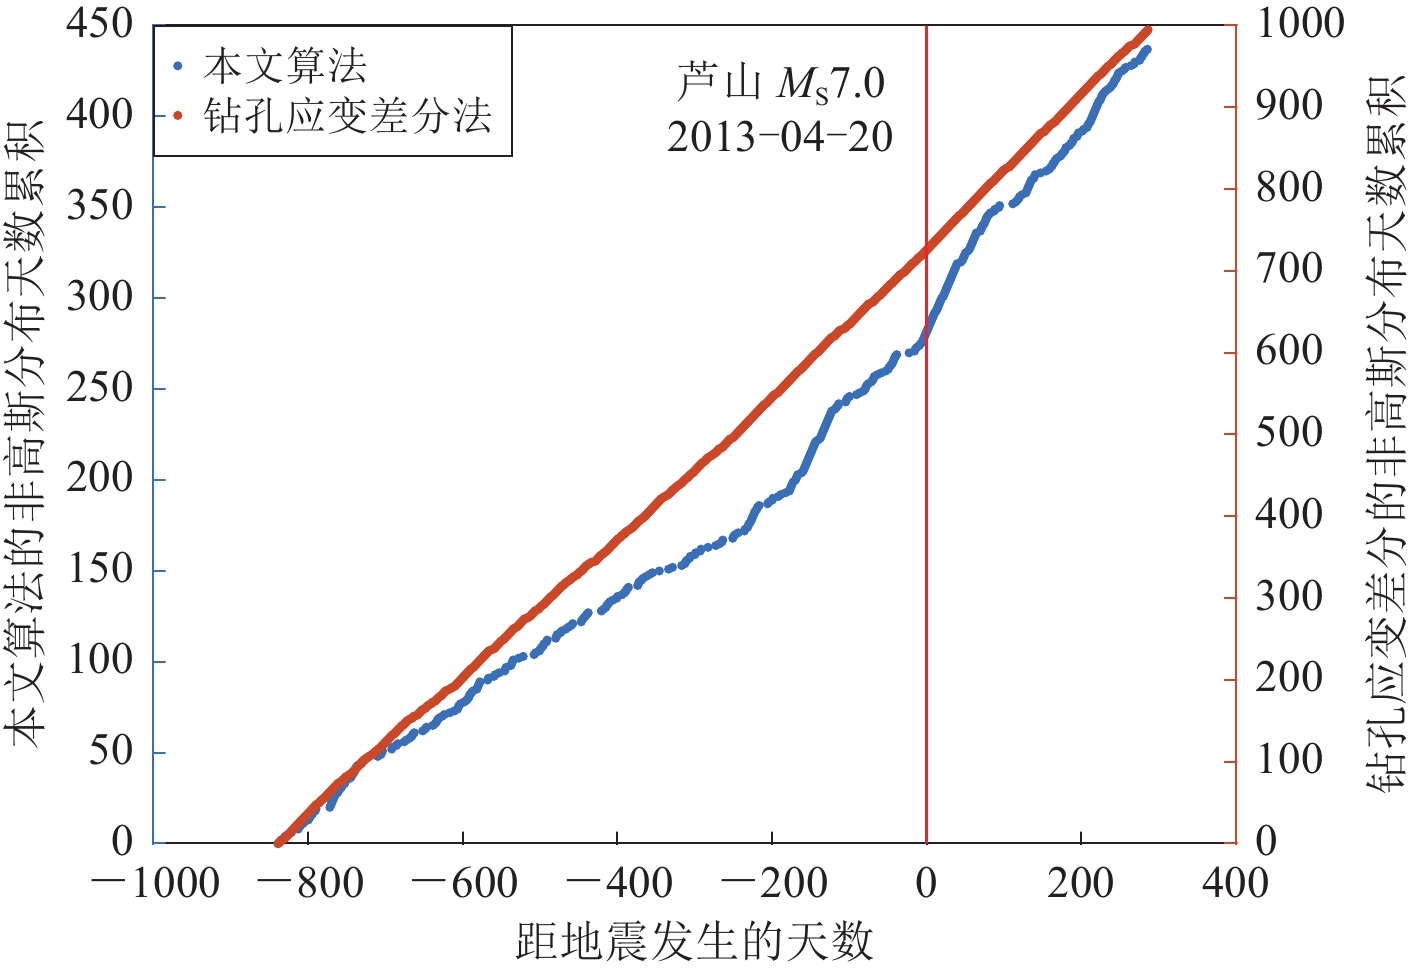
![]() Accumulated days of non-Gaussian distribution of borehole strain difference and crustal strain
Accumulated days of non-Gaussian distribution of borehole strain difference and crustal strain
-
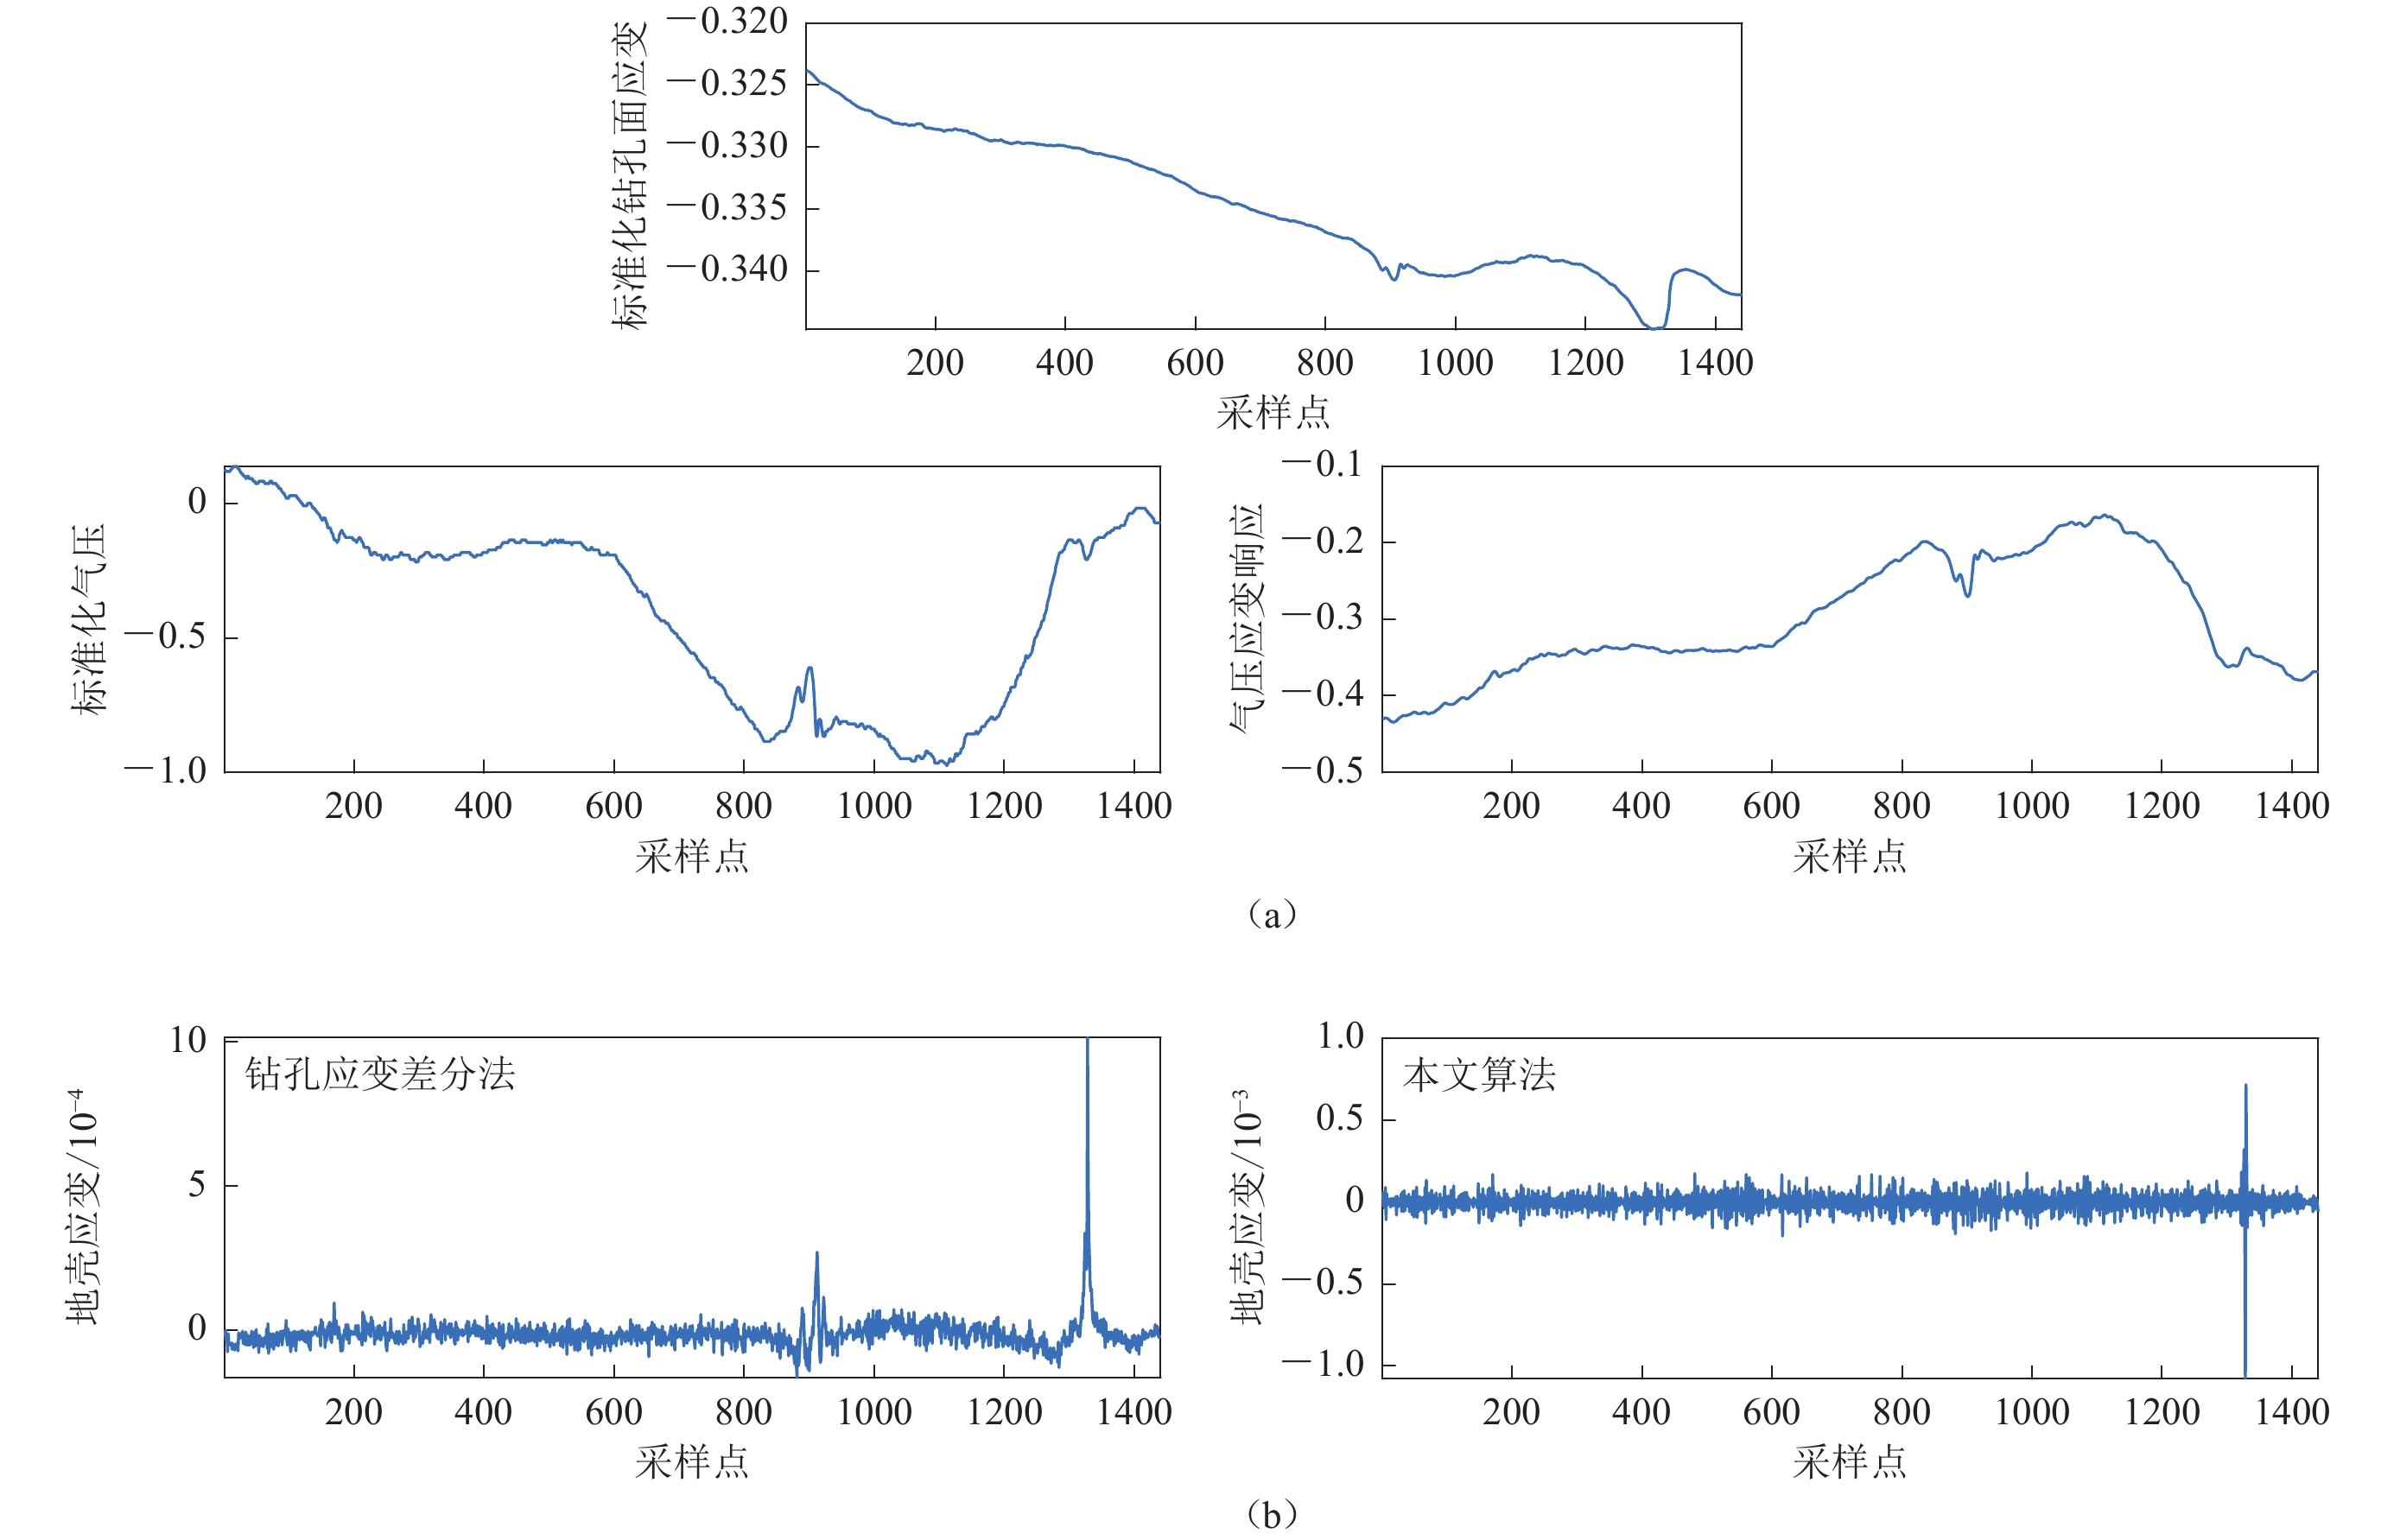
![]() Air pressure data and its strain response (a) and crustal strain received by the proposed method and strain difference method (b)on June 13,2012
Air pressure data and its strain response (a) and crustal strain received by the proposed method and strain difference method (b)on June 13,2012
Related articles
-
2022, 44(4): 700-710. DOI: 10.11939/jass.20210101
-
2022, 44(2): 316-326. DOI: 10.11939/jass.20210198
-
2019, 41(3): 354-365. DOI: 10.11939/jass.20190140
-
2018, 40(3): 1-1.
-
2016, 38(1): 146-154. DOI: 10.11939/jass.2016.01.015
-
2015, 37(3): 508-515. DOI: 10.11939/jass.2015.03.013
-
2014, 36(4): 615-631. DOI: 10.3969/j.issn.0253-3782.2014.04.008
-
2010, 32(1): 51-59.
-
2009, 31(1): 1-12.
-
2004, 26(2): 223-227.
